Analytics Icon

Key Driver Analytics Ppt PowerPoint Presentation Microsoft
This is a key driver analytics ppt powerpoint presentation microsoft. This is a five stage process. The stages in this process are icons, business, marketing, strategy, success.
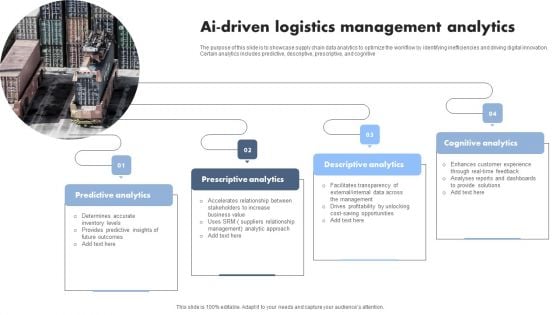
AI Driven Logistics Management Analytics Professional PDF
The purpose of this slide is to showcase supply chain data analytics to optimize the workflow by identifying inefficiencies and driving digital innovation. Certain analytics includes predictive, descriptive, prescriptive, and cognitive. Presenting AI Driven Logistics Management Analytics Professional PDF to dispense important information. This template comprises four stages. It also presents valuable insights into the topics including Predictive Analytics, Prescriptive Analytics, Descriptive Analytics. This is a completely customizable PowerPoint theme that can be put to use immediately. So, download it and address the topic impactfully.
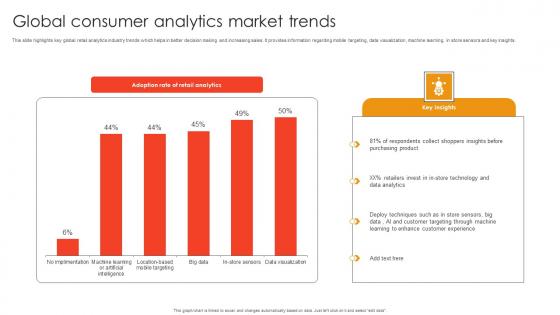
Global Consumer Analytics Market Trends Template Pdf
This slide highlights key global retail analytics industry trends which helps in better decision making and increasing sales. It provides information regarding mobile targeting, data visualization, machine learning, in store sensors and key insights. Pitch your topic with ease and precision using this Global Consumer Analytics Market Trends Template Pdf. This layout presents information on Respondents Collect Shoppers, Retailers Invest Store, Deploy Techniques Store Sensors. It is also available for immediate download and adjustment. So, changes can be made in the color, design, graphics or any other component to create a unique layout. This slide highlights key global retail analytics industry trends which helps in better decision making and increasing sales. It provides information regarding mobile targeting, data visualization, machine learning, in store sensors and key insights.
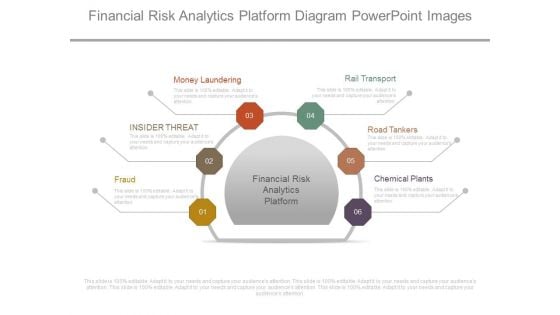
Financial Risk Analytics Platform Diagram Powerpoint Images
This is a financial risk analytics platform diagram powerpoint images. This is a six stage process. The stages in this process are money laundering, insider threat, fraud, rail transport, road tankers, chemical plants, financial risk analytics platform.
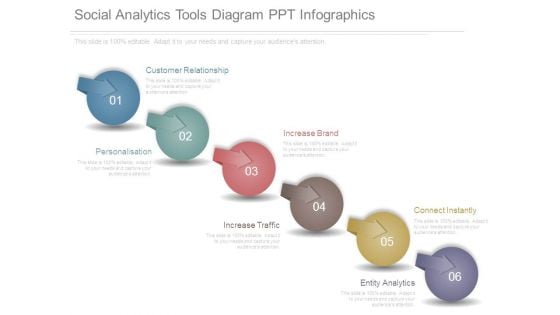
Social Analytics Tools Diagram Ppt Infographics
This is a social analytics tools diagram ppt infographics. This is a six stage process. The stages in this process are customer relationship, personalisation, increase brand, increase traffic, connect instantly, entity analytics.
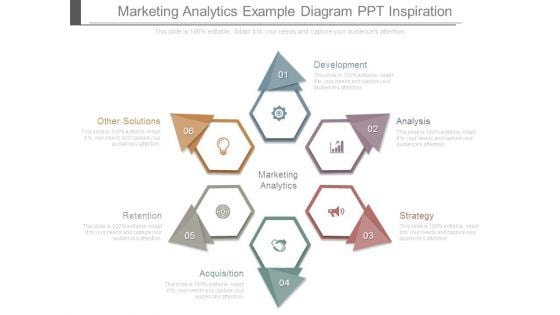
Marketing Analytics Example Diagram Ppt Inspiration
This is a marketing analytics example diagram ppt inspiration. This is a six stage process. The stages in this process are marketing analytics, development, analysis, strategy, acquisition, retention, other solutions.
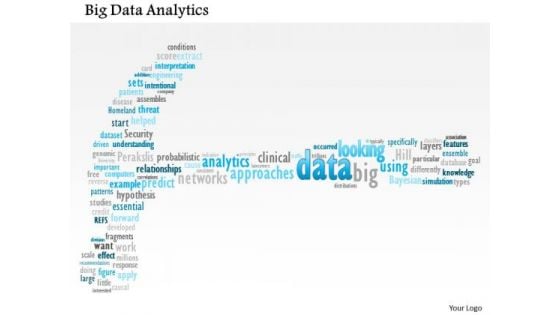
Business Framework Big Data Analytics PowerPoint Presentation
This unique power point diagram slide has been crafted with big data analytics. This data analytics is used to improve predictions and support decision making. Use this image slide for big data analysis related presentations.
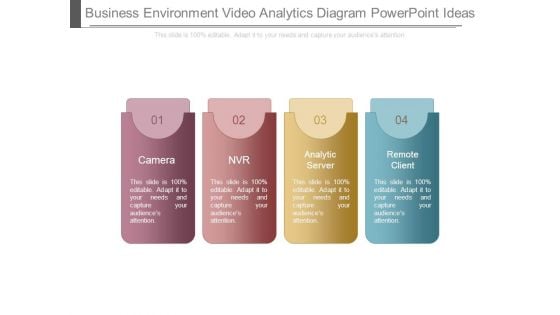
Business Environment Video Analytics Diagram Powerpoint Ideas
This is a business environment video analytics diagram powerpoint ideas. This is a four stage process. The stages in this process are camera, nvr, analytic server, remote client.
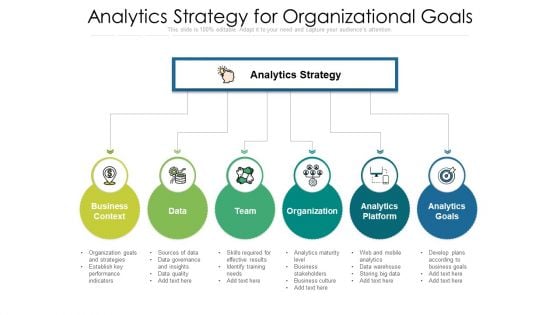
Analytics Strategy For Organizational Goals Clipart PDF
Presenting analytics strategy for organizational goals clipart pdf. to dispense important information. This template comprises six stages. It also presents valuable insights into the topics including business context, organization, analytics platform, analytics goals. This is a completely customizable PowerPoint theme that can be put to use immediately. So, download it and address the topic impactfully.
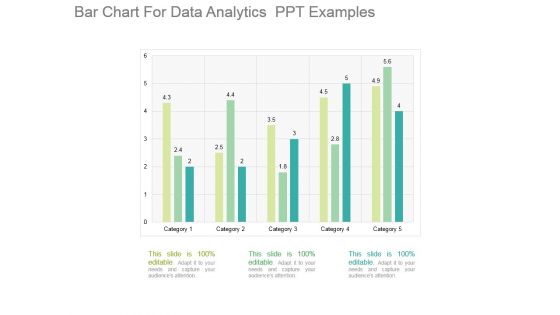
Bar Chart For Data Analytics Ppt Examples
This is a bar chart for data analytics ppt examples. This is a five stage process. The stages in this process are category.
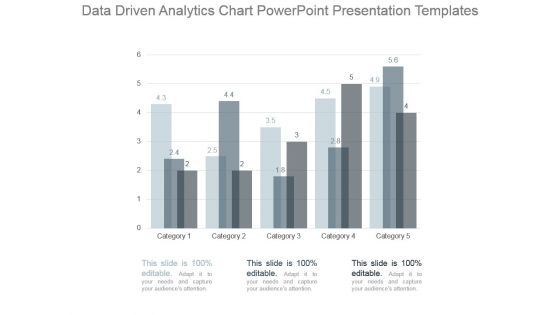
Data Driven Analytics Chart Powerpoint Presentation Templates
This is a data driven analytics chart powerpoint presentation templates. This is a five stage process. The stages in this process are category.
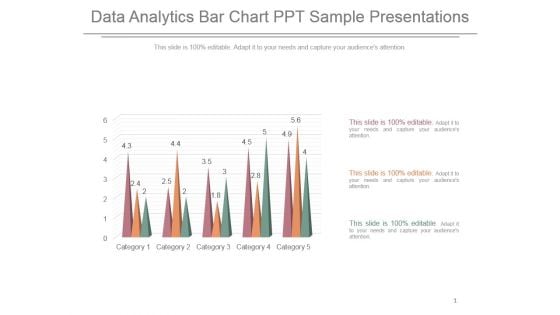
Data Analytics Bar Chart Ppt Sample Presentations
This is a data analytics bar chart ppt sample presentations. This is a five stage process. The stages in this process are category.
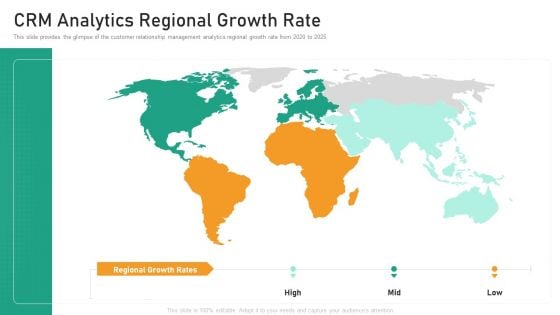
CRM Analytics Regional Growth Rate Diagrams PDF
This slide provides the glimpse of the customer relationship management analytics regional growth rate from 2020 to 2025.This is a crm analytics regional growth rate diagrams pdf template with various stages. Focus and dispense information on three stages using this creative set, that comes with editable features. It contains large content boxes to add your information on topics like crm analytics regional growth rate. You can also showcase facts, figures, and other relevant content using this PPT layout. Grab it now.
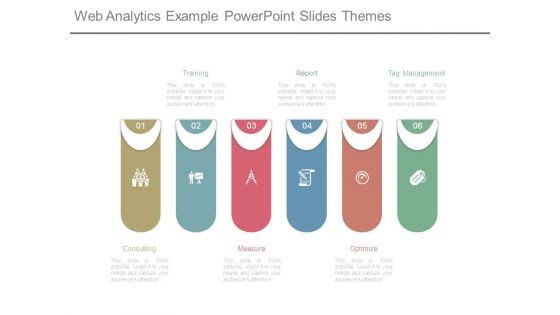
Web Analytics Example Powerpoint Slides Themes
This is a web analytics example powerpoint slides themes. This is a six stage process. The stages in this process are consulting, training, measure, report, optimize, tag management.
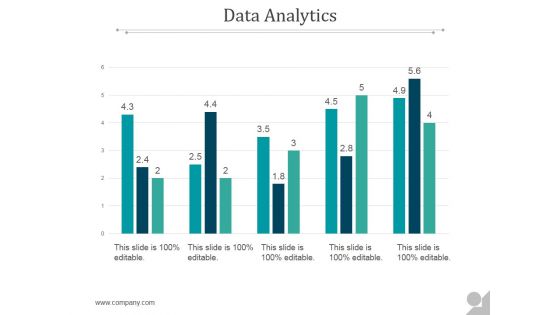
Data Analytics Ppt PowerPoint Presentation Themes
This is a data analytics ppt powerpoint presentation themes. This is a five stage process. The stages in this process are business, marketing, presentation, data analyst, management.
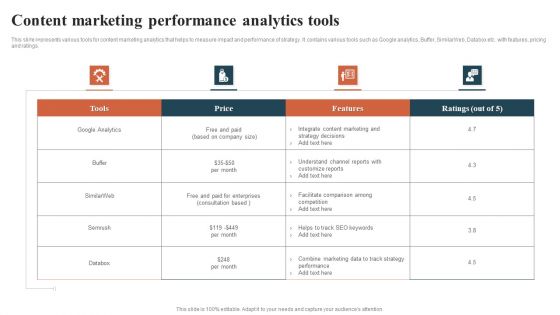
Content Marketing Performance Analytics Tools Themes PDF
This slide represents various tools for content marketing analytics that helps to measure impact and performance of strategy. It contains various tools such as Google analytics, Buffer, SimilarWeb, Databox etc. with features, pricing and ratings. Showcasing this set of slides titled Content Marketing Performance Analytics Tools Themes PDF. The topics addressed in these templates are Content Marketing, Performance Analytics Tools. All the content presented in this PPT design is completely editable. Download it and make adjustments in color, background, font etc. as per your unique business setting.
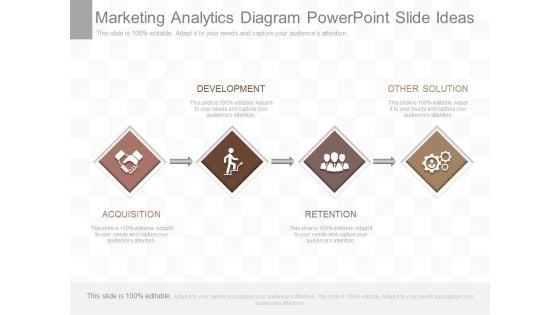
Marketing Analytics Diagram Powerpoint Slide Ideas
This is a marketing analytics diagram powerpoint slide ideas. This is a four stage process. The stages in this process are development, other solution, acquisition, retention.
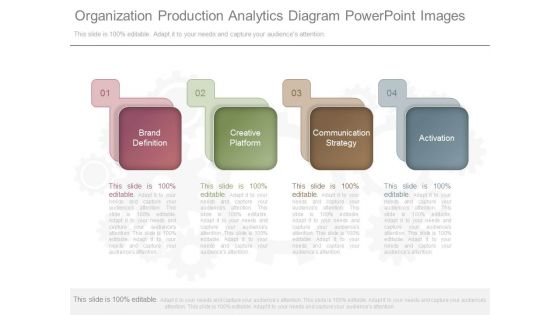
Organization Production Analytics Diagram Powerpoint Images
This is a organization production analytics diagram powerpoint images. This is a four stage process. The stages in this process are brand definition, creative platform, communication strategy, activation.
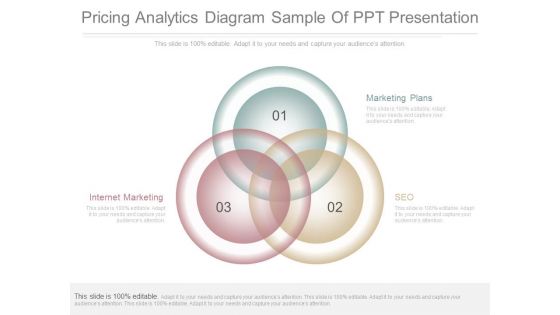
Pricing Analytics Diagram Sample Of Ppt Presentation
This is a pricing analytics diagram sample of ppt presentation. This is a three stage process. The stages in this process are internet marketing, marketing plans, seo.
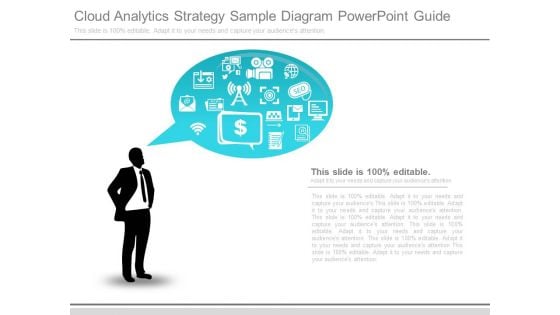
Cloud Analytics Strategy Sample Diagram Powerpoint Guide
This is a cloud analytics strategy sample diagram powerpoint guide. This is a one stage process. The stages in this process are business, marketing, thought, presentation, strategy.
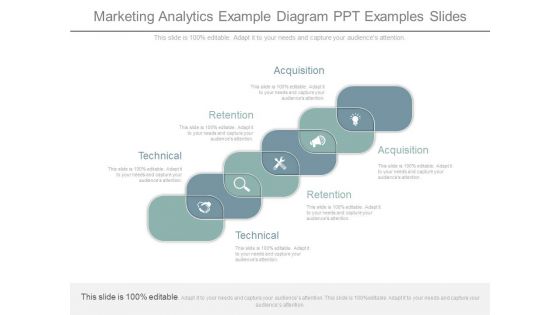
Marketing Analytics Example Diagram Ppt Examples Slides
This is a marketing analytics example diagram ppt examples slides. This is a six stage process. The stages in this process are acquisition, retention, technical.

Trade Promotion Analytics Diagram Powerpoint Layout
This is a trade promotion analytics diagram powerpoint layout. This is a six stage process. The stages in this process are plan, regression, perform, evaluate, settlement, optimization.
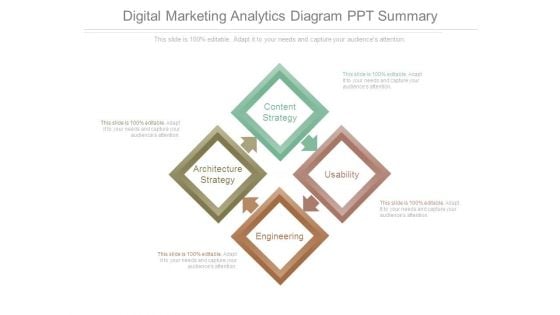
Digital Marketing Analytics Diagram Ppt Summary
This is a digital marketing analytics diagram ppt summary. This is a four stage process. The stages in this process are content strategy, usability, engineering, architecture, strategy.
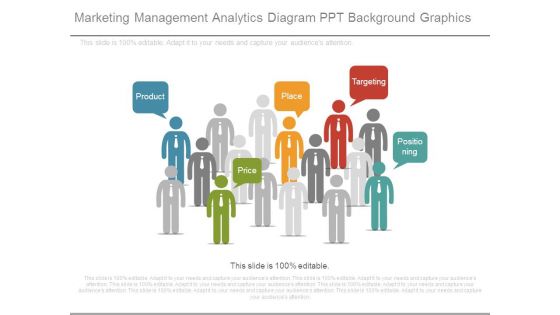
Marketing Management Analytics Diagram Ppt Background Graphics
This is a marketing management analytics diagram ppt background graphics. This is a five stage process. The stages in this process are product, price, place, targeting, positioning.
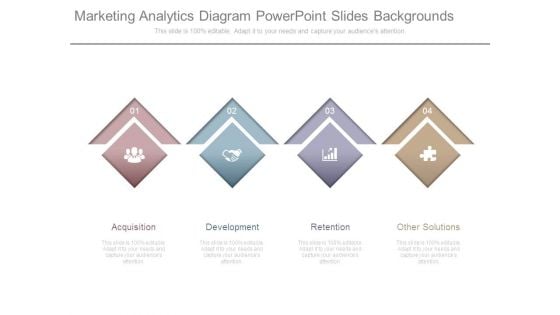
Marketing Analytics Diagram Powerpoint Slides Backgrounds
This is a marketing analytics diagram powerpoint slides backgrounds. This is a four stage process. The stages in this process are acquisition, development, retention, other solutions.
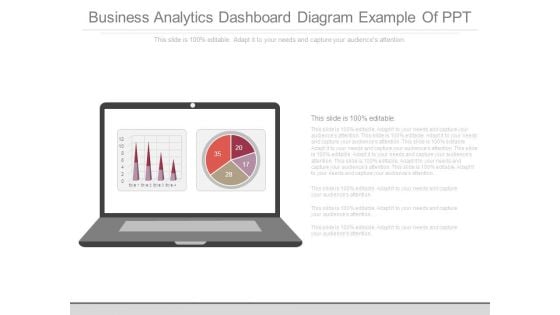
Business Analytics Dashboard Diagram Example Of Ppt
This is a business analytics dashboard diagram example of ppt. This is a one stage process. The stages in this process are business, management, strategy, pie, presentation.
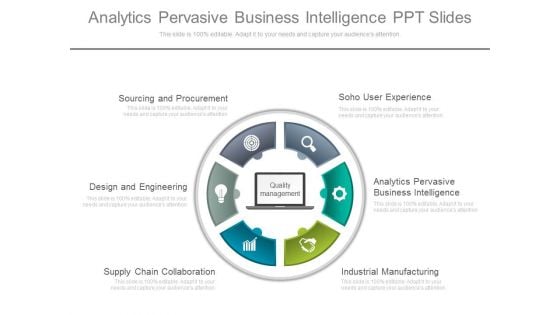
Analytics Pervasive Business Intelligence Ppt Slides
This is a analytics pervasive business intelligence ppt slides. This is a six stage process. The stages in this process are circle charts, business, marketing.

Ebitda Data Analytics Company Outline Topics PDF
This slide illustrates a graph of EBITDA for Kantar company showing growth trend in from 2021. It also showcases key insights for EBITDA highlighting estimated EBITDA for 2022 and 2023. Present like a pro with Ebitda Data Analytics Company Outline Topics PDF Create beautiful presentations together with your team, using our easy-to-use presentation slides. Share your ideas in real-time and make changes on the fly by downloading our templates. So whether you are in the office, on the go, or in a remote location, you can stay in sync with your team and present your ideas with confidence. With Slidegeeks presentation got a whole lot easier. Grab these presentations today. This slide illustrates a graph of EBITDA for Kantar company showing growth trend in from 2021. It also showcases key insights for EBITDA highlighting estimated EBITDA for 2022 and 2023
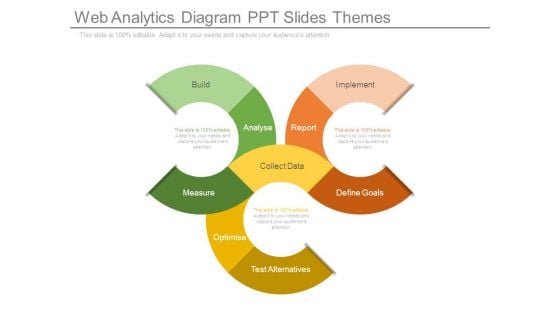
Web Analytics Diagram Ppt Slides Themes
This is a web analytics diagram ppt slides themes. This is a three stage process. The stages in this process are build, analyse, measure, test alternatives, optimise, collect data, define goals, report, implement.
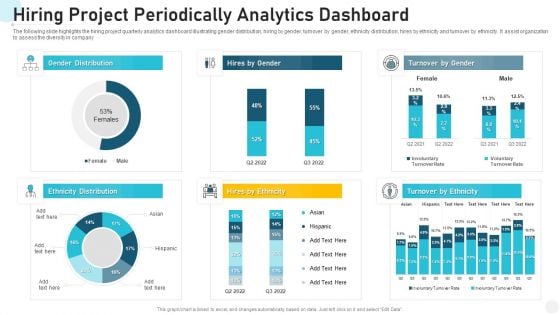
Hiring Project Periodically Analytics Dashboard Summary PDF
The following slide highlights the hiring project quarterly analytics dashboard illustrating gender distribution, hiring by gender, turnover by gender, ethnicity distribution, hires by ethnicity and turnover by ethnicity. It assist organization to assess the diversity in company Showcasing this set of slides titled hiring project periodically analytics dashboard summary pdf. The topics addressed in these templates are hiring project periodically analytics dashboard. All the content presented in this PPT design is completely editable. Download it and make adjustments in color, background, font etc. as per your unique business setting.
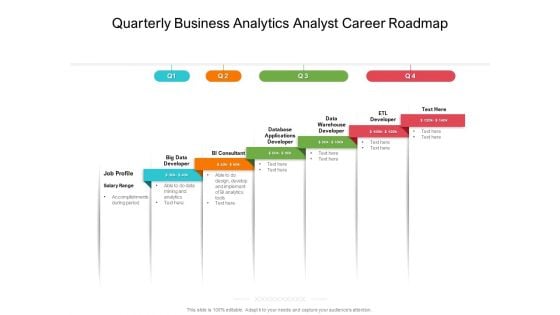
Quarterly Business Analytics Analyst Career Roadmap Themes
We present our quarterly business analytics analyst career roadmap themes. This PowerPoint layout is easy-to-edit so you can change the font size, font type, color, and shape conveniently. In addition to this, the PowerPoint layout is Google Slides compatible, so you can share it with your audience and give them access to edit it. Therefore, download and save this well-researched quarterly business analytics analyst career roadmap themes in different formats like PDF, PNG, and JPG to smoothly execute your business plan.
Sample Of Internet Analytics Template Powerpoint Themes
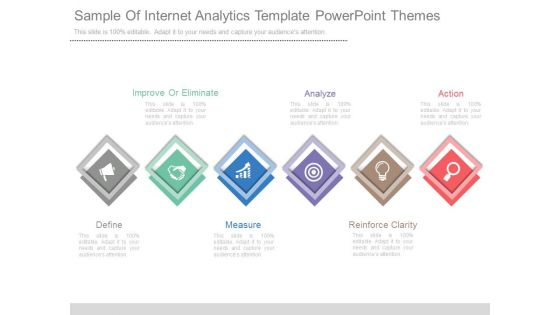
This is a sample of internet analytics template powerpoint themes. This is a six stage process. The stages in this process are improve or eliminate, analyze, action, define, measure, reinforce clarity.
Web Analytics Process Diagram Powerpoint Images
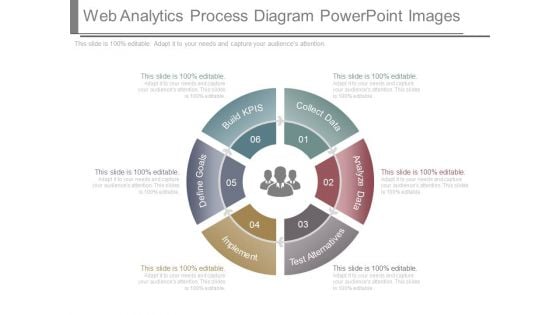
This is a web analytics process diagram powerpoint images. This is a six stage process. The stages in this process are build kpis, define goals, implement, test alternatives, analyze data, collect data.
Comprehensive Business Analytics Diagram Powerpoint Templates
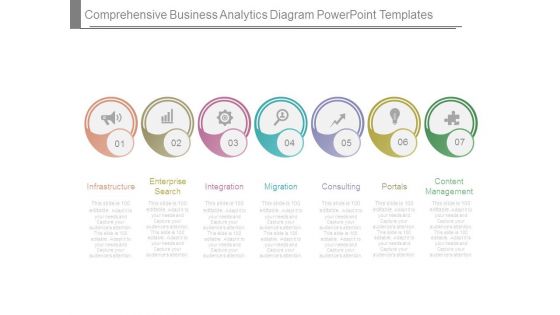
This is a comprehensive business analytics diagram powerpoint templates. This is a seven stage process. The stages in this process are infrastructure, enterprise search, integration, migration, consulting, portals, content management.
Sample Of Visual Analytics Diagram Powerpoint Guide
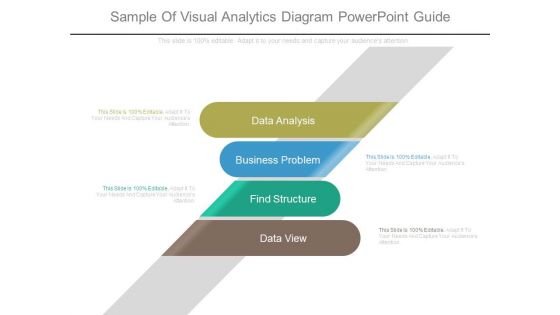
This is a sample of visual analytics diagram powerpoint guide. This is a four stage process. The stages in this process are data analysis, business problem, find structure, data view.
Meter Statistic Analytics Ppt Diagram Powerpoint Templates
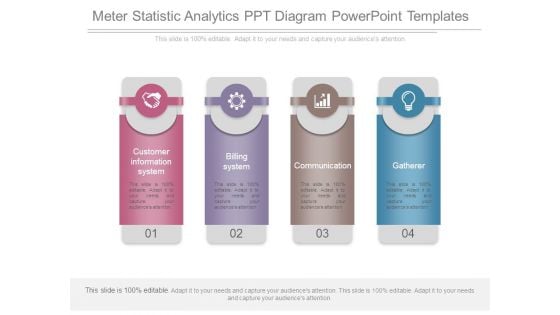
This is a meter statistic analytics ppt diagram powerpoint templates. This is a four stage process. The stages in this process are customer information system, billing system, communication, gatherer.
Web Analytics Process Diagram Presentation Backgrounds
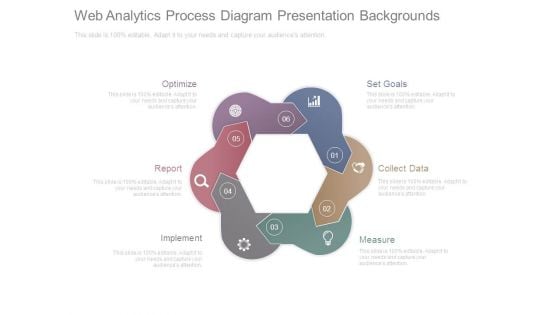
This is a web analytics process diagram presentation backgrounds. This is a six stage process. The stages in this process are optimize, report, implement, measure, collect data, set goals.
Half Yearly Data Analytics Implementation Roadmap Demonstration
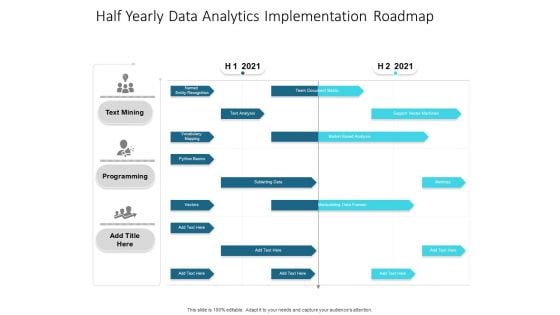
We present our half yearly data analytics implementation roadmap demonstration. This PowerPoint layout is easy-to-edit so you can change the font size, font type, color, and shape conveniently. In addition to this, the PowerPoint layout is Google Slides compatible, so you can share it with your audience and give them access to edit it. Therefore, download and save this well-researched half yearly data analytics implementation roadmap demonstration in different formats like PDF, PNG, and JPG to smoothly execute your business plan.
Website Performance Analytics Ppt PowerPoint Presentation Show
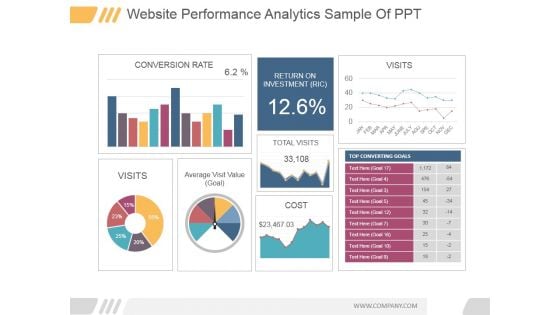
This is a website performance analytics ppt powerpoint presentation show. This is a three stage process. The stages in this process are conversion rate, visits, average visit value goal, return on investment ric, total visits, cost.
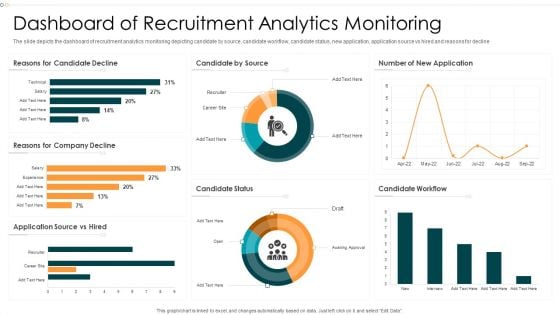
Dashboard Of Recruitment Analytics Monitoring Brochure PDF
The slide depicts the dashboard of recruitment analytics monitoring depicting candidate by source, candidate workflow, candidate status, new application, application source vs hired and reasons for decline.Showcasing this set of slides titled Dashboard Of Recruitment Analytics Monitoring Brochure PDF The topics addressed in these templates are Candidate Workflow, Reasons Candidate, Candidate Status All the content presented in this PPT design is completely editable. Download it and make adjustments in color, background, font etc. as per your unique business setting.
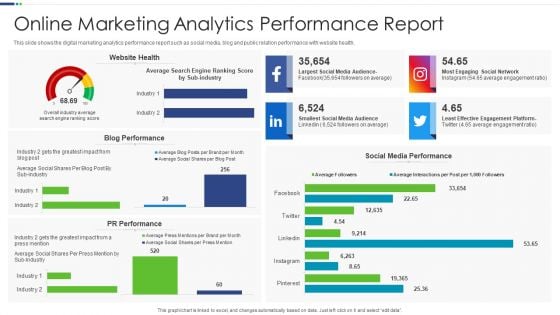
Online Marketing Analytics Performance Report Microsoft PDF
This slide shows the digital marketing analytics performance report such as social media, blog and public relation performance with website health.Pitch your topic with ease and precision using this Online Marketing Analytics Performance Report Microsoft PDF This layout presents information on Blog Performance, Media Performance, Effective Engagement It is also available for immediate download and adjustment. So, changes can be made in the color, design, graphics or any other component to create a unique layout.
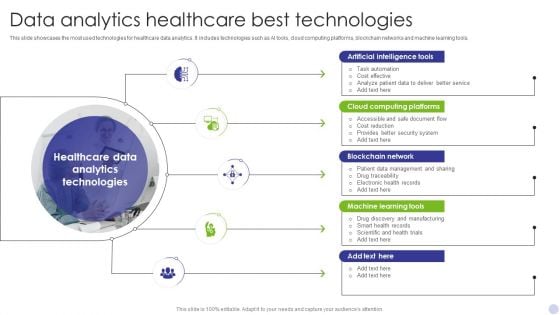
Data Analytics Healthcare Best Technologies Template PDF
This slide showcases the most used technologies for healthcare data analytics. It includes technologies such as AI tools, cloud computing platforms, blockchain networks and machine learning tools. Presenting Data Analytics Healthcare Best Technologies Template PDF to dispense important information. This template comprises Five stages. It also presents valuable insights into the topics including Artificial Intelligence Tools, Cloud Computing Platforms, Blockchain Network. This is a completely customizable PowerPoint theme that can be put to use immediately. So, download it and address the topic impactfully.
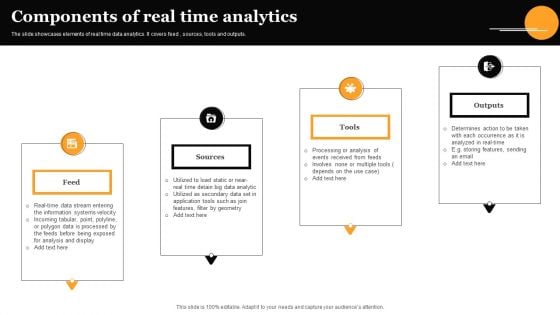
Components Of Real Time Analytics Graphics PDF
The slide showcases elements of real time data analytics. It covers feed, sources, tools and outputs. Presenting Components Of Real Time Analytics Graphics PDF to dispense important information. This template comprises four stages. It also presents valuable insights into the topics including Feed, Sources, Tools . This is a completely customizable PowerPoint theme that can be put to use immediately. So, download it and address the topic impactfully.
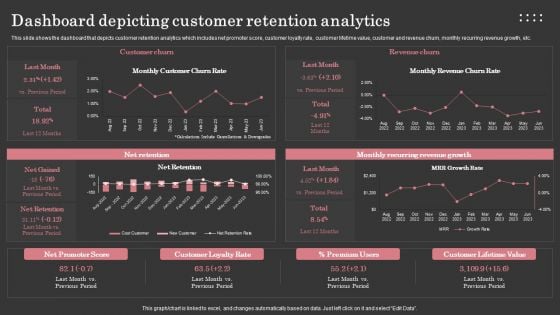
Dashboard Depicting Customer Retention Analytics Background PDF
This slide shows the dashboard that depicts customer retention analytics which includes net promoter score, customer loyalty rate, customer lifetime value, customer and revenue churn, monthly recurring revenue growth, etc. Make sure to capture your audiences attention in your business displays with our gratis customizable Dashboard Depicting Customer Retention Analytics Background PDF. These are great for business strategies, office conferences, capital raising or task suggestions. If you desire to acquire more customers for your tech business and ensure they stay satisfied, create your own sales presentation with these plain slides.
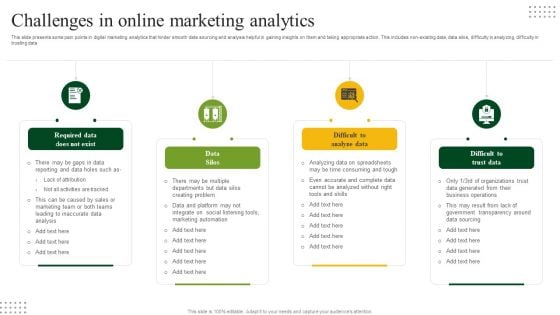
Challenges In Online Marketing Analytics Elements PDF
This slide presents some pain points in digital marketing analytics that hinder smooth data sourcing and analysis helpful in gaining insights on them and taking appropriate action. This includes non-existing data, data silos, difficulty in analyzing, difficulty in trusting data. Presenting Challenges In Online Marketing Analytics Elements PDF to dispense important information. This template comprises four stages. It also presents valuable insights into the topics including Data Silos, Difficult Analyze Data, Difficult Trust Data. This is a completely customizable PowerPoint theme that can be put to use immediately. So, download it and address the topic impactfully.
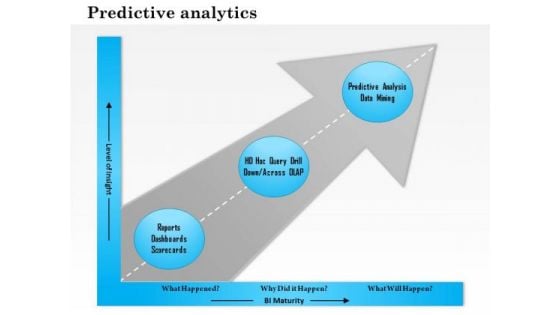
Business Framework Predictive Analytics PowerPoint Presentation
Explain the concept of predictive analytics in any presentation with this unique PPT slide. This PPT diagram slide contains the graphic of arrow diagram with three text boxes on a graph. This PPT slide shows the growth analysis an make a professional presentation.
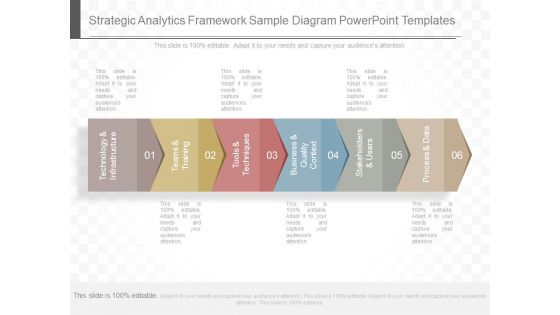
Strategic Analytics Framework Sample Diagram Powerpoint Templates
This is a strategic analytics framework sample diagram powerpoint templates. This is a six stage process. The stages in this process are technology and infrastructure, teams and training, tools and techniques, business and quality context, stakeholders and users, process and data.

Agenda For Data Analytics Management Diagrams PDF
Presenting Agenda For Data Analytics Management Diagrams PDF to provide visual cues and insights. Share and navigate important information on five stages that need your due attention. This template can be used to pitch topics like Agenda. In addtion, this PPT design contains high resolution images, graphics, etc, that are easily editable and available for immediate download.
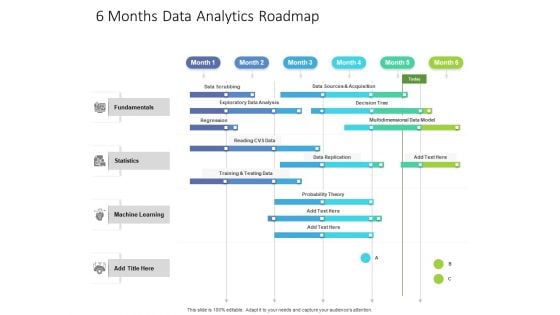
6 Months Data Analytics Roadmap Diagrams
Presenting our innovatively-structured 6 months data analytics roadmap diagrams Template. Showcase your roadmap process in different formats like PDF, PNG, and JPG by clicking the download button below. This PPT design is available in both Standard Screen and Widescreen aspect ratios. It can also be easily personalized and presented with modified font size, font type, color, and shapes to measure your progress in a clear way.
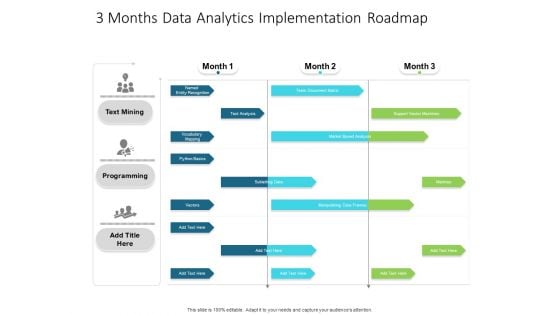
3 Months Data Analytics Implementation Roadmap Elements
Presenting our innovatively-structured 3 months data analytics implementation roadmap elements Template. Showcase your roadmap process in different formats like PDF, PNG, and JPG by clicking the download button below. This PPT design is available in both Standard Screen and Widescreen aspect ratios. It can also be easily personalized and presented with modified font size, font type, color, and shapes to measure your progress in a clear way.

3 Months Data Analytics Roadmap Structure
Introducing our 3 months data analytics roadmap structure. This PPT presentation is Google Slides compatible, therefore, you can share it easily with the collaborators for measuring the progress. Also, the presentation is available in both standard screen and widescreen aspect ratios. So edit the template design by modifying the font size, font type, color, and shapes as per your requirements. As this PPT design is fully editable it can be presented in PDF, JPG and PNG formats.
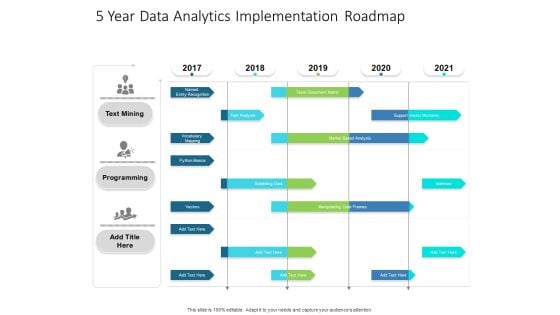
5 Year Data Analytics Implementation Roadmap Topics
Presenting our innovatively-structured 5 year data analytics implementation roadmap topics Template. Showcase your roadmap process in different formats like PDF, PNG, and JPG by clicking the download button below. This PPT design is available in both Standard Screen and Widescreen aspect ratios. It can also be easily personalized and presented with modified font size, font type, color, and shapes to measure your progress in a clear way.

5 Year Data Analytics Roadmap Infographics
Introducing our 5 year data analytics roadmap infographics. This PPT presentation is Google Slides compatible, therefore, you can share it easily with the collaborators for measuring the progress. Also, the presentation is available in both standard screen and widescreen aspect ratios. So edit the template design by modifying the font size, font type, color, and shapes as per your requirements. As this PPT design is fully editable it can be presented in PDF, JPG and PNG formats.
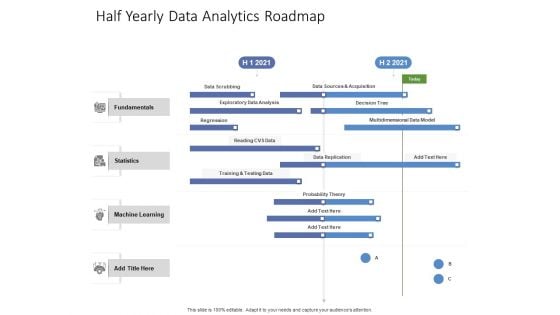
Half Yearly Data Analytics Roadmap Ideas
Presenting our innovatively-structured half yearly data analytics roadmap ideas Template. Showcase your roadmap process in different formats like PDF, PNG, and JPG by clicking the download button below. This PPT design is available in both Standard Screen and Widescreen aspect ratios. It can also be easily personalized and presented with modified font size, font type, color, and shapes to measure your progress in a clear way.
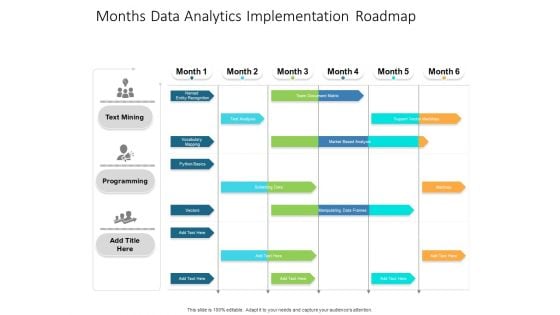
Months Data Analytics Implementation Roadmap Structure
Presenting our jaw-dropping months data analytics implementation roadmap structure. You can alternate the color, font size, font type, and shapes of this PPT layout according to your strategic process. This PPT presentation is compatible with Google Slides and is available in both standard screen and widescreen aspect ratios. You can also download this well-researched PowerPoint template design in different formats like PDF, JPG, and PNG. So utilize this visually-appealing design by clicking the download button given below.
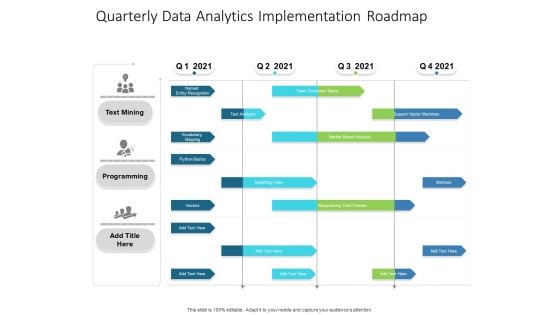
Quarterly Data Analytics Implementation Roadmap Pictures
Presenting our innovatively-structured quarterly data analytics implementation roadmap pictures Template. Showcase your roadmap process in different formats like PDF, PNG, and JPG by clicking the download button below. This PPT design is available in both Standard Screen and Widescreen aspect ratios. It can also be easily personalized and presented with modified font size, font type, color, and shapes to measure your progress in a clear way.
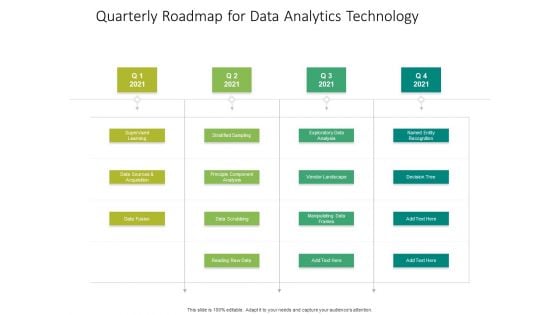
Quarterly Roadmap For Data Analytics Technology Slides
Presenting our jaw-dropping quarterly roadmap for data analytics technology slides. You can alternate the color, font size, font type, and shapes of this PPT layout according to your strategic process. This PPT presentation is compatible with Google Slides and is available in both standard screen and widescreen aspect ratios. You can also download this well-researched PowerPoint template design in different formats like PDF, JPG, and PNG. So utilize this visually-appealing design by clicking the download button given below.
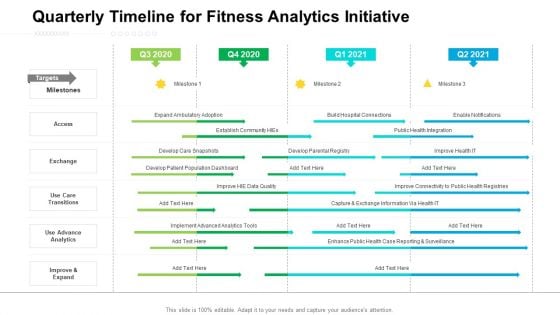
Quarterly Timeline For Fitness Analytics Initiative Structure
Presenting our jaw dropping quarterly timeline for fitness analytics initiative structure. You can alternate the color, font size, font type, and shapes of this PPT layout according to your strategic process. This PPT presentation is compatible with Google Slides and is available in both standard screen and widescreen aspect ratios. You can also download this well researched PowerPoint template design in different formats like PDF, JPG, and PNG. So utilize this visually appealing design by clicking the download button given below.
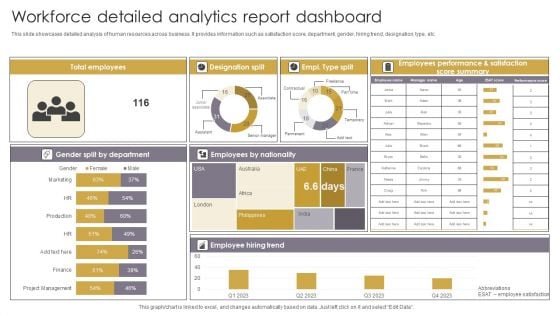
Workforce Detailed Analytics Report Dashboard Mockup PDF
This slide showcases detailed analysis of human resources across business. It provides information such as satisfaction score, department, gender, hiring trend, designation, type, etc. Showcasing this set of slides titled Workforce Detailed Analytics Report Dashboard Mockup PDF. The topics addressed in these templates are Employees, Designation Split, Employees By Nationality. All the content presented in this PPT design is completely editable. Download it and make adjustments in color, background, font etc. as per your unique business setting.
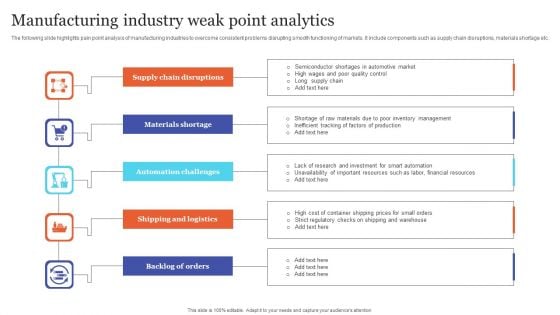
Manufacturing Industry Weak Point Analytics Designs PDF
The following slide highlights pain point analysis of manufacturing industries to overcome consistent problems disrupting smooth functioning of markets. It include components such as supply chain disruptions, materials shortage etc. Presenting Manufacturing Industry Weak Point Analytics Designs PDF to dispense important information. This template comprises five stages. It also presents valuable insights into the topics including Disruptions, Shortage, Challenges. This is a completely customizable PowerPoint theme that can be put to use immediately. So, download it and address the topic impactfully.

 Home
Home