Bar Graph Table
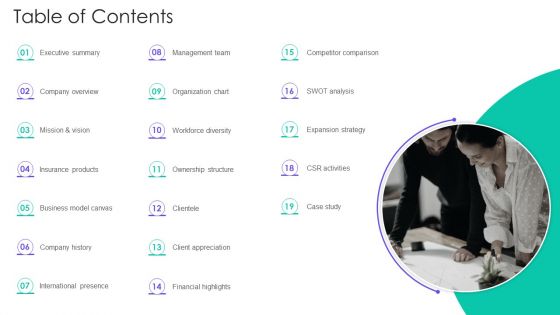
Insurance Services Firm Profile Table Of Contents Guidelines PDF
Presenting Insurance Services Firm Profile Table Of Contents Guidelines PDF to provide visual cues and insights. Share and navigate important information on one stages that need your due attention. This template can be used to pitch topics like Management Team, Organization Chart, Financial Highlights. In addtion, this PPT design contains high resolution images, graphics, etc, that are easily editable and available for immediate download.

Headline Footer Section Chart Table Ppt PowerPoint Presentation Complete Deck
Boost your confidence and team morale with this well-structured headline footer section chart table ppt powerpoint presentation complete deck. This prefabricated set gives a voice to your presentation because of its well-researched content and graphics. Our experts have added all the components very carefully, thus helping you deliver great presentations with a single click. Not only that, it contains a set of eleven slides that are designed using the right visuals, graphics, etc. Various topics can be discussed, and effective brainstorming sessions can be conducted using the wide variety of slides added in this complete deck. Apart from this, our PPT design contains clear instructions to help you restructure your presentations and create multiple variations. The color, format, design anything can be modified as deemed fit by the user. Not only this, it is available for immediate download. So, grab it now.
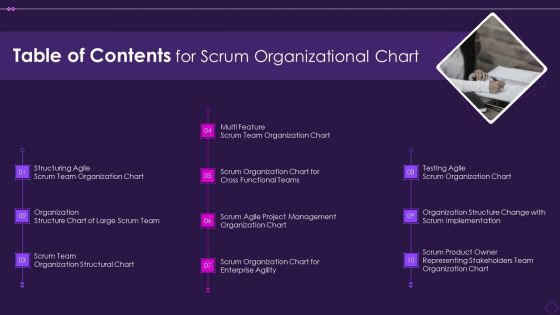
Table Of Contents For Scrum Organizational Chart Rules PDF
This is a table of contents for scrum organizational chart rules pdf template with various stages. Focus and dispense information on ten stages using this creative set, that comes with editable features. It contains large content boxes to add your information on topics like organization, management, teams, implementation. You can also showcase facts, figures, and other relevant content using this PPT layout. Grab it now.
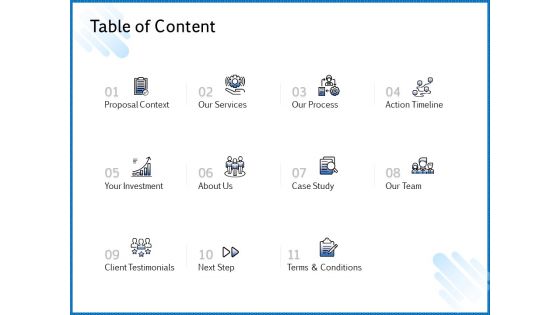
Web Design Template Table Of Content Introduction PDF
This is a web design template table of content introduction pdf template with various stages. Focus and dispense information on eleven stages using this creative set, that comes with editable features. It contains large content boxes to add your information on topics like proposal context, services, process, action timeline, investment. You can also showcase facts, figures, and other relevant content using this PPT layout. Grab it now.

Company Process Handbook Table Of Contents Ppt Professional Images PDF
This is a company process handbook table of contents ppt professional images pdf template with various stages. Focus and dispense information on nine stages using this creative set, that comes with editable features. It contains large content boxes to add your information on topics like business model, business financials, marketing, human resource, business incorporation. You can also showcase facts, figures, and other relevant content using this PPT layout. Grab it now.
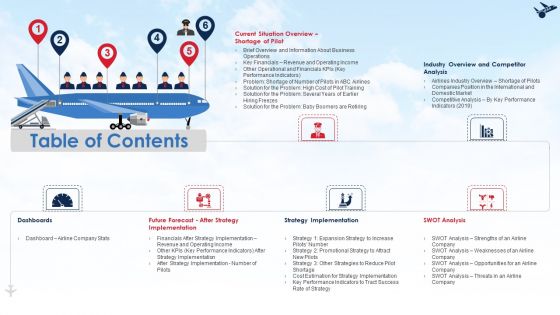
Table Of Contents Ppt File Graphic Images PDF
This is a table of contents ppt file graphic images pdf template with various stages. Focus and dispense information on six stages using this creative set, that comes with editable features. It contains large content boxes to add your information on topics like industry overview, competitor analysis, dashboards, strategy implementation, swot analysis. You can also showcase facts, figures, and other relevant content using this PPT layout. Grab it now.
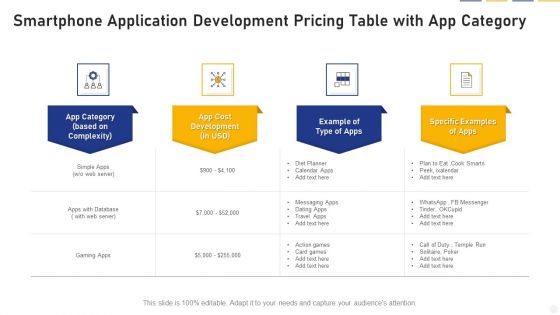
Smartphone Application Development Pricing Table With App Category Graphics PDF
Persuade your audience using this smartphone application development pricing table with app category graphics pdf. This PPT design covers four stages, thus making it a great tool to use. It also caters to a variety of topics including app category, app cost development, example of type of apps, specific examples of apps. Download this PPT design now to present a convincing pitch that not only emphasizes the topic but also showcases your presentation skills.
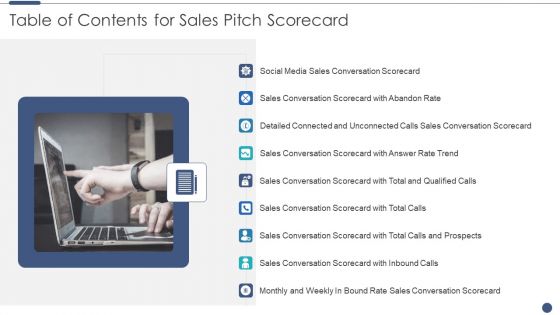
Table Of Contents For Sales Pitch Scorecard Elements PDF
This is a Table Of Contents For Sales Pitch Scorecard Elements PDF template with various stages. Focus and dispense information on three stages using this creative set, that comes with editable features. It contains large content boxes to add your information on topics like Social Media Sales, Sales Conversation, Detailed Connected You can also showcase facts, figures, and other relevant content using this PPT layout. Grab it now.
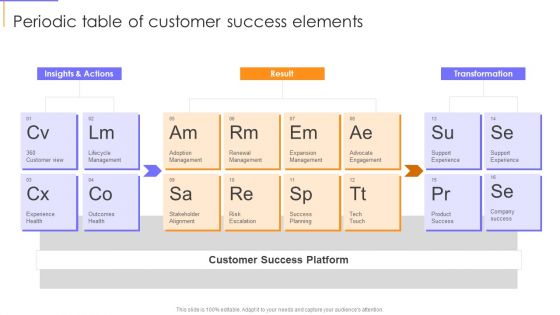
Periodic Table Of Customer Success Elements Elements PDF
This is a Periodic Table Of Customer Success Elements Elements PDF template with various stages. Focus and dispense information on three stages using this creative set, that comes with editable features. It contains large content boxes to add your information on topics like Expansion Management, Renewal Management, Adoption Management. You can also showcase facts, figures, and other relevant content using this PPT layout. Grab it now.
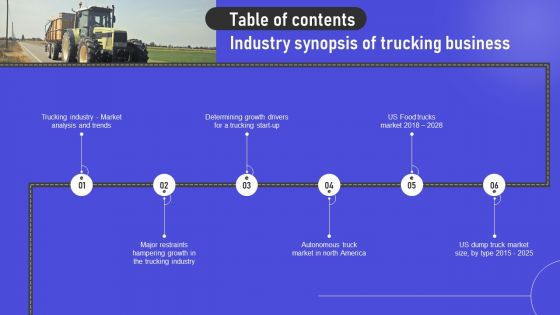
Table Of Contents Industry Synopsis Of Trucking Business Themes PDF
Take your projects to the next level with our ultimate collection of Table Of Contents Industry Synopsis Of Trucking Business Themes PDF. Slidegeeks has designed a range of layouts that are perfect for representing task or activity duration, keeping track of all your deadlines at a glance. Tailor these designs to your exact needs and give them a truly corporate look with your own brand colors they will make your projects stand out from the rest.
Table Of Contents For Smart Grid Technology Designs PDF
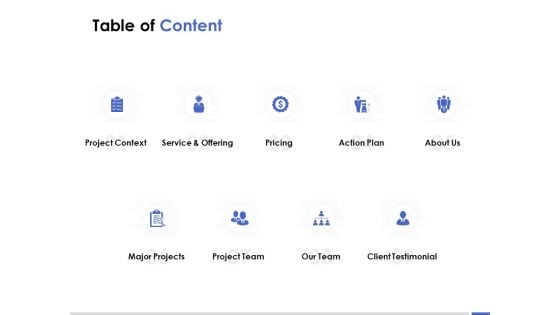
Table Of Content Action Plan Ppt PowerPoint Presentation Layouts Clipart
Presenting this set of slides with name table of content action plan ppt powerpoint presentation layouts clipart. This is a nine stage process. The stages in this process are project context, service, offering pricing, action plan, about us, major projects, project team, our team, client testimonial. This is a completely editable PowerPoint presentation and is available for immediate download. Download now and impress your audience.
Table Of Contents For Business Restructuring Ppt Icon Professional PDF
This is a Table Of Contents For Business Restructuring Ppt Icon Professional PDF template with various stages. Focus and dispense information on nine stages using this creative set, that comes with editable features. It contains large content boxes to add your information on topics like Strategic Organizational Chart, Mitigation Plan Checklist, Evaluation Post Measures, Overall Organizational Risk. You can also showcase facts, figures, and other relevant content using this PPT layout. Grab it now.
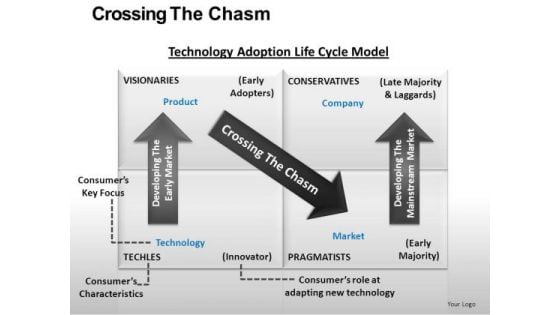
Technology Adoption Lifecycle Chart Table PowerPoint Ppt Slides
Technology_Adoption_LifeCycle_Chart_Table_PowerPoint_PPT_Slides-These high quality powerpoint pre-designed slides and powerpoint templates have been carefully created by our professional team to help you impress your audience. All slides have been created and are 100% editable in powerpoint. Each and every property of any graphic - color, size, orientation, shading, outline etc. can be modified to help you build an effective powerpoint presentation. Any text can be entered at any point in the powerpoint template or slide. Simply DOWNLOAD, TYPE and PRESENT! These PowerPoint presentation slides can be used to represent themes relating to --Alone, apart, chasm, clipart, communication, concept, couple, crack, divide, divorce, estranged, female, figure, gap, gender, graphic, illustration, isolated, isolation, issues, loneliness, love, male, man, people, problems, romance, silhouette, stick, symbol, vector, woman-Technology_Adoption_LifeCycle_Chart_Table_PowerPoint_PPT_Slides Launch products with our Technology Adoption Lifecycle Chart Table PowerPoint Ppt Slides. Download without worries with our money back guaranteee.
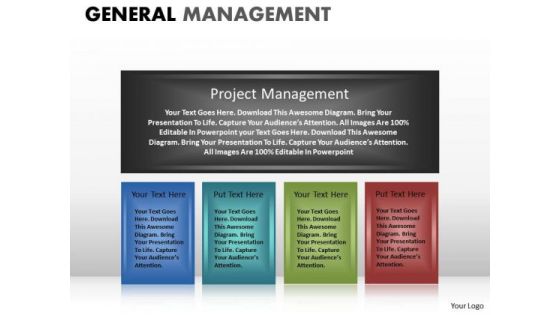
Text Place Holders Table Diagrams PowerPoint Templates Ppt Slides
Text_Place_Holders_Table_Diagrams_PowerPoint_templates_PPT_Slides-These high quality powerpoint pre-designed slides and powerpoint templates have been carefully created by our professional team to help you impress your audience. All slides have been created and are 100% editable in powerpoint. Each and every property of any graphic - color, size, orientation, shading, outline etc. can be modified to help you build an effective powerpoint presentation. Any text can be entered at any point in the powerpoint template or slide. Simply DOWNLOAD, TYPE and PRESENT! These PowerPoint presentation slides can be used to represent themes relating to --Arrow, alphabet, ball, blue, business, chart, concept, creative, crystal, circle, diagram, shape, round, shadow, reflection, glossy, glowing, shiny, icon, process, flow, link, connect, connection, style, relation, text, textbox-Text_Place_Holders_Table_Diagrams_PowerPoint_templates_PPT_Slides Serve your feast of ideas on our Text Place Holders Table Diagrams PowerPoint Templates Ppt Slides. The audience will find them delectable.
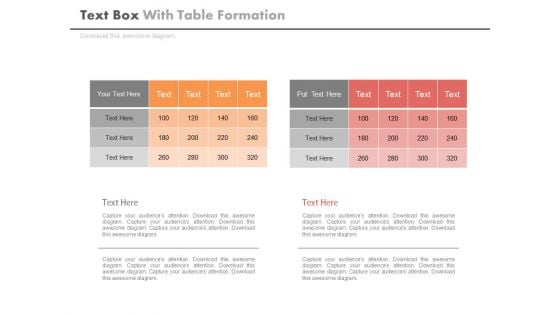
Two Table Charts For Business Data Powerpoint Slides
This PowerPoint template contains two tables chart. You may download this PPT slide to display statistical analysis. You can easily customize this template to make it more unique as per your need.
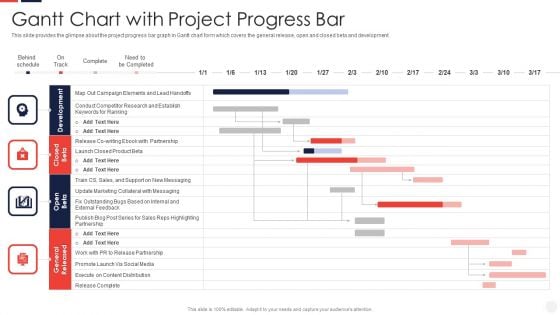
Escalation Administration System Gantt Chart With Project Progress Bar Download PDF
This slide provides the glimpse about the project progress bar graph in Gantt chart form which covers the general release, open and closed beta and development. Deliver an awe inspiring pitch with this creative escalation administration system gantt chart with project progress bar download pdf bundle. Topics like gantt chart with project progress bar can be discussed with this completely editable template. It is available for immediate download depending on the needs and requirements of the user.
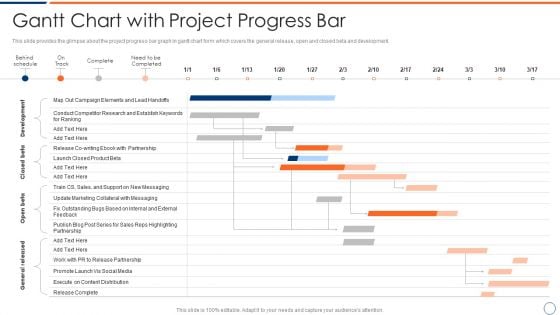
How To Intensify Project Threats Gantt Chart With Project Progress Bar Elements PDF
This slide provides the glimpse about the project progress bar graph in gantt chart form which covers the general release, open and closed beta and development. Deliver an awe inspiring pitch with this creative how to intensify project threats gantt chart with project progress bar elements pdf bundle. Topics like development, closed beta, open beta, general released. can be discussed with this completely editable template. It is available for immediate download depending on the needs and requirements of the user.
Incident And Issue Management Procedure Gantt Chart With Project Progress Bar Ppt Icon Influencers PDF
This slide provides the glimpse about the project progress bar graph in gantt chart form which covers the general release, open and closed beta and development. Deliver and pitch your topic in the best possible manner with this Incident And Issue Management Procedure Gantt Chart With Project Progress Bar Ppt Icon Influencers pdf. Use them to share invaluable insights on gantt chart with project progress bar and impress your audience. This template can be altered and modified as per your expectations. So, grab it now.
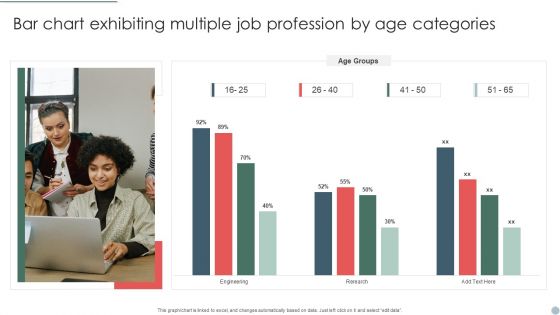
Bar Chart Exhibiting Multiple Job Profession By Age Categories Structure PDF
Showcasing this set of slides titled Bar Chart Exhibiting Multiple Job Profession By Age Categories Structure PDF. The topics addressed in these templates are Bar Chart Exhibiting, Multiple Job Profession, Age Categories. All the content presented in this PPT design is completely editable. Download it and make adjustments in color, background, font etc. as per your unique business setting.
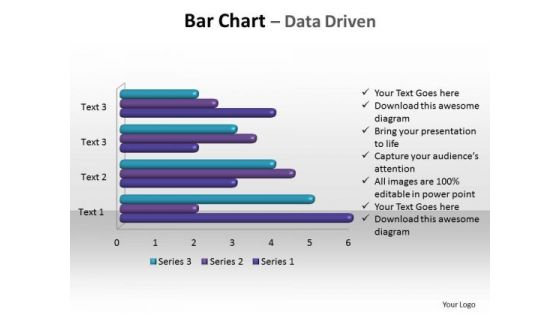
Business Sales PowerPoint Templates Business Bar Chart Data Driven Ppt Slides
Business Sales PowerPoint Templates Business bar chart data driven PPT Slides-This PowerPoint d Editable Data-Driven Chart is for visualizing your figures and data. Business Sales PowerPoint Templates Business bar chart data driven PPT Slides-This ppt can be used for concepts relating to-Chat, Illustration, data driven, figures, charts and Graphs. Set the audience alight with our Business Sales PowerPoint Templates Business Bar Chart Data Driven Ppt Slides. You will come up with a cracker of an idea.
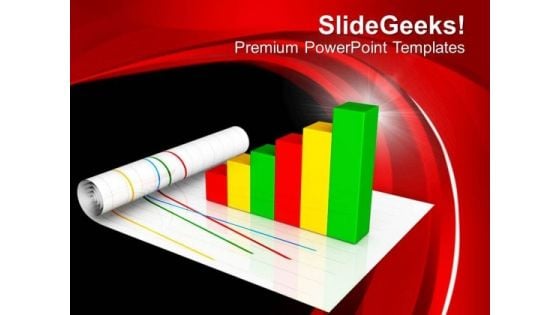
Bar Chart Positive Growth Finance PowerPoint Templates Ppt Backgrounds For Slides 0413
We present our Bar Chart Positive Growth Finance PowerPoint Templates PPT Backgrounds For Slides 0413.Use our Arrows PowerPoint Templates because Our PowerPoint Templates and Slides team portray an attitude of elegance. Personify this quality by using them regularly. Use our Success PowerPoint Templates because They will bring a lot to the table. Their alluring flavours will make your audience salivate. Download our Signs PowerPoint Templates because Our PowerPoint Templates and Slides will Embellish your thoughts. They will help you illustrate the brilliance of your ideas. Download our Shapes PowerPoint Templates because Our PowerPoint Templates and Slides are conceived by a dedicated team. Use them and give form to your wondrous ideas. Present our Finance PowerPoint Templates because You are an avid believer in ethical practices. Highlight the benefits that accrue with our PowerPoint Templates and Slides.Use these PowerPoint slides for presentations relating to Bar graph growth, arrows, success, signs, finance, shapes. The prominent colors used in the PowerPoint template are Green, Red, Yellow. Solidify your views with our Bar Chart Positive Growth Finance PowerPoint Templates Ppt Backgrounds For Slides 0413. Download without worries with our money back guaranteee.
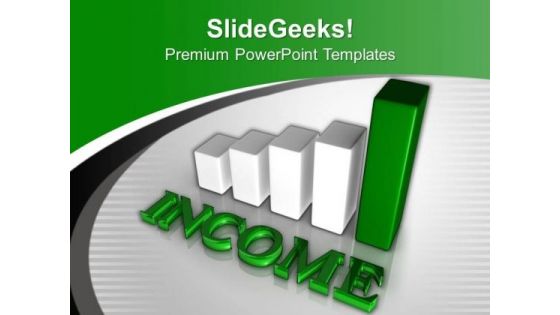
Business Growth And Income Bar Chart PowerPoint Templates Ppt Backgrounds For Slides 0413
We present our Business Growth And Income Bar Chart PowerPoint Templates PPT Backgrounds For Slides 0413.Use our Finance PowerPoint Templates because You are an avid believer in ethical practices. Highlight the benefits that accrue with our PowerPoint Templates and Slides. Use our Marketing PowerPoint Templates because Our PowerPoint Templates and Slides will give good value for money. They also have respect for the value of your time. Present our Success PowerPoint Templates because Our PowerPoint Templates and Slides team portray an attitude of elegance. Personify this quality by using them regularly. Download our Future PowerPoint Templates because They will bring a lot to the table. Their alluring flavours will make your audience salivate. Present our Business PowerPoint Templates because Our PowerPoint Templates and Slides are conceived by a dedicated team. Use them and give form to your wondrous ideas.Use these PowerPoint slides for presentations relating to Graph bars with word income, finance, future, business, success, marketing. The prominent colors used in the PowerPoint template are Green, White, Black. You will rarely find fault with our Business Growth And Income Bar Chart PowerPoint Templates Ppt Backgrounds For Slides 0413. They are designed by a fastidious team.
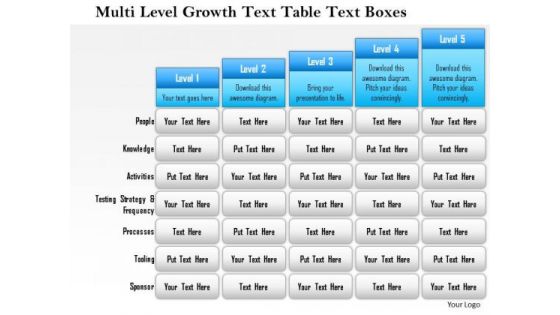
Business Framework Multi Level Growth Text Table Text Boxes 2 PowerPoint Presentation
Five staged text box style chart in bar graph design has been used to decorate this power point template slide. This diagram slide contains the multilevel growth concept. Use this PPT slide for financial growth and result analysis related topics.
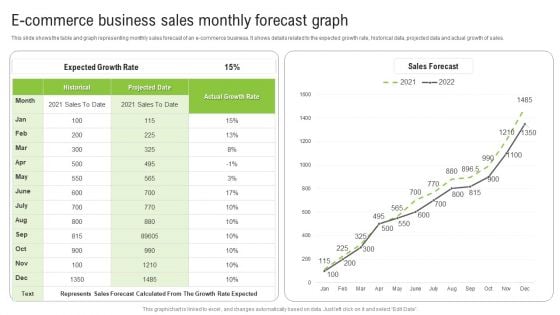
E Commerce Business Sales Monthly Forecast Graph Ppt Infographics Show PDF
This slide shows the table and graph representing monthly sales forecast of an e-commerce business. It shows details related to the expected growth rate, historical data, projected data and actual growth of sales. Pitch your topic with ease and precision using this E Commerce Business Sales Monthly Forecast Graph Ppt Infographics Show PDF. This layout presents information on Expected Growth Rate, Historical, Actual Growth Rate. It is also available for immediate download and adjustment. So, changes can be made in the color, design, graphics or any other component to create a unique layout.
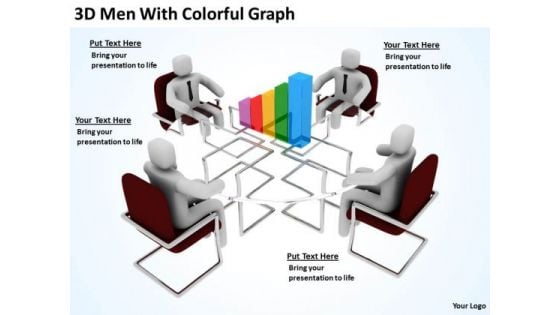
Business People Clip Art 3d Men With Colorful Graph PowerPoint Slides
We present our business people clip art 3d men with colorful graph PowerPoint Slides.Download and present our Business PowerPoint Templates because Our PowerPoint Templates and Slides will let Your superior ideas hit the target always and everytime. Present our Shapes PowerPoint Templates because Our PowerPoint Templates and Slides will fulfill your every need. Use them and effectively satisfy the desires of your audience. Download our Success PowerPoint Templates because Our PowerPoint Templates and Slides will generate and maintain the level of interest you desire. They will create the impression you want to imprint on your audience. Download our Future PowerPoint Templates because They will Put the wind in your sails. Skim smoothly over the choppy waters of the market. Download our Marketing PowerPoint Templates because Our PowerPoint Templates and Slides will let you Leave a lasting impression to your audiences. They possess an inherent longstanding recall factor.Use these PowerPoint slides for presentations relating to 3d, accounting, analysis, bar,business,cartoon, character, chart, clipart, clipart, committee, company, concept,conceptual, corporate, council, directors, display, document, economics, executive,figure, finance, financial, goal, gold, graph, group, growth, guy, human, humanoid,man, management, market, meeting, office, percentage, performance, presentation, report, statistics, table, team. The prominent colors used in the PowerPoint template are Maroon, White, Black. Professionals tell us our business people clip art 3d men with colorful graph PowerPoint Slides provide you with a vast range of viable options. Select the appropriate ones and just fill in your text. Professionals tell us our analysis PowerPoint templates and PPT Slides are specially created by a professional team with vast experience. They diligently strive to come up with the right vehicle for your brilliant Ideas. People tell us our business people clip art 3d men with colorful graph PowerPoint Slides will make you look like a winner. Customers tell us our character PowerPoint templates and PPT Slides will help you be quick off the draw. Just enter your specific text and see your points hit home. The feedback we get is that our business people clip art 3d men with colorful graph PowerPoint Slides are effectively colour coded to prioritise your plans They automatically highlight the sequence of events you desire. Use our bar PowerPoint templates and PPT Slides will help you be quick off the draw. Just enter your specific text and see your points hit home. Assist them in making the right choice. Open up all the cards with our Business People Clip Art 3d Men With Colorful Graph PowerPoint Slides.
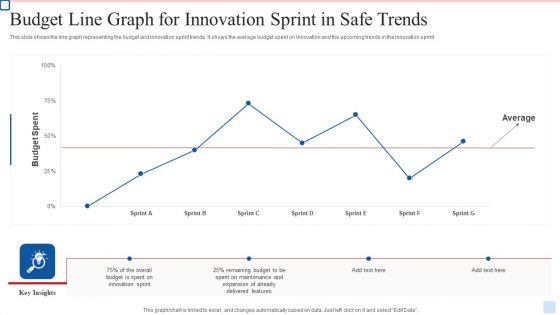
Budget Line Graph For Innovation Sprint In Safe Trends Diagrams PDF
This slide shows the line graph representing the budget and innovation sprint trends. It shows the average budget spent on innovation and the upcoming trends in the innovation sprint. Pitch your topic with ease and precision using this Budget Line Graph For Innovation Sprint In Safe Trends Diagrams PDF. This layout presents information on Budget Line Graph, For Innovation Sprint, In Safe Trends. It is also available for immediate download and adjustment. So, changes can be made in the color, design, graphics or any other component to create a unique layout.
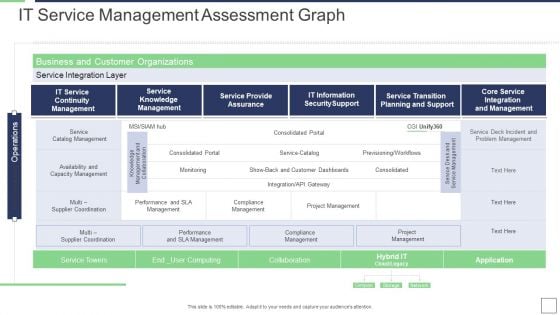
IT Service Incorporation And Administration IT Service Management Assessment Graph Background PDF
Deliver and pitch your topic in the best possible manner with this it service incorporation and administration it service management assessment graph background pdf. Use them to share invaluable insights on business, organizations, monitoring, collaboration, service towers and impress your audience. This template can be altered and modified as per your expectations. So, grab it now.
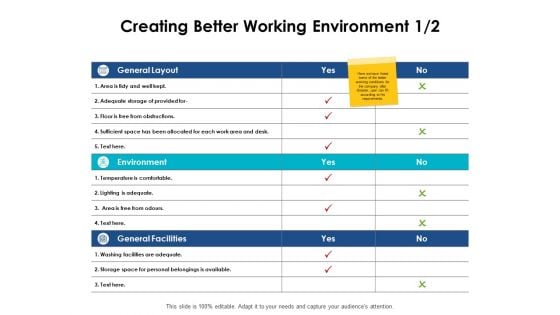
Creating Better Working Environment Storage Ppt PowerPoint Presentation Diagram Graph Charts
Presenting this set of slides with name creating better working environment storage ppt powerpoint presentation diagram graph charts. The topics discussed in these slides are strength, marketing, business, management, planning. This is a completely editable PowerPoint presentation and is available for immediate download. Download now and impress your audience.
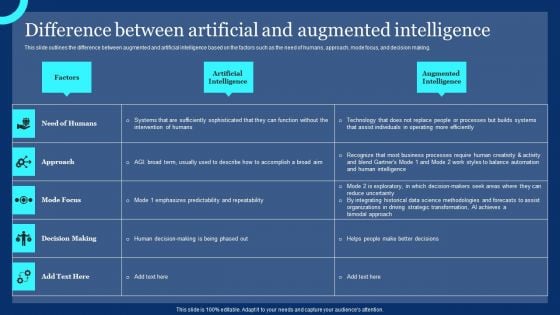
Difference Between Artificial And Augmented Intelligence Ppt PowerPoint Presentation Diagram Graph Charts PDF
This slide outlines the difference between augmented and artificial intelligence based on the factors such as the need of humans, approach, mode focus, and decision making. Here you can discover an assortment of the finest PowerPoint and Google Slides templates. With these templates, you can create presentations for a variety of purposes while simultaneously providing your audience with an eye catching visual experience. Download Difference Between Artificial And Augmented Intelligence Ppt PowerPoint Presentation Diagram Graph Charts PDF to deliver an impeccable presentation. These templates will make your job of preparing presentations much quicker, yet still, maintain a high level of quality. Slidegeeks has experienced researchers who prepare these templates and write high quality content for you. Later on, you can personalize the content by editing the Difference Between Artificial And Augmented Intelligence Ppt PowerPoint Presentation Diagram Graph Charts PDF.
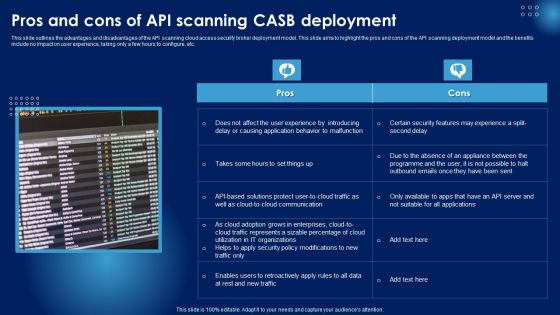
Pros And Cons Of API Scanning CASB Deployment Ppt PowerPoint Presentation Diagram Graph Charts PDF
This slide outlines the advantages and disadvantages of the API scanning cloud access security broker deployment model. This slide aims to highlight the pros and cons of the API scanning deployment model and the benefits include no impact on user experience, taking only a few hours to configure, etc. Whether you have daily or monthly meetings, a brilliant presentation is necessary. Pros And Cons Of API Scanning CASB Deployment Ppt PowerPoint Presentation Diagram Graph Charts PDF can be your best option for delivering a presentation. Represent everything in detail using Pros And Cons Of API Scanning CASB Deployment Ppt PowerPoint Presentation Diagram Graph Charts PDF and make yourself stand out in meetings. The template is versatile and follows a structure that will cater to your requirements. All the templates prepared by Slidegeeks are easy to download and edit. Our research experts have taken care of the corporate themes as well. So, give it a try and see the results.
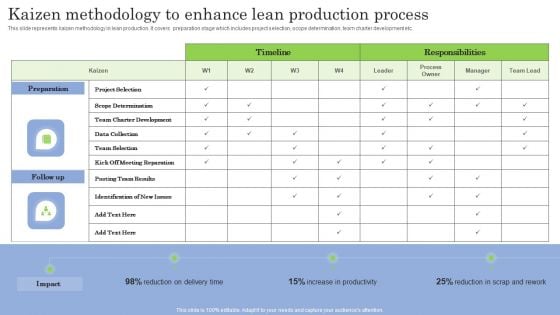
Kaizen Methodology To Enhance Lean Production Process Ppt PowerPoint Presentation Diagram Graph Charts PDF
This slide represents kaizen methodology in lean production. It covers preparation stage which includes project selection, scope determination, team charter development etc. Crafting an eye catching presentation has never been more straightforward. Let your presentation shine with this tasteful yet straightforward Kaizen Methodology To Enhance Lean Production Process Ppt PowerPoint Presentation Diagram Graph Charts PDF template. It offers a minimalistic and classy look that is great for making a statement. The colors have been employed intelligently to add a bit of playfulness while still remaining professional. Construct the ideal Kaizen Methodology To Enhance Lean Production Process Ppt PowerPoint Presentation Diagram Graph Charts PDF that effortlessly grabs the attention of your audience. Begin now and be certain to wow your customers.
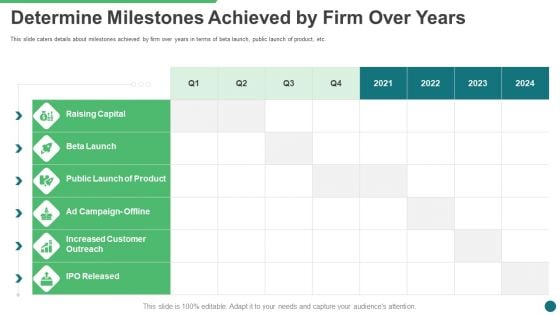
Determine Milestones Achieved By Firm Over Years Ppt Diagram Graph Charts PDF
This slide caters details about milestones achieved by firm over years in terms of beta launch, public launch of product, etc. Deliver an awe inspiring pitch with this creative determine milestones achieved by firm over years ppt diagram graph charts pdf bundle. Topics like determine milestones achieved by firm over years can be discussed with this completely editable template. It is available for immediate download depending on the needs and requirements of the user.
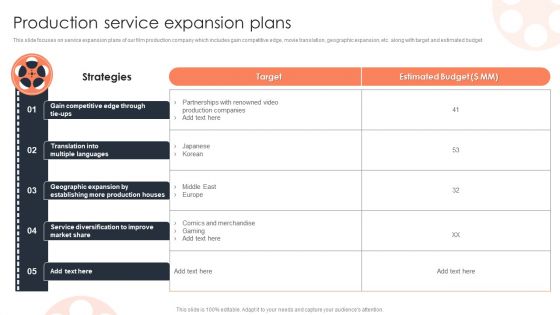
Production Service Expansion Plans Film Media Company Profile Ppt PowerPoint Presentation Diagram Graph Charts PDF
This slide focuses on service expansion plans of our film production company which includes gain competitive edge, movie translation, geographic expansion, etc. along with target and estimated budget.Deliver an awe inspiring pitch with this creative Production Service Expansion Plans Film Media Company Profile Ppt PowerPoint Presentation Diagram Graph Charts PDF bundle. Topics like Geographic Expansion, Establishing Production, Diversification Improve can be discussed with this completely editable template. It is available for immediate download depending on the needs and requirements of the user.
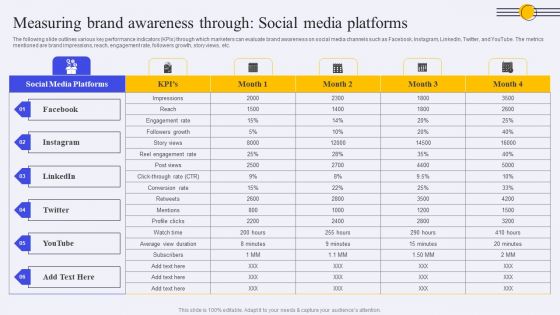
Measuring Brand Awareness Through Social Media Platforms Ppt PowerPoint Presentation Diagram Graph Charts PDF
The following slide outlines various key performance indicators KPIs through which marketers can evaluate brand awareness on social media channels such as Facebook, Instagram, LinkedIn, Twitter, and YouTube. The metrics mentioned are brand impressions, reach, engagement rate, followers growth, story views, etc. The best PPT templates are a great way to save time, energy, and resources. Slidegeeks have 100 percent editable powerpoint slides making them incredibly versatile. With these quality presentation templates, you can create a captivating and memorable presentation by combining visually appealing slides and effectively communicating your message. Download Measuring Brand Awareness Through Social Media Platforms Ppt PowerPoint Presentation Diagram Graph Charts PDF from Slidegeeks and deliver a wonderful presentation.
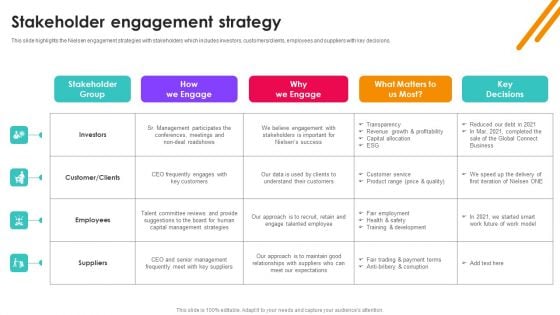
Nielsen Business Profile Stakeholder Engagement Strategy Ppt PowerPoint Presentation Diagram Graph Charts PDF
This slide highlights the Nielsen engagement strategies with stakeholders which includes investors, customers or clients, employees and suppliers with key decisions. The Nielsen Business Profile Stakeholder Engagement Strategy Ppt PowerPoint Presentation Diagram Graph Charts PDF is a compilation of the most recent design trends as a series of slides. It is suitable for any subject or industry presentation, containing attractive visuals and photo spots for businesses to clearly express their messages. This template contains a variety of slides for the user to input data, such as structures to contrast two elements, bullet points, and slides for written information. Slidegeeks is prepared to create an impression.
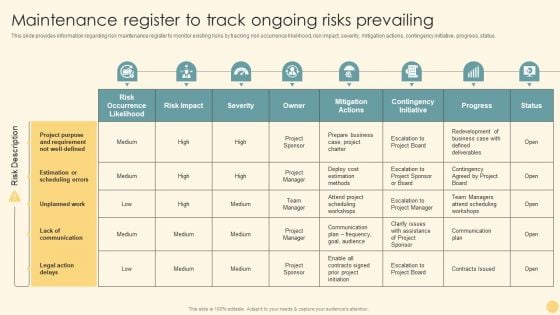
Maintenance Register To Track Ongoing Risks Prevailing Ppt PowerPoint Presentation Diagram Graph Charts PDF
This slide provides information regarding risk maintenance register to monitor existing risks by tracking risk occurrence likelihood, risk impact, severity, mitigation actions, contingency initiative, progress, status. Want to ace your presentation in front of a live audience Our Maintenance Register To Track Ongoing Risks Prevailing Ppt PowerPoint Presentation Diagram Graph Charts PDF can help you do that by engaging all the users towards you. Slidegeeks experts have put their efforts and expertise into creating these impeccable powerpoint presentations so that you can communicate your ideas clearly. Moreover, all the templates are customizable, and easy to edit and downloadable. Use these for both personal and commercial use.
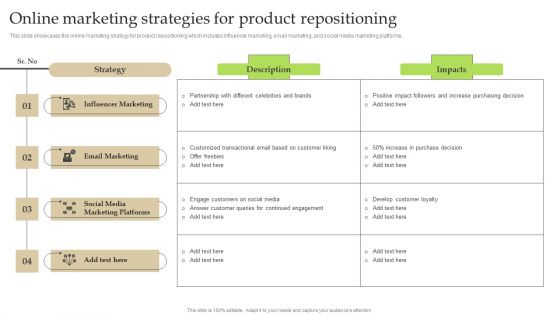
Online Marketing Strategies For Product Repositioning Ppt PowerPoint Presentation Diagram Graph Charts PDF
This slide showcases the online marketing strategy for product repositioning which includes influencer marketing, email marketing, and social media marketing platforms. Present like a pro with Online Marketing Strategies For Product Repositioning Ppt PowerPoint Presentation Diagram Graph Charts PDF Create beautiful presentations together with your team, using our easy-to-use presentation slides. Share your ideas in real-time and make changes on the fly by downloading our templates. So whether you are in the office, on the go, or in a remote location, you can stay in sync with your team and present your ideas with confidence. With Slidegeeks presentation got a whole lot easier. Grab these presentations today.
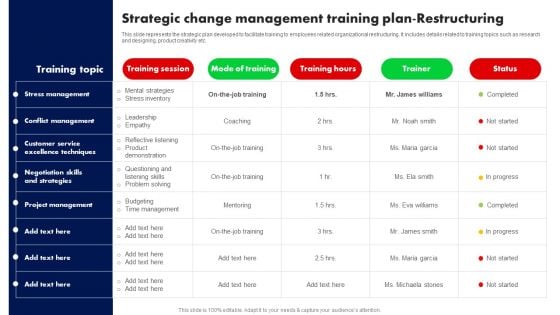
Strategic Change Management Training Plan Restructuring Ppt PowerPoint Presentation Diagram Graph Charts PDF
This slide represents the strategic plan developed to facilitate training to employees related organizational restructuring. It includes details related to training topics such as research and designing, product creativity etc. Take your projects to the next level with our ultimate collection of Strategic Change Management Training Plan Restructuring Ppt PowerPoint Presentation Diagram Graph Charts PDF. Slidegeeks has designed a range of layouts that are perfect for representing task or activity duration, keeping track of all your deadlines at a glance. Tailor these designs to your exact needs and give them a truly corporate look with your own brand colors they will make your projects stand out from the rest.
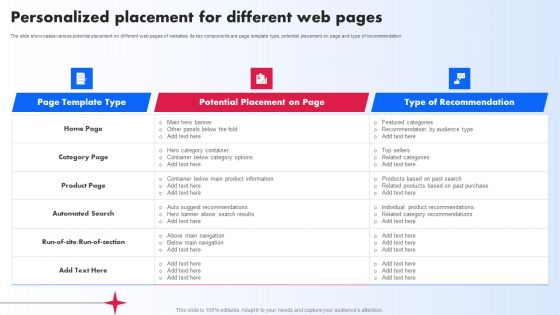
Personalized Placement For Different Web Pages Ppt PowerPoint Presentation Diagram Graph Charts PDF
The slide showcases various potential placement on different web pages of websites. Its key components are page template type, potential placement on page and type of recommendation. Do you know about Slidesgeeks Personalized Placement For Different Web Pages Ppt PowerPoint Presentation Diagram Graph Charts PDF. These are perfect for delivering any kind od presentation. Using it, create PowerPoint presentations that communicate your ideas and engage audiences. Save time and effort by using our pre designed presentation templates that are perfect for a wide range of topic. Our vast selection of designs covers a range of styles, from creative to business, and are all highly customizable and easy to edit. Download as a PowerPoint template or use them as Google Slides themes.

Platforms To Run Paid Search Engine Campaign Ppt PowerPoint Presentation Diagram Graph Charts PDF
This slide showcases various platforms that can be leveraged by marketers for running paid search engine campaigns. Three major platforms for paid search engine ads are - Google, Bing and Yahoo Welcome to our selection of the Platforms To Run Paid Search Engine Campaign Ppt PowerPoint Presentation Diagram Graph Charts PDF. These are designed to help you showcase your creativity and bring your sphere to life. Planning and Innovation are essential for any business that is just starting out. This collection contains the designs that you need for your everyday presentations. All of our PowerPoints are 100 percent editable, so you can customize them to suit your needs. This multi purpose template can be used in various situations. Grab these presentation templates today.
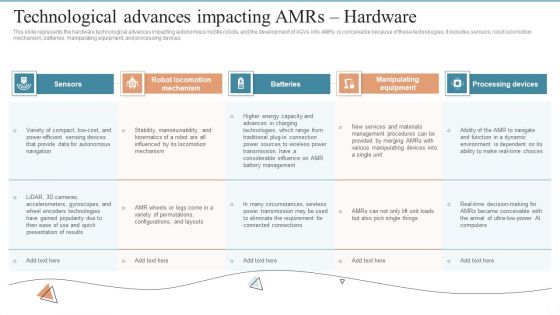
AMR Robot Technological Advances Impacting Amrs Hardware Ppt PowerPoint Presentation Diagram Graph Charts PDF
This slide represents the hardware technological advances impacting autonomous mobile robots, and the development of AGVs into AMRs is conceivable because of these technologies. It includes sensors, robot locomotion mechanism, batteries, manipulating equipment, and processing devices. Present like a pro with AMR Robot Technological Advances Impacting Amrs Hardware Ppt PowerPoint Presentation Diagram Graph Charts PDF Create beautiful presentations together with your team, using our easy to use presentation slides. Share your ideas in real time and make changes on the fly by downloading our templates. So whether you are in the office, on the go, or in a remote location, you can stay in sync with your team and present your ideas with confidence. With Slidegeeks presentation got a whole lot easier. Grab these presentations today.

Potential Segment Analysis For Amazon Customer Base Ppt PowerPoint Presentation Diagram Graph Charts PDF
This slide provides information regarding potential segments assessed across the customer base in terms of market size, recurring purchases, percent of online buyers, conversion rate, and purchasing power. Present like a pro with Potential Segment Analysis For Amazon Customer Base Ppt PowerPoint Presentation Diagram Graph Charts PDF Create beautiful presentations together with your team, using our easy to use presentation slides. Share your ideas in real time and make changes on the fly by downloading our templates. So whether you are in the office, on the go, or in a remote location, you can stay in sync with your team and present your ideas with confidence. With Slidegeeks presentation got a whole lot easier. Grab these presentations today.
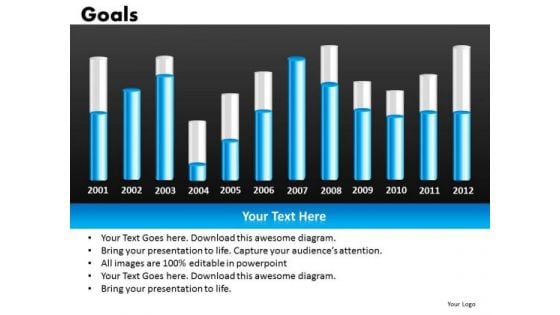
Goals Graphs PowerPoint Slides
Goals Graphs PowerPoint Slides-These high quality, editable pre-designed powerpoint slides have been carefully created by our professional team to help you impress your audience. Each graphic in every slide is vector based and is 100% editable in powerpoint. Each and every property of any slide - color, size, shading etc can be modified to build an effective powerpoint presentation. Use these slides to convey complex business concepts in a simplified manner. Any text can be entered at any point in the powerpoint slide. Simply DOWNLOAD, TYPE and PRESENT! Our Goals Graphs PowerPoint Slides give you a ready to use structure. You won't need to fabricate anything.
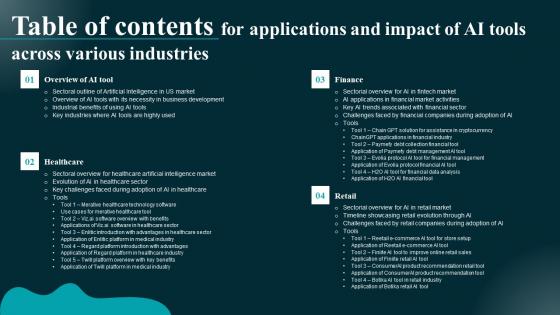
Table Of Contents For Applications And Impact Of AI Tools Across Various Themes Pdf
Slidegeeks is here to make your presentations a breeze with Table Of Contents For Applications And Impact Of AI Tools Across Various Themes Pdf With our easy-to-use and customizable templates, you can focus on delivering your ideas rather than worrying about formatting. With a variety of designs to choose from, you are sure to find one that suits your needs. And with animations and unique photos, illustrations, and fonts, you can make your presentation pop. So whether you are giving a sales pitch or presenting to the board, make sure to check out Slidegeeks first Our Table Of Contents For Applications And Impact Of AI Tools Across Various Themes Pdf are topically designed to provide an attractive backdrop to any subject. Use them to look like a presentation pro.
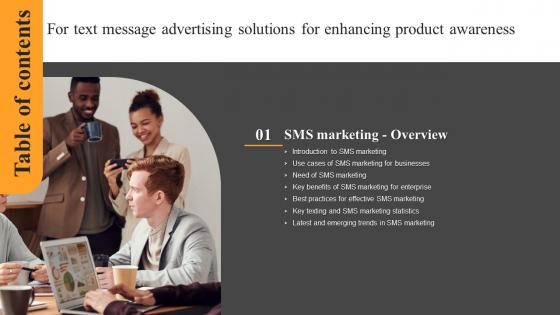
Text Message Advertising Solutions For Enhancing Table Of Contents Infographics Pdf
This slide represents the statistical data related to analyze which sectors use SMS marketing to engage and build loyal customers. It includes details related to usage of SMS marketing by industries such as real estate, agriculture, education etc. The best PPT templates are a great way to save time, energy, and resources. Slidegeeks have 100 percent editable powerpoint slides making them incredibly versatile. With these quality presentation templates, you can create a captivating and memorable presentation by combining visually appealing slides and effectively communicating your message. Download Text Message Advertising Solutions For Enhancing Table Of Contents Infographics Pdf from Slidegeeks and deliver a wonderful presentation. This slide represents the statistical data related to analyze which sectors use SMS marketing to engage and build loyal customers. It includes details related to usage of SMS marketing by industries such as real estate, agriculture, education etc.
Subordinate Debt Pitch Deck For Fund Raising Table Of Content Ppt Icon Grid PDF
Deliver an awe-inspiring pitch with this creative subordinate debt pitch deck for fund raising table of content ppt icon grid pdf bundle. Topics like major achievements company, key sources revenue generation, market potential and target customers, key opportunities market, key statistics company, financial graph historical and projection, revenue forecast subscribers can be discussed with this completely editable template. It is available for immediate download depending on the needs and requirements of the user.
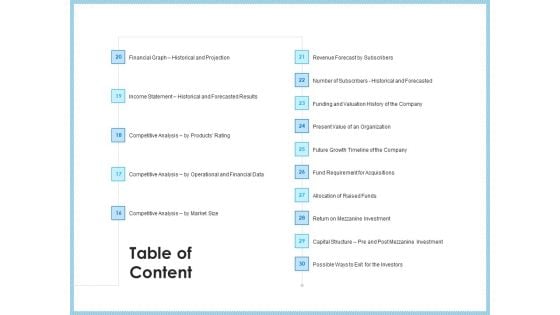
Investment Pitch To Generating Capital From Mezzanine Credit Table Of Content Market Mockup PDF
Deliver an awe-inspiring pitch with this creative investment pitch to generating capital from mezzanine credit table of content market mockup pdf bundle. Topics like financial graph historical and projection, income statement, historical and forecasted results, competitive analysis products rating, competitive analysis, market size can be discussed with this completely editable template. It is available for immediate download depending on the needs and requirements of the user.
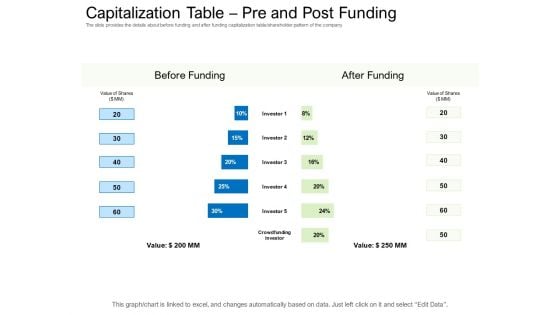
Collective Equity Funding Pitch Deck Capitalization Table Pre And Post Funding Background PDF
The slide provides the details about before funding and after funding capitalization table or shareholder pattern of the company. Deliver and pitch your topic in the best possible manner with this collective equity funding pitch deck capitalization table pre and post funding background pdf. Use them to share invaluable insights on before funding, after funding, investor, crowdfunding investor and impress your audience. This template can be altered and modified as per your expectations. So, grab it now.
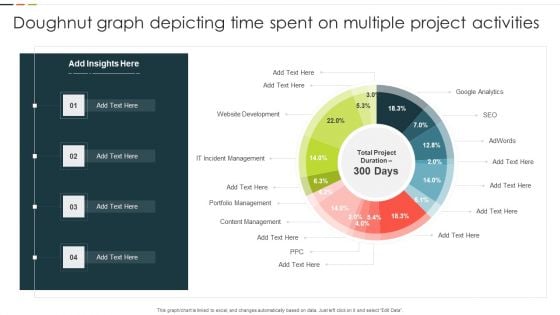
Doughnut Graph Depicting Time Spent On Multiple Project Activities Microsoft PDF
This graph or chart is linked to excel, and changes automatically based on data. Just left click on it and select Edit Data. Showcasing this set of slides titled Doughnut Graph Depicting Time Spent On Multiple Project Activities Microsoft PDF. The topics addressed in these templates are Website Development, IT Incident Management, Portfolio Management. All the content presented in this PPT design is completely editable. Download it and make adjustments in color, background, font etc. as per your unique business setting.
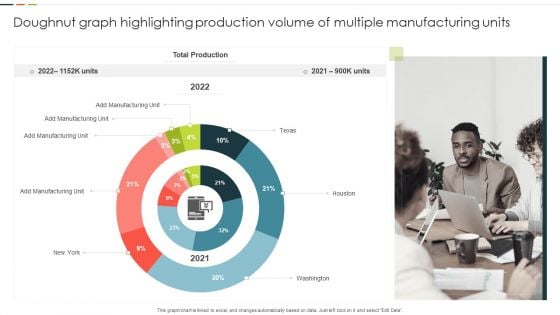
Doughnut Graph Highlighting Production Volume Of Multiple Manufacturing Units Guidelines PDF
This graph or chart is linked to excel, and changes automatically based on data. Just left click on it and select Edit Data. Showcasing this set of slides titled Doughnut Graph Highlighting Production Volume Of Multiple Manufacturing Units Guidelines PDF. The topics addressed in these templates are Total Production, Manufacturing Unit, Washington. All the content presented in this PPT design is completely editable. Download it and make adjustments in color, background, font etc. as per your unique business setting.
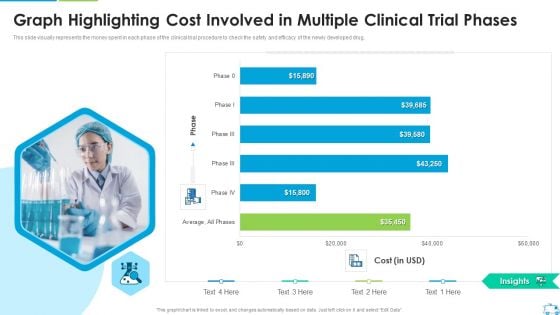
Graph Highlighting Cost Involved In Multiple Clinical Trial Phases Microsoft PDF
This slide visually represents the money spent in each phase of the clinical trial procedure to check the safety and efficacy of the newly developed drug.Deliver an awe inspiring pitch with this creative Graph Highlighting Cost Involved In Multiple Clinical Trial Phases Microsoft PDF bundle. Topics like Graph Highlighting Cost Involved In Multiple Clinical Trial Phases can be discussed with this completely editable template. It is available for immediate download depending on the needs and requirements of the user.
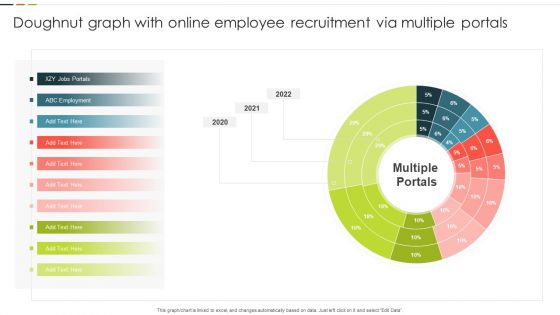
Doughnut Graph With Online Employee Recruitment Via Multiple Portals Mockup PDF
This graph or chart is linked to excel, and changes automatically based on data. Just left click on it and select Edit Data. Pitch your topic with ease and precision using this Doughnut Graph With Online Employee Recruitment Via Multiple Portals Mockup PDF. This layout presents information on ABC Employment, Multiple Portals, 2020 To 2022. It is also available for immediate download and adjustment. So, changes can be made in the color, design, graphics or any other component to create a unique layout.
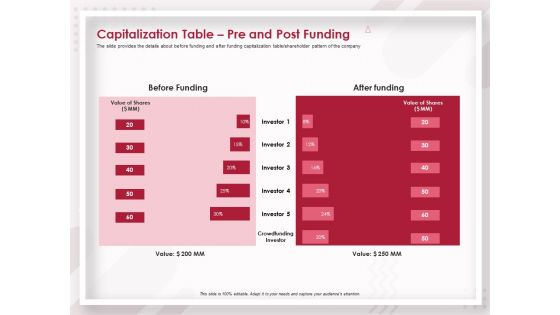
Startup Pitch To Raise Capital From Crowdfunding Capitalization Table Pre And Post Funding Sample PDF
Deliver and pitch your topic in the best possible manner with this startup pitch to raise capital from crowdfunding capitalization table pre and post funding sample pdf. Use them to share invaluable insights on before funding, after funding, investor, crowdfunding investor, value and impress your audience. This template can be altered and modified as per your expectations. So, grab it now.
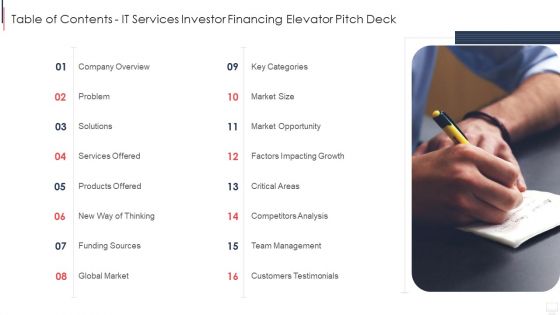
Table Of Contents IT Services Investor Financing Elevator Pitch Deck Brochure PDF
Deliver and pitch your topic in the best possible manner with this table of contents it services investor financing elevator pitch deck brochure pdf. Use them to share invaluable insights on company overview, services offered, products offered and impress your audience. This template can be altered and modified as per your expectations. So, grab it now.
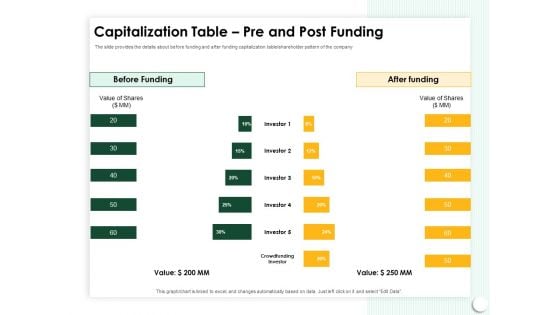
Startup Presentation For Collaborative Capital Funding Capitalization Table Pre And Post Funding Infographics PDF
Presenting this set of slides with name startup presentation for collaborative capital funding capitalization table pre and post funding infographics pdf. The topics discussed in these slides are before funding, after funding, value shares, investor. This is a completely editable PowerPoint presentation and is available for immediate download. Download now and impress your audience.
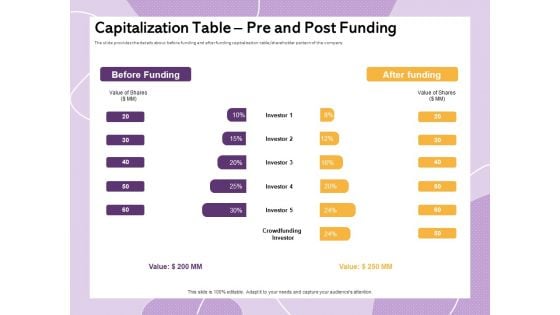
Investor Presentation For Society Funding Capitalization Table Pre And Post Funding Background PDF
Presenting this set of slides with name investor presentation for society funding capitalization table pre and post funding background pdf. The topics discussed in these slides are before funding, after funding, value shares, investor. This is a completely editable PowerPoint presentation and is available for immediate download. Download now and impress your audience.
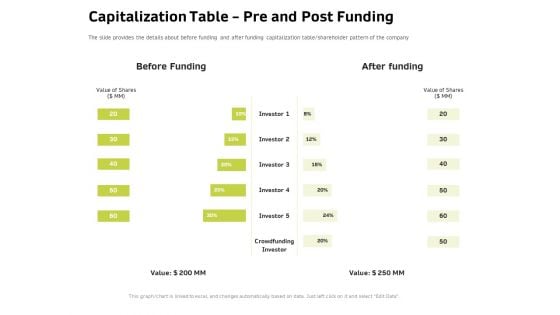
Customer Relationship Management In Freehold Property Capitalization Table Pre And Post Funding Infographics PDF
Presenting this set of slides with name customer relationship management in freehold property capitalization table pre and post funding infographics pdf. The topics discussed in these slides are before funding, after funding, value, crowdfunding investor. This is a completely editable PowerPoint presentation and is available for immediate download. Download now and impress your audience.
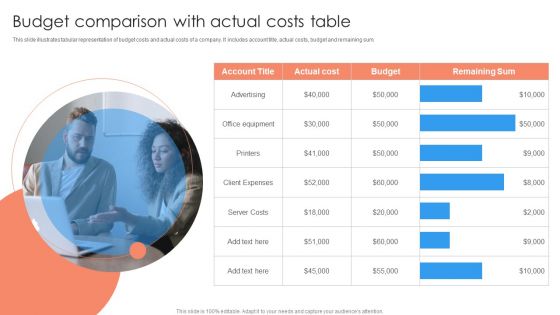
Budget Comparison With Actual Costs Table Ppt PowerPoint Presentation Infographic Template Graphics Pictures PDF
This slide illustrates tabular representation of budget costs and actual costs of a company. It includes account title, actual costs, budget and remaining sum.Showcasing this set of slides titled Budget Comparison With Actual Costs Table Ppt PowerPoint Presentation Infographic Template Graphics Pictures PDF. The topics addressed in these templates are Office Equipment, Client Expenses, Server Costs. All the content presented in this PPT design is completely editable. Download it and make adjustments in color, background, font etc. as per your unique business setting.
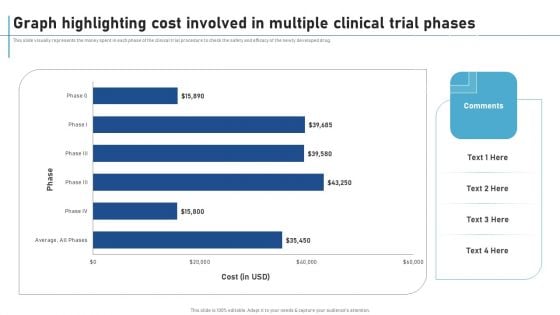
Graph Highlighting Cost Involved In Multiple Clinical Trial Phases New Clinical Drug Trial Process Mockup PDF
This slide visually represents the money spent in each phase of the clinical trial procedure to check the safety and efficacy of the newly developed drug. Find highly impressive Graph Highlighting Cost Involved In Multiple Clinical Trial Phases New Clinical Drug Trial Process Mockup PDF on Slidegeeks to deliver a meaningful presentation. You can save an ample amount of time using these presentation templates. No need to worry to prepare everything from scratch because Slidegeeks experts have already done a huge research and work for you. You need to download Graph Highlighting Cost Involved In Multiple Clinical Trial Phases New Clinical Drug Trial Process Mockup PDF for your upcoming presentation. All the presentation templates are 100 percent editable and you can change the color and personalize the content accordingly. Download now.

 Home
Home