Bar Graphics
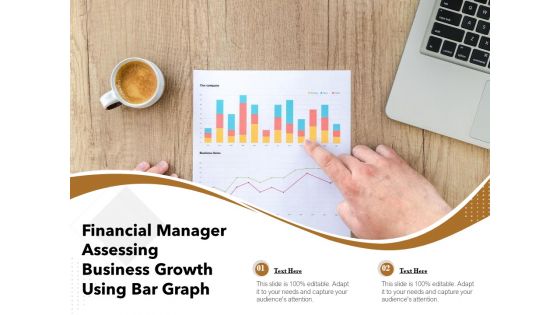
Financial Manager Assessing Business Growth Using Bar Graph Ppt PowerPoint Presentation Gallery Graphics PDF
Presenting financial manager assessing business growth using bar graph ppt powerpoint presentation gallery graphics pdf to dispense important information. This template comprises two stages. It also presents valuable insights into the topics including financial manager assessing business growth using bar graph. This is a completely customizable PowerPoint theme that can be put to use immediately. So, download it and address the topic impactfully.

Deliveroo Capital Fundraising Pitch Deck Companys Search Bar For Food Options Ppt Professional Graphics Example PDF
This slide shows the search bar that Deliveroo has for the food options that it offers to people. The search bar has a postal code section and some food options for the customer reference. Deliver an awe inspiring pitch with this creative deliveroo capital fundraising pitch deck companys search bar for food options ppt professional graphics example pdf bundle. Topics like companys search bar for food options can be discussed with this completely editable template. It is available for immediate download depending on the needs and requirements of the user.
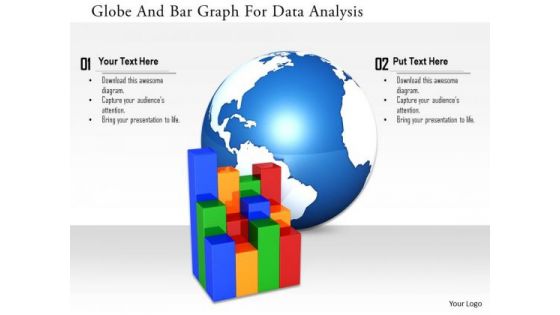
Stock Photo Globe And Bar Graph For Data Analysis Image Graphics For PowerPoint Slide
This image slide has been designed with business graph with globe in background. This image slide represents topics like global business, economic growth. This image will enhance the quality of your presentations.
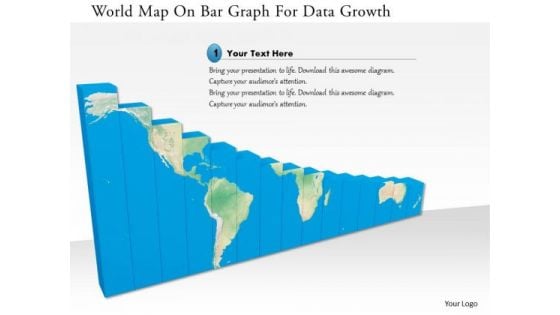
Stock Photo World Map On Bar Graph For Data Growth Image Graphics For PowerPoint Slide
This image is designed with blue graph with world map printed on it. This conceptual image portrays the concepts of global business and global economy. This image slide will help you express your views to target audience.
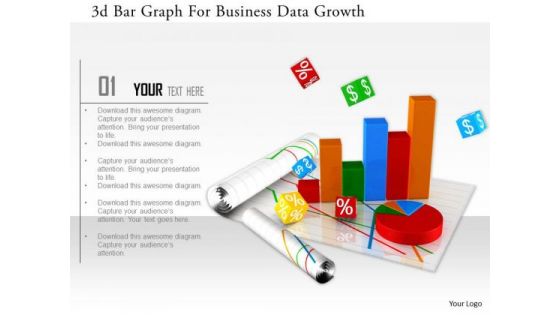
Stock Photo 3d Bar Graph For Business Data Growth Image Graphics For PowerPoint Slide
This image slide has graphics of financial charts and reports. This contains bar graph and pie chart to present business reports. Build an innovative presentations using this professional image slide.
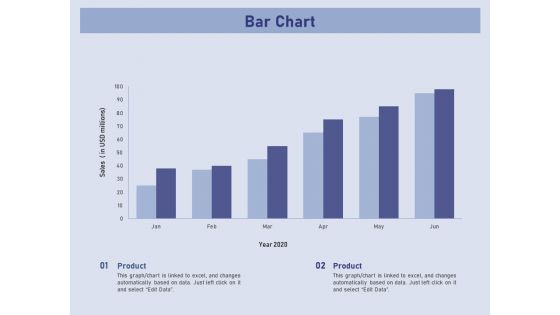
Business Contingency Planning Bar Chart Ppt PowerPoint Presentation Infographic Template Graphics Template PDF
Presenting this set of slides with name business contingency planning bar chart ppt powerpoint presentation infographic template graphics template pdf. The topics discussed in these slide is bar chart. This is a completely editable PowerPoint presentation and is available for immediate download. Download now and impress your audience.
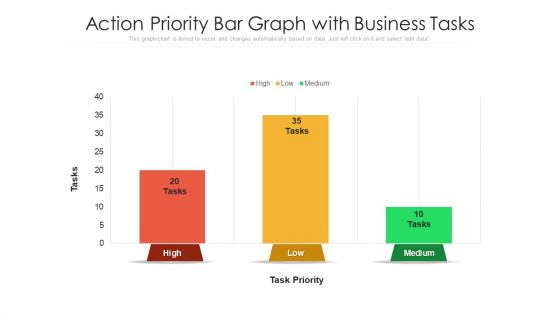
Action Priority Bar Graph With Business Tasks Ppt Layouts Graphics Download PDF
Showcasing this set of slides titled action priority bar graph with business tasks ppt layouts graphics download pdf. The topics addressed in these templates are action priority bar graph with business tasks. All the content presented in this PPT design is completely editable. Download it and make adjustments in color, background, font etc. as per your unique business setting.
Business Outcomes Vector Icons Showing Pie And Bar Graph Ppt Powerpoint Presentation File Graphic Images
This is a business outcomes vector icons showing pie and bar graph ppt powerpoint presentation file graphic images. This is a three stage process. The stages in this process are business outcomes, business results, business output.
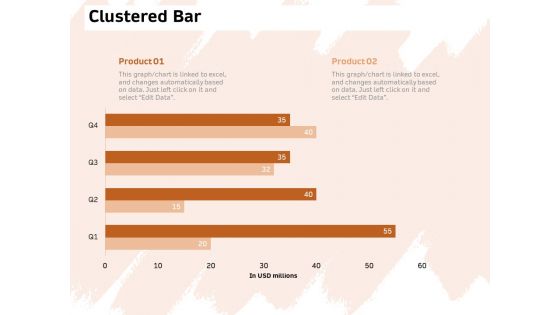
Investor Deck For Capital Generation From Substitute Funding Options Clustered Bar Ppt PowerPoint Presentation Outline Graphics Tutorials PDF
Presenting this set of slides with name investor deck for capital generation from substitute funding options clustered bar ppt powerpoint presentation outline graphics tutorials pdf. The topics discussed in these slide is clustered bar. This is a completely editable PowerPoint presentation and is available for immediate download. Download now and impress your audience.
Man With Bar Chart Vector Icon Ppt PowerPoint Presentation Inspiration Graphics PDF
Pitch your topic with ease and precision using this man with bar chart vector icon ppt powerpoint presentation inspiration graphics pdf. This layout presents information on man with bar chart vector icon. It is also available for immediate download and adjustment. So, changes can be made in the color, design, graphics or any other component to create a unique layout.
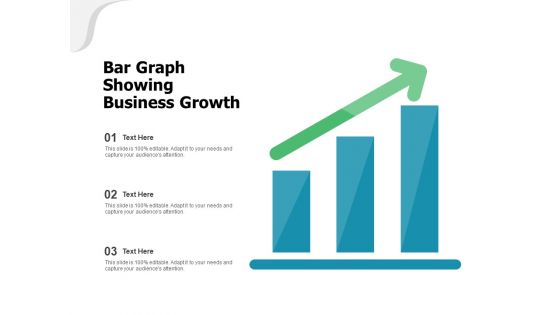
Bar Graph Showing Business Growth Ppt PowerPoint Presentation Styles Graphics Design PDF
Presenting bar graph showing business growth ppt powerpoint presentation styles graphics design pdf to dispense important information. This template comprises three stages. It also presents valuable insights into the topics including bar graph showing business growth. This is a completely customizable PowerPoint theme that can be put to use immediately. So, download it and address the topic impactfully.
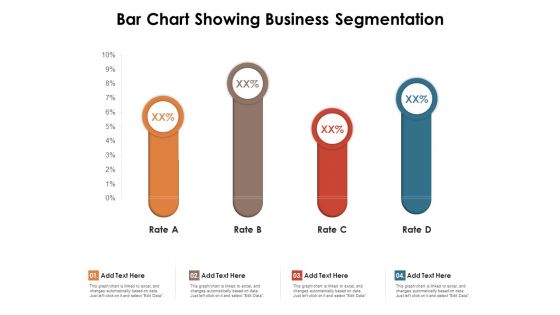
Bar Chart Showing Business Segmentation Ppt PowerPoint Presentation Inspiration Graphics Tutorials PDF
Presenting this set of slides with name bar chart showing business segmentation ppt powerpoint presentation inspiration graphics tutorials pdf. The topics discussed in these slide is bar chart showing business segmentation. This is a completely editable PowerPoint presentation and is available for immediate download. Download now and impress your audience.
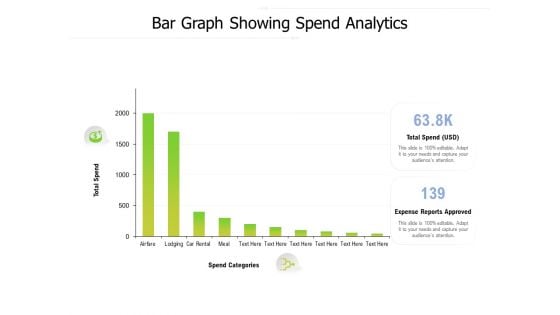
Bar Graph Showing Spend Analytics Ppt PowerPoint Presentation Infographics Graphics Pictures
Presenting this set of slides with name bar graph showing spend analytics ppt powerpoint presentation infographics graphics pictures. The topics discussed in these slide is total spend, expense reports approved, spend categories. This is a completely editable PowerPoint presentation and is available for immediate download. Download now and impress your audience.
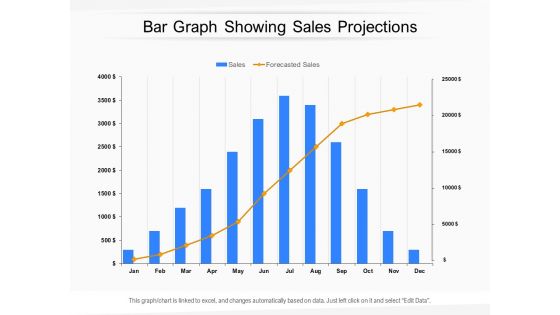
Bar Graph Showing Sales Projections Ppt PowerPoint Presentation Styles Graphics Download PDF
Presenting this set of slides with name bar graph showing sales projections ppt powerpoint presentation styles graphics download pdf. The topics discussed in these slides are Sales, Forecasted Sales. This is a completely editable PowerPoint presentation and is available for immediate download. Download now and impress your audience.
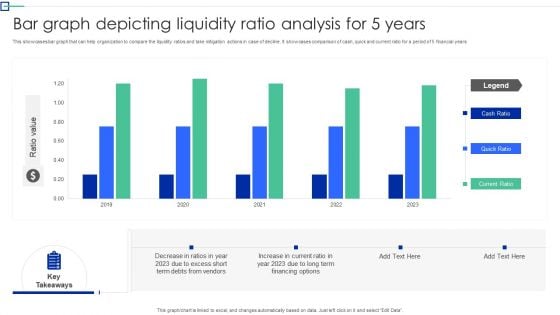
Bar Graph Depicting Liquidity Ratio Analysis For 5 Years Graphics PDF
This showcases bar graph that can help organization to compare the liquidity ratios and take mitigation actions in case of decline. It showcases comparison of cash, quick and current ratio for a period of 5 financial years. Showcasing this set of slides titled Bar Graph Depicting Liquidity Ratio Analysis For 5 Years Graphics PDF. The topics addressed in these templates are Organization To Compare, The Liquidity Ratios, Mitigation Action Decline. All the content presented in this PPT design is completely editable. Download it and make adjustments in color, background, font etc. as per your unique business setting.

Technology Bar Graph 2013 To 2020 PowerPoint Templates Ppt Slides Graphics
We present our Technology Bar Graph 2013 To 2020 PowerPoint Templates PPT Slides Graphics.Download and present our Marketing PowerPoint Templates because You can Be the star of the show with our PowerPoint Templates and Slides. Rock the stage with your ideas. Download our Timelines PowerPoint Templates because Our PowerPoint Templates and Slides will definately Enhance the stature of your presentation. Adorn the beauty of your thoughts with their colourful backgrounds. Use our Business PowerPoint Templates because You can Be the star of the show with our PowerPoint Templates and Slides. Rock the stage with your ideas. Download and present our Arrows PowerPoint Templates because Our PowerPoint Templates and Slides will provide you a launch platform. Give a lift off to your ideas and send them into orbit. Download and present our Time planning PowerPoint Templates because Our PowerPoint Templates and Slides help you meet the demand of the Market. Just browse and pick the slides that appeal to your intuitive senses.Use these PowerPoint slides for presentations relating to Art, Background, Button, Call, City, Colorful, Concept, Country, Destination, Editable, Flag, Fuel, Geography, Graphic, Home, Icon, Illustration, Journey, Land, Locate, Location, Macro, Map, Mapping, Mark, Navigate, Needle, Petrol, Pin, Pinpoint, Place, Pointing, Pump, Push, Pushpin, Restaurant, Road, Roadmap, Service, Set, Shiny, Space, Symbol, Town, Travel, Trip. The prominent colors used in the PowerPoint template are Green, Blue, Black. Have some fun with our Technology Bar Graph 2013 To 2020 PowerPoint Templates Ppt Slides Graphics. They make creating ideas enjoyable.
Business Trends Bar Chart Vector Icon Ppt PowerPoint Presentation Inspiration Graphic Images PDF
Persuade your audience using this business trends bar chart vector icon ppt powerpoint presentation inspiration graphic images pdf. This PPT design covers three stages, thus making it a great tool to use. It also caters to a variety of topics including business trends bar chart vector icon. Download this PPT design now to present a convincing pitch that not only emphasizes the topic but also showcases your presentation skills.
Graphical Representation Of Data With Bar Graph Ppt PowerPoint Presentation Outline Format PDF
Presenting graphical representation of data with bar graph ppt powerpoint presentation outline format pdf to dispense important information. This template comprises three stages. It also presents valuable insights into the topics including graphical representation of data with bar graph. This is a completely customizable PowerPoint theme that can be put to use immediately. So, download it and address the topic impactfully.
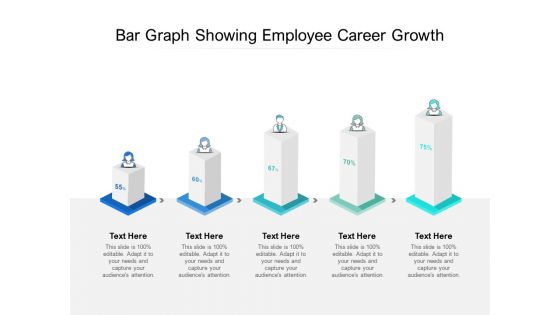
Bar Graph Showing Employee Career Growth Ppt PowerPoint Presentation Show Graphics Tutorials
Presenting this set of slides with name bar graph showing employee career growth ppt powerpoint presentation show graphics tutorials. This is a five stage process. The stages in this process are bar graph showing employee career growth. This is a completely editable PowerPoint presentation and is available for immediate download. Download now and impress your audience.
Bar Chart Showing Positive Financial Growth Ppt PowerPoint Presentation Model Graphics PDF
Presenting bar chart showing positive financial growth ppt powerpoint presentation model graphics pdf to dispense important information. This template comprises three stages. It also presents valuable insights into the topics including bar chart showing positive financial growth. This is a completely customizable PowerPoint theme that can be put to use immediately. So, download it and address the topic impactfully.
Bar Graph For Business Data Analysis Ppt PowerPoint Presentation File Graphics Template PDF
Presenting this set of slides with name bar graph for business data analysis ppt powerpoint presentation file graphics template pdf. The topics discussed in these slide is bar graph for business data analysis. This is a completely editable PowerPoint presentation and is available for immediate download. Download now and impress your audience.
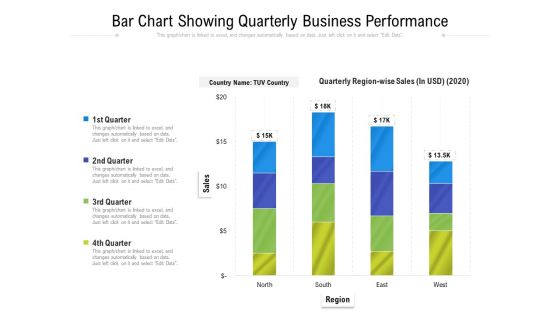
Bar Chart Showing Quarterly Business Performance Ppt PowerPoint Presentation Infographics Graphics PDF
Presenting this set of slides with name bar chart showing quarterly business performance ppt powerpoint presentation infographics graphics pdf. The topics discussed in these slides are country name tuv country, quarterly region wise sales, 2020, region. This is a completely editable PowerPoint presentation and is available for immediate download. Download now and impress your audience.
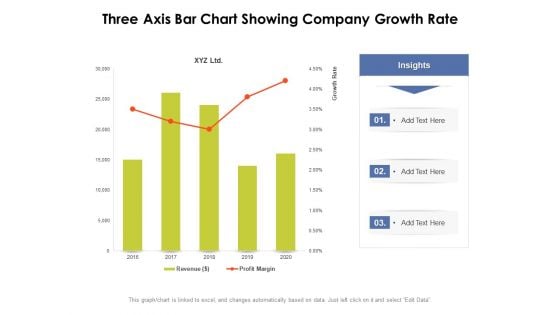
Three Axis Bar Chart Showing Company Growth Rate Ppt PowerPoint Presentation Summary Graphics Pictures PDF
Presenting this set of slides with name three axis bar chart showing company growth rate ppt powerpoint presentation summary graphics pictures pdf. The topics discussed in these slides are insights, growth rate, revenue, profit margin, 2016 to 2020. This is a completely editable PowerPoint presentation and is available for immediate download. Download now and impress your audience.

Bar Graph Showing Revenues Generated By Sales Department Ppt Portfolio Graphics Example PDF
This graph or chart is linked to excel, and changes automatically based on data. Just left click on it and select edit data. Showcasing this set of slides titled bar graph showing revenues generated by sales department ppt portfolio graphics example pdf. The topics addressed in these templates are yearly sales revenues, sales team, profits. All the content presented in this PPT design is completely editable. Download it and make adjustments in color, background, font etc. as per your unique business setting.
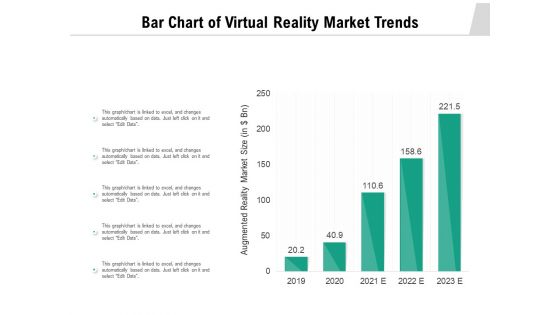
Bar Chart Of Virtual Reality Market Trends Ppt PowerPoint Presentation Styles Graphics PDF
Showcasing this set of slides titled bar chart of virtual reality market trends ppt powerpoint presentation styles graphics pdf. The topics addressed in these templates are bar chart of virtual reality market trends. All the content presented in this PPT design is completely editable. Download it and make adjustments in colour, background, font etc. as per your unique business setting.
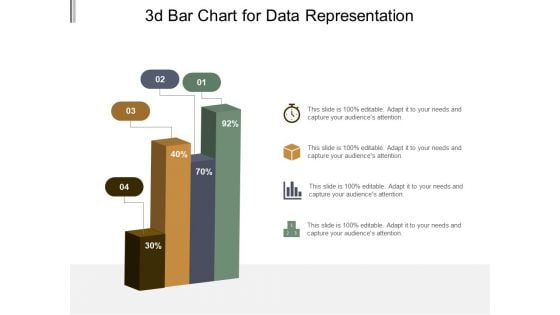
3D Bar Chart For Data Representation Ppt PowerPoint Presentation Model Graphic Tips
This is a 3d bar chart for data representation ppt powerpoint presentation model graphic tips. This is a four stage process. The stages in this process are art, colouring, paint brush.
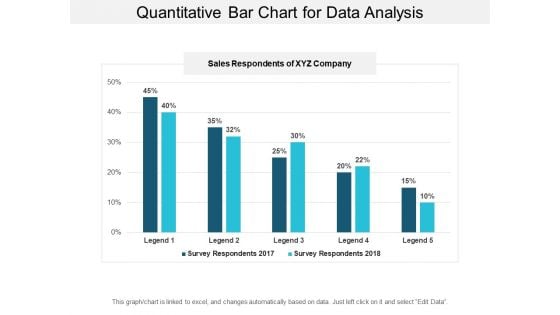
Quantitative Bar Chart For Data Analysis Ppt PowerPoint Presentation Model Graphic Tips
This is a quantitative bar chart for data analysis ppt powerpoint presentation model graphic tips. This is a two stage process. The stages in this process are financial analysis, quantitative, statistical modelling.
Bar Graph And Magnifying Glass Assessment Icon Ppt PowerPoint Presentation Portfolio Graphics Pictures PDF
Presenting bar graph and magnifying glass assessment icon ppt powerpoint presentation portfolio graphics pictures pdf to dispense important information. This template comprises four stages. It also presents valuable insights into the topics including bar graph and magnifying glass assessment icon. This is a completely customizable PowerPoint theme that can be put to use immediately. So, download it and address the topic impactfully.
Bar Graph With Star For Business Achievements Ppt Powerpoint Presentation Icon Graphics Template
This is a bar graph with star for business achievements ppt powerpoint presentation icon graphics template. The topics discussed in this diagram are annual goal, yearly goal, annual target. This is a completely editable PowerPoint presentation, and is available for immediate download.
Bar Graph With Growth Arrow Vector Icon Ppt PowerPoint Presentation Outline Graphics
Presenting this set of slides with name bar graph with growth arrow vector icon ppt powerpoint presentation outline graphics. This is a one stage process. The stages in this process are Multi Level Growth Table, Process, Planning. This is a completely editable PowerPoint presentation and is available for immediate download. Download now and impress your audience.
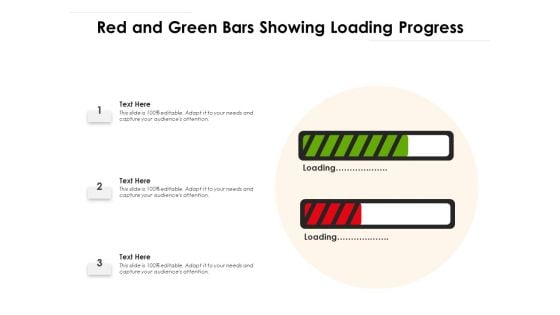
Red And Green Bars Showing Loading Progress Ppt PowerPoint Presentation Gallery Graphics Design PDF
Presenting this set of slides with name red and green bars showing loading progress ppt powerpoint presentation gallery graphics design pdf. This is a three stage process. The stages in this process are red and green bars showing loading progress. This is a completely editable PowerPoint presentation and is available for immediate download. Download now and impress your audience.
Four Bars Alignment Vector Icon Ppt PowerPoint Presentation Infographics Graphics Pictures
This is a four bars alignment vector icon ppt powerpoint presentation infographics graphics pictures. The topics discussed in this diagram are alignment icon, arrangement icon, put in order icon This is a completely editable PowerPoint presentation, and is available for immediate download.
Bar Code Scan For Bill Payment Ppt PowerPoint Presentation Gallery Graphic Tips PDF
Showcasing this set of slides titled bar code scan for bill payment ppt powerpoint presentation gallery graphic tips pdf. The topics addressed in these templates are bar code scan for bill payment. All the content presented in this PPT design is completely editable. Download it and make ajustments in color, background, font etc. as per your unique business setting.
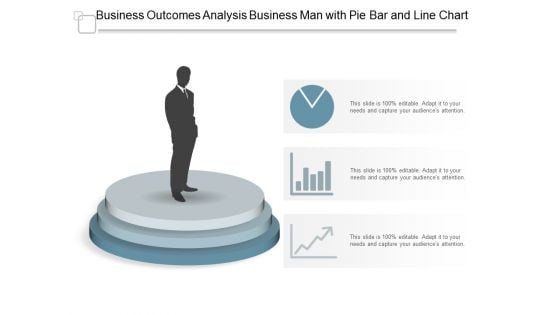
Business Outcomes Analysis Business Man With Pie Bar And Line Chart Ppt PowerPoint Presentation Professional Graphics Download
Presenting this set of slides with name business outcomes analysis business man with pie bar and line chart ppt powerpoint presentation professional graphics download. This is a three stage process. The stages in this process are business outcomes, business results, business output. This is a completely editable PowerPoint presentation and is available for immediate download. Download now and impress your audience.
Sales Steps Process With Gear And Bar Chart Vector Icon Ppt PowerPoint Presentation Infographics Graphics Design PDF
Presenting sales steps process with gear and bar chart vector icon ppt powerpoint presentation infographics graphics design pdf to dispense important information. This template comprises three stages. It also presents valuable insights into the topics including sales steps process with gear and bar chart vector icon. This is a completely customizable PowerPoint theme that can be put to use immediately. So, download it and address the topic impactfully.
Eight Percentage Bars With Business Icons Ppt PowerPoint Presentation Icon Graphic Tips
Presenting this set of slides with name eight percentage bars with business icons ppt powerpoint presentation icon graphic tips. This is a eight stage process. The stages in this process are eight percentage bars with business icons. This is a completely editable PowerPoint presentation and is available for immediate download. Download now and impress your audience.
Gender Salary Gap Icon With Bar Chart And Dollar Symbol Ppt PowerPoint Presentation Model Graphic Tips PDF
Presenting gender salary gap icon with bar chart and dollar symbol ppt powerpoint presentation model graphic tips pdf to dispense important information. This template comprises three stages. It also presents valuable insights into the topics including gender salary gap icon with bar chart and dollar symbol. This is a completely customizable PowerPoint theme that can be put to use immediately. So, download it and address the topic impactfully.

Salad Bar Brochure Trifold
Tired of boring and uninspiring presentations Our Salad Bar Brochure Trifold is here to save the day. Our team of experts has created a visually stunning and easy-to-use template that will impress your audience. You can easily edit and customize the template to fit your needs and preferences. So, why settle for mediocre presentations when you can make them exceptional with our template.

Bar Graph For Business Growth Powerpoint Templates
This PowerPoint slide contains graphics bar chart. This slide helps to exhibit business growth analysis. Sparkling thoughts are swirling around in your head. Filter them through with this diagram slide.
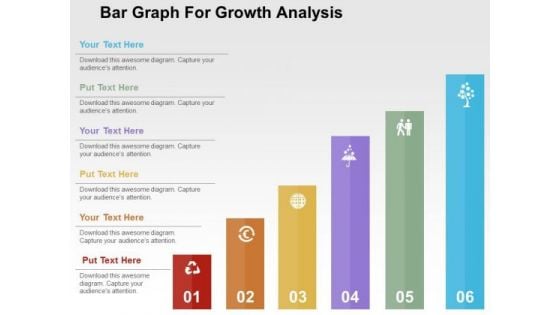
Bar Graph For Growth Analysis PowerPoint Template
This slide contains graphics bar chart. This slide helps to exhibit business growth analysis. Sparkling thoughts are swirling around in your head. Filter them through with this diagram slide.
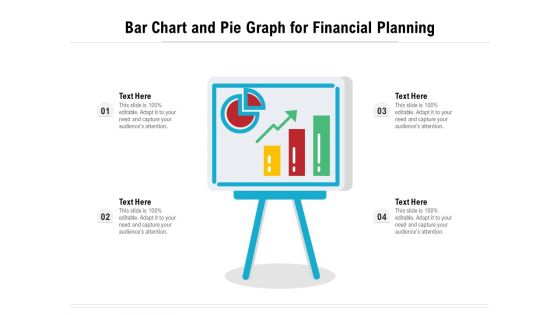
Bar Chart And Pie Graph For Financial Planning Ppt PowerPoint Presentation Infographics Graphics Example PDF
Presenting bar chart and pie graph for financial planning ppt powerpoint presentation infographics graphics example pdf. to dispense important information. This template comprises four stages. It also presents valuable insights into the topics including bar chart and pie graph for financial planning. This is a completely customizable PowerPoint theme that can be put to use immediately. So, download it and address the topic impactfully.
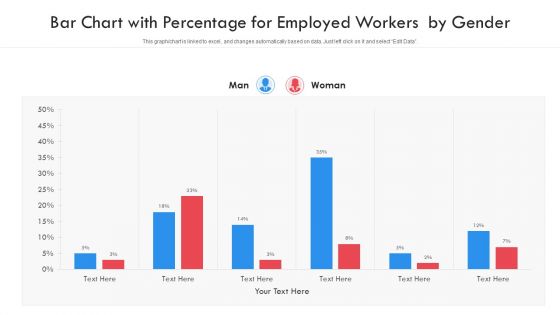
Bar Chart With Percentage For Employed Workers By Gender Ppt PowerPoint Presentation File Graphics Design PDF
Showcasing this set of slides titled bar chart with percentage for employed workers by gender ppt powerpoint presentation file graphics design pdf. The topics addressed in these templates are bar chart with percentage for employed workers by gender. All the content presented in this PPT design is completely editable. Download it and make adjustments in color, background, font etc. as per your unique business setting.
Bar Graph With Downward Arrow For Business Failure Ppt PowerPoint Presentation Inspiration Graphics
This is a bar graph with downward arrow for business failure ppt powerpoint presentation inspiration graphics. This is a four stage process. The stages in this process are business failure, unsuccessful business, business non success.
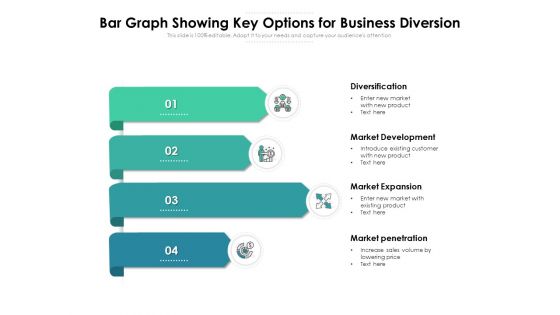
Bar Graph Showing Key Options For Business Diversion Ppt PowerPoint Presentation Professional Graphics PDF
Presenting this set of slides with name bar graph showing key options for business diversion ppt powerpoint presentation professional graphics pdf. This is a four stage process. The stages in this process are diversification, market development, market expansion, market penetration, enter new market with new product. This is a completely editable PowerPoint presentation and is available for immediate download. Download now and impress your audience.
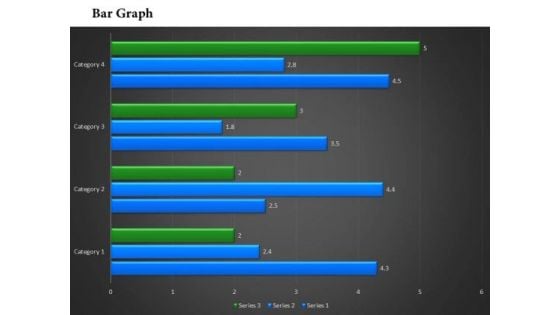
Business Framework Bar Chart In PowerPoint Presentation
This power point diagram slide has been designed with graphic of bar chart. In this diagram slide we have used green and blue colored vertical bar graph. Display result analysis with this bar graph diagram and use it in your result verification and analysis related presentations.
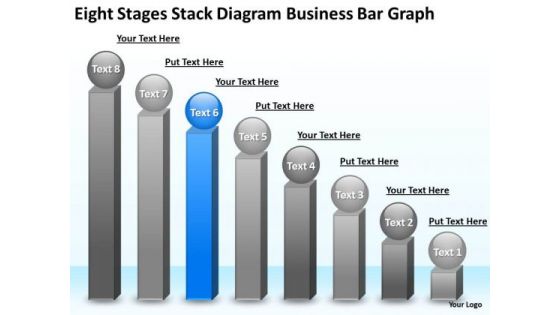
Business PowerPoint Presentations Bar Graph Plan Slides
We present our business powerpoint presentations bar graph plan Slides.Present our Business PowerPoint Templates because It will Raise the bar of your Thoughts. They are programmed to take you to the next level. Download our Spheres PowerPoint Templates because You can Channelise the thoughts of your team with our PowerPoint Templates and Slides. Urge them to focus on the goals you have set. Download our Competition PowerPoint Templates because Our PowerPoint Templates and Slides will let you Leave a lasting impression to your audiences. They possess an inherent longstanding recall factor. Present our Shapes PowerPoint Templates because It will get your audience in sync. Use our Success PowerPoint Templates because Our PowerPoint Templates and Slides will let you Leave a lasting impression to your audiences. They possess an inherent longstanding recall factor.Use these PowerPoint slides for presentations relating to bar, graph, statistics, economy, render, success, representation, diagram, graphic, achievment, obstruction, chevron, accounting, finances, energy eco, steps, figure, tall, barrier, strategy, ladder, up, planning, high, climb, stripes, growth, maintenance, profit, successful, repair, return, gradient, sustainability, financial, construction, upwards, increasing. The prominent colors used in the PowerPoint template are Blue, Gray, White. Get fab and cool with our Business PowerPoint Presentations Bar Graph Plan Slides. Be the trendsetter with your thoughts.
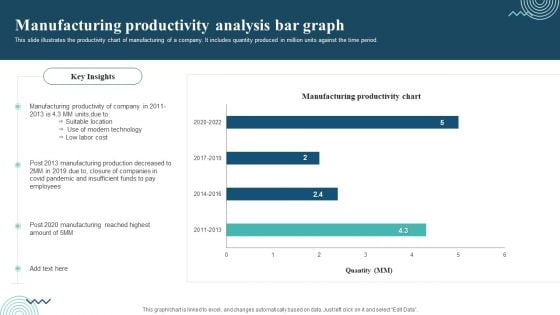
Manufacturing Productivity Analysis Bar Graph Introduction PDF
This slide illustrates the productivity chart of manufacturing of a company. It includes quantity produced in million units against the time period. Pitch your topic with ease and precision using this Manufacturing Productivity Analysis Bar Graph Introduction PDF. This layout presents information on Manufacturing Productivity, Production Decreased, Closure Of Companies. It is also available for immediate download and adjustment. So, changes can be made in the color, design, graphics or any other component to create a unique layout.
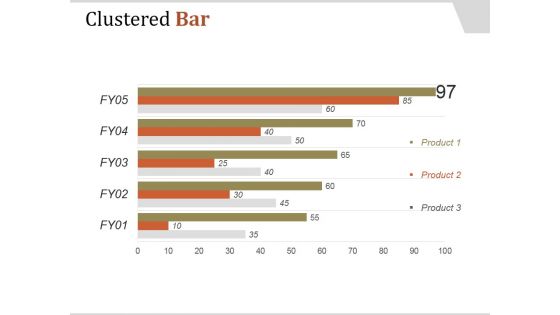
Clustered Bar Ppt PowerPoint Presentation Template
This is a clustered bar ppt powerpoint presentation template. This is a five stage process. The stages in this process are product, clustered bar, business, marketing, bar graph.
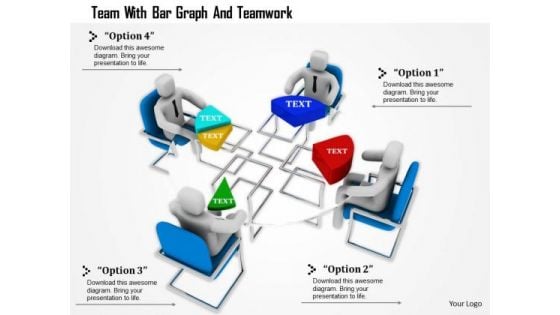
Team With Bar Graph And Teamwork
This Power Point template has been designed with graphic of 3d team forming a pie chart. In this slide team is displaying data analysis and comparison. Use this editable slide to build innovative presentation for your viewers.
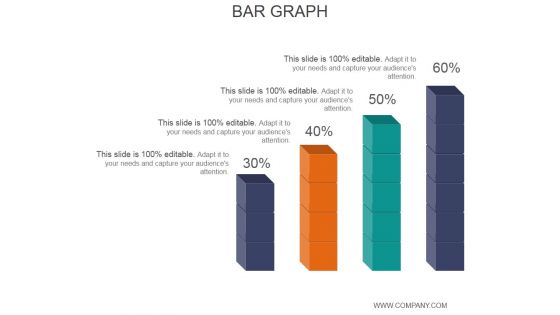
Bar Graph Ppt PowerPoint Presentation Background Image
This is a bar graph ppt powerpoint presentation background image. This is a four stage process. The stages in this process are bar graph, growth, business, marketing, strategy.
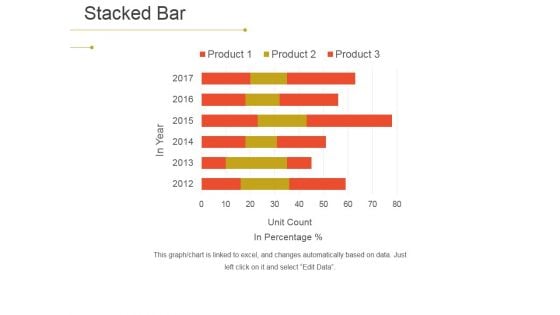
Stacked Bar Ppt PowerPoint Presentation Model Images
This is a stacked bar ppt powerpoint presentation model images. This is a six stage process. The stages in this process are bar chart, planning, business, strategic, management.
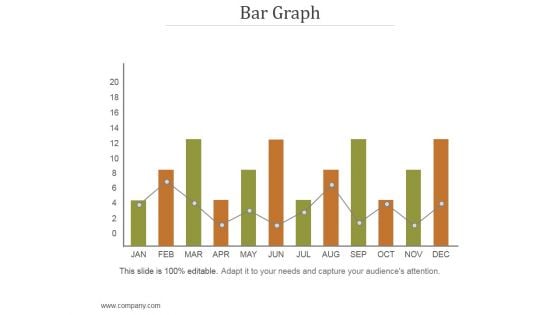
Bar Graph Ppt PowerPoint Presentation Background Images
This is a bar graph ppt powerpoint presentation background images. This is a twelve stage process. The stages in this process are bar graph, months, finance, growth, success.
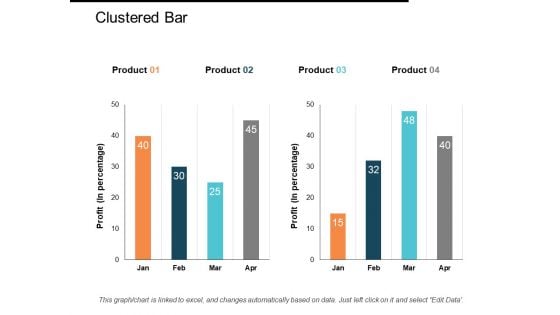
Clustered Bar Ppt PowerPoint Presentation Gallery Inspiration
This is a clustered bar ppt powerpoint presentation gallery inspiration. This is a four stage process. The stages in this process are clustered bar, product, profit, business, bar graph.
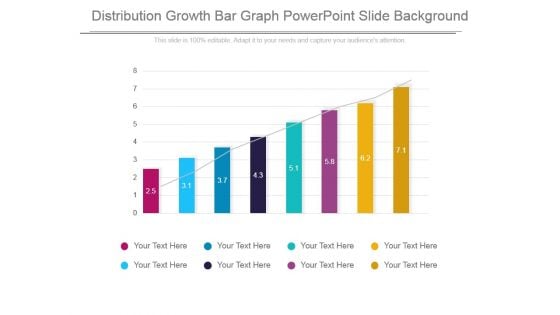
Distribution Growth Bar Graph Powerpoint Slide Background
This is a distribution growth bar graph powerpoint slide background. This is a eight stage process. The stages in this process are growth, bar graph, business, marketing, success.
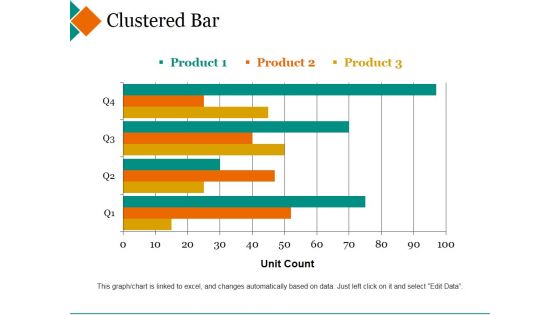
Clustered Bar Ppt PowerPoint Presentation Inspiration Templates
This is a clustered bar ppt powerpoint presentation inspiration templates. This is a four stage process. The stages in this process are product, unit count, clustered bar, step.
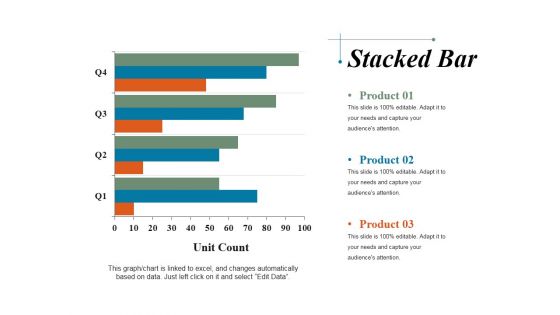
Stacked Bar Ppt PowerPoint Presentation Professional Portfolio
This is a stacked bar ppt powerpoint presentation professional portfolio. This is a four stage process. The stages in this process are product, unit count, step, stacked bar.
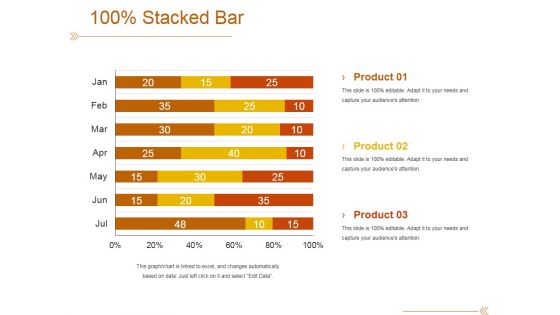
Stacked Bar Ppt PowerPoint Presentation Slides Show
This is a stacked bar ppt powerpoint presentation slides show. This is a three stage process. The stages in this process are product, stacked bar, step, business, marketing.
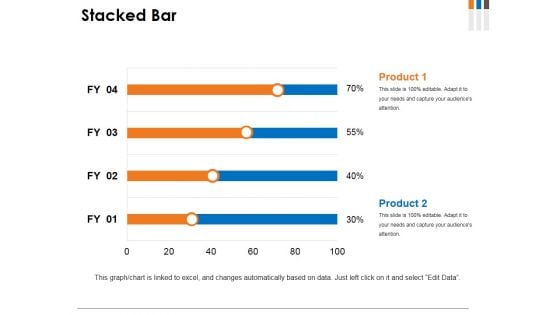
Stacked Bar Ppt PowerPoint Presentation Infographics Styles
This is a stacked bar ppt powerpoint presentation infographics styles. This is a two stage process. The stages in this process are product, staked bar, percentage, finance, step.
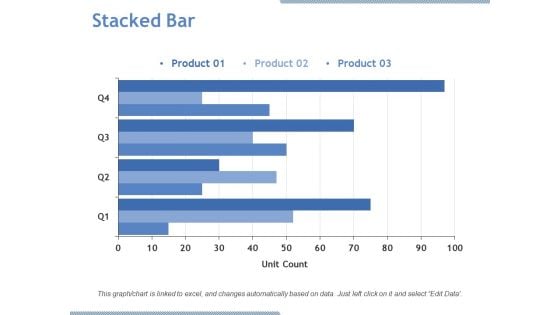
Stacked Bar Ppt PowerPoint Presentation Inspiration Templates
This is a stacked bar ppt powerpoint presentation inspiration templates. This is a three stage process. The stages in this process are product, unit count, stacked bar.
Clustered Bar Ppt PowerPoint Presentation Icon Objects
This is a clustered bar ppt powerpoint presentation icon objects. This is a two stage process. The stages in this process are clustered bar, product, unit count.

 Home
Home