Chart Analysis

X And R Analysis Chart Ppt Presentation
This is a x and r analysis chart ppt presentation. This is a two stage process. The stages in this process are subtitle, ucl, lcl, option.
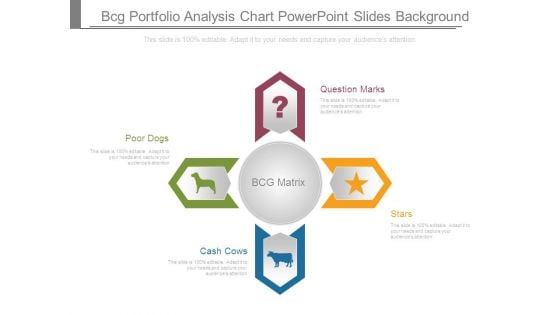
Bcg Portfolio Analysis Chart Powerpoint Slides Background
This is a bcg portfolio analysis chart powerpoint slides background. This is a four stage process. The stages in this process are question marks, stars, cash cows, poor dogs.
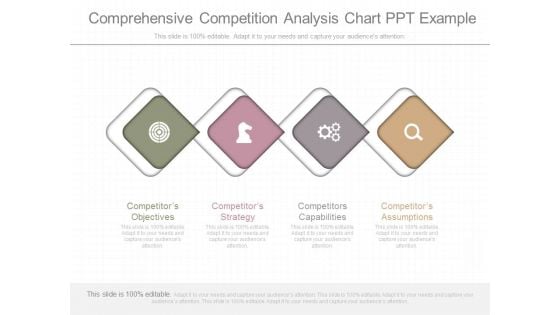
Comprehensive Competition Analysis Chart Ppt Example
This is a comprehensive competition analysis chart ppt example. This is a four stage process. The stages in this process are competitors objectives, competitors strategy, competitors capabilities, competitors assumptions.
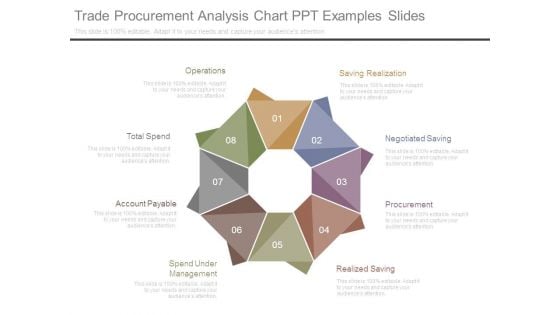
Trade Procurement Analysis Chart Ppt Examples Slides
This is a trade procurement analysis chart ppt examples slides. This is a eight stage process. The stages in this process are operations, total spend, account payable, spend under management, realized saving, procurement, negotiated saving, saving realization.
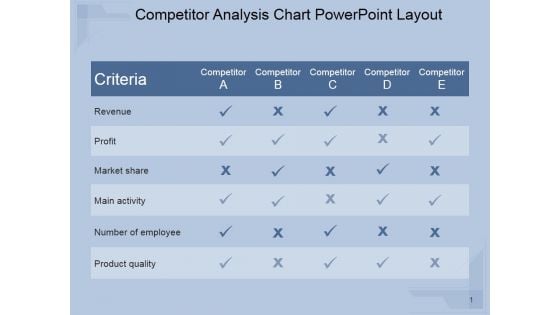
Competitor Analysis Chart Ppt PowerPoint Presentation Visuals
This is a competitor analysis chart ppt powerpoint presentation visuals. This is a five stage process. The stages in this process are revenue, profit, market share, main activity, number of employee, product quality.
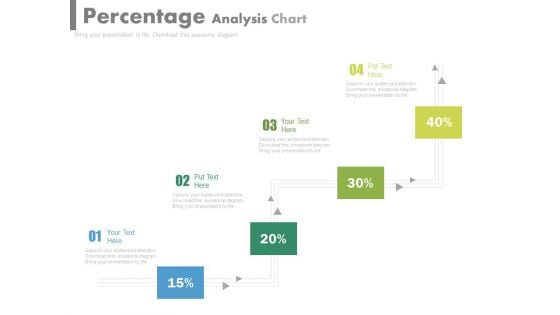
Pipeline Percentage Analysis Chart Powerpoint Slides
This PowerPoint template has been designed with pipeline percentage analysis chart. This PPT slide can be used to display business strategy plan. You can download finance PowerPoint template to prepare awesome presentations.
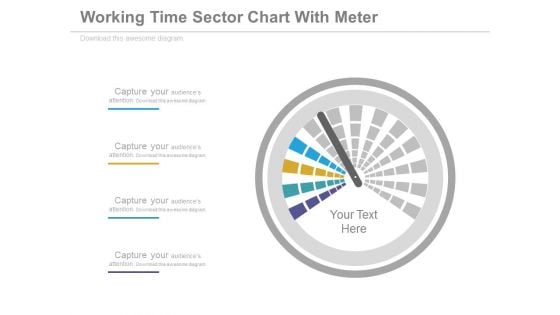
Dashboard Performance Analysis Chart Powerpoint Slides
This PowerPoint template graphics of meter chart. Download this PPT chart for business performance analysis. This PowerPoint slide is of great help in the business sector to make realistic presentations and provides effective way of presenting your newer thoughts.
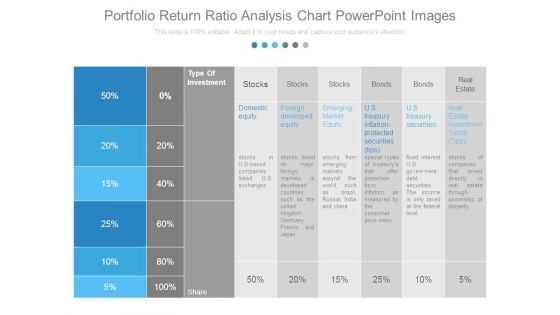
Portfolio Return Ratio Analysis Chart Powerpoint Images
This is a portfolio return ratio analysis chart powerpoint images. This is a six stage process. The stages in this process are type of investment, stocks, bonds, real estate, domestic equity, foreign developed equity, emerging market equity, u s treasury inflation protected securities tips, u s treasury securities, real estate investment trusts tips, share.
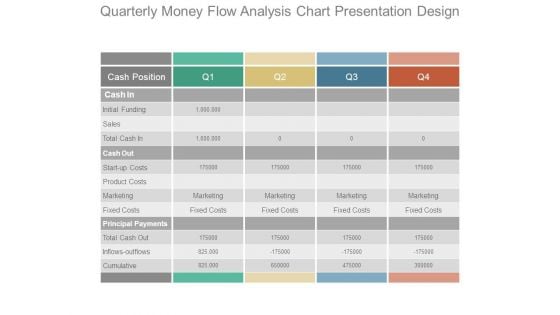
Quarterly Money Flow Analysis Chart Presentation Design
This is a quarterly money flow analysis chart presentation design. This is a four stage process. The stages in this process are cash position, cash in, initial funding, sales, total cash in, cash out, start up costs, product costs, marketing, fixed costs, principal payments, total cash out, inflows outflows, cumulative.
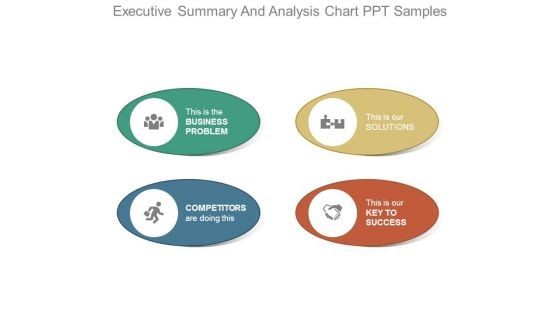
Executive Summary And Analysis Chart Ppt Samples
This is a executive summary and analysis chart ppt samples. This is a four stage process. The stages in this process are this is the business problem, this is our solutions, competitors are doing this, this is our key to success.
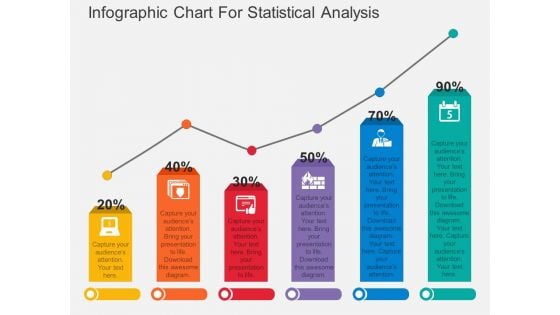
Infographic Chart For Statistical Analysis Powerpoint Template
Download this exclusive business diagram to display statistical analysis. This PowerPoint template contains bar chart with percentage values. This diagram is useful for business presentations.
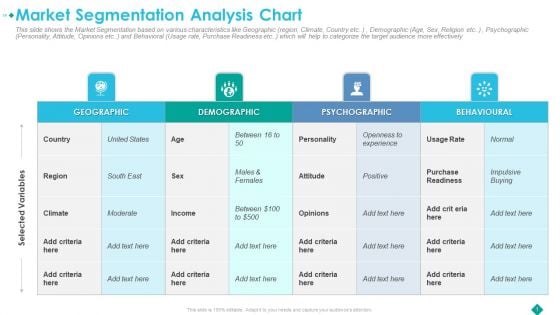
Market Segmentation Analysis Chart Download PDF
This slide shows the Market Segmentation based on various characteristics like Geographic region, Climate, Country etc., Demographic Age, Sex, Religion etc , Psychographic Personality, Attitude, Opinions etc and Behavioral Usage rate, Purchase Readiness etc. which will help to categorize the target audience more effectively Deliver and pitch your topic in the best possible manner with this market segmentation analysis chart download pdf. Use them to share invaluable insights on demographic, geographic, psychographic, behavioural and impress your audience. This template can be altered and modified as per your expectations. So, grab it now.
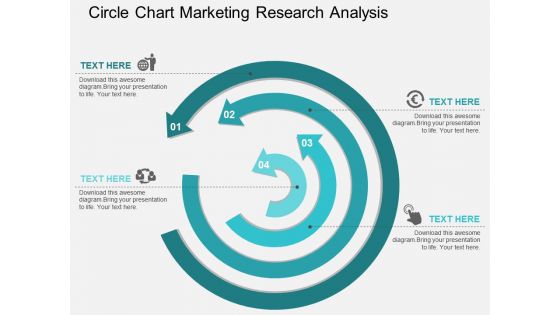
Circle Chart Marketing Research Analysis Powerpoint Template
Above PPT slide provides the ideal backdrop to display marketing research analysis. This PowerPoint template contains graphics of circular arrows chart. Add this diagram in your presentations to visually support your content.
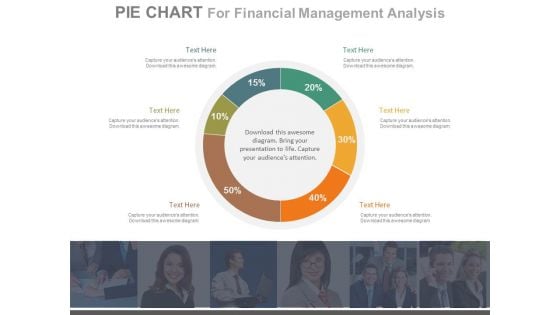
Pie Chart For Customer Analysis Powerpoint Slides
This PowerPoint template has been designed with percentage ratio pie chart. This PPT slide can be used to display customer analysis. You can download finance PowerPoint template to prepare awesome presentations.

Column Chart For Financial Analysis Powerpoint Slides
This PowerPoint template has been designed with graphics of column chart with percentage values. You may use this business slide design for topics like financial analysis and planning. This PPT slide is powerful tool to describe your ideas.
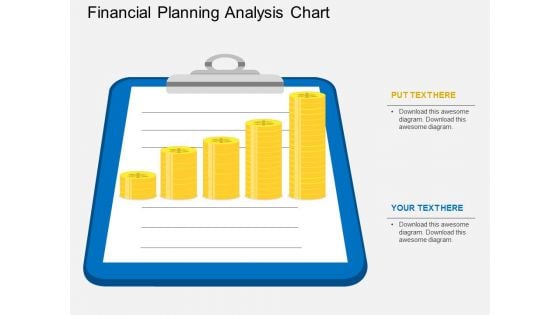
Financial Planning Analysis Chart Powerpoint Template
This PowerPoint slide contains graphics of note pad with gold coins. This professional slide may be used to display financial planning, report and analysis. Adjust the above diagram in your business presentations to give professional impact.
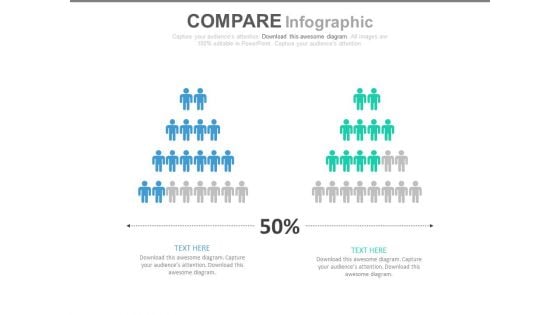
Two Teams Performance Analysis Chart Powerpoint Slides
This PowerPoint template has been designed with icons of two teams with percentage values. Download this PPT slide to depict team?s performance analysis. Deliver amazing presentations to mesmerize your audience by using this PPT slide design.
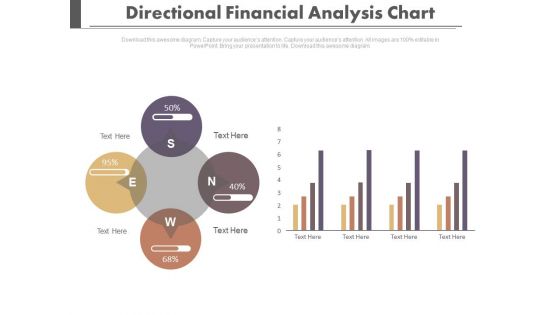
Four Directions Circular Analysis Chart Powerpoint Slides
Our professionally designed business diagram is as an effective tool for communicating business strategy. It contains four directional circular charts. Above slide is also suitable to display financial planning and strategy.
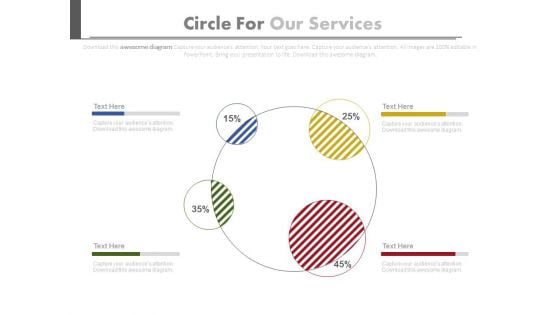
Circle Chart For Value Analysis Powerpoint Slides
This PowerPoint template has been designed for business presentations and corporate slides. The PowerPoint template has a high quality design. You can download this PowerPoint slide for corporate presentations or annual meeting and business plans.
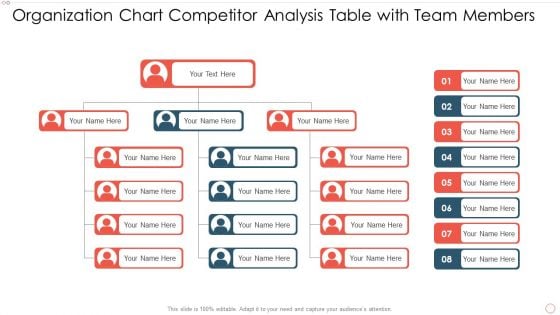
Organization Chart Competitor Analysis Table With Team Members Diagrams PDF
Pitch your topic with ease and precision using this organization chart competitor analysis table with team members diagrams pdf. This layout presents information on organization chart competitor analysis table with team members. It is also available for immediate download and adjustment. So, changes can be made in the color, design, graphics or any other component to create a unique layout.
Combo Chart Investment Analysis Ppt PowerPoint Presentation Icon
This is a combo chart investment analysis ppt powerpoint presentation icon. The topics discussed in this diagram are finance, marketing, management, investment, analysis. This is a completely editable PowerPoint presentation, and is available for immediate download.
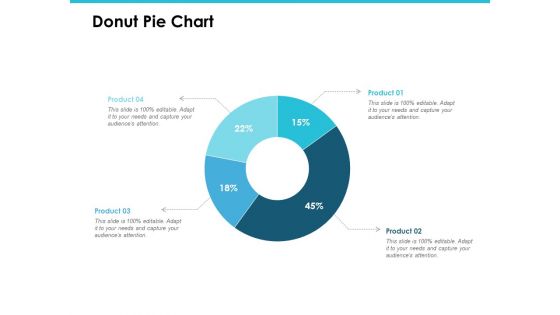
Donut Pie Chart Investment Analysis Ppt PowerPoint Presentation Gallery Introduction
This is a donut pie chart investment analysis ppt powerpoint presentation gallery introduction. This is a four stage process. The stages in this process are finance, marketing, management, investment, analysis.
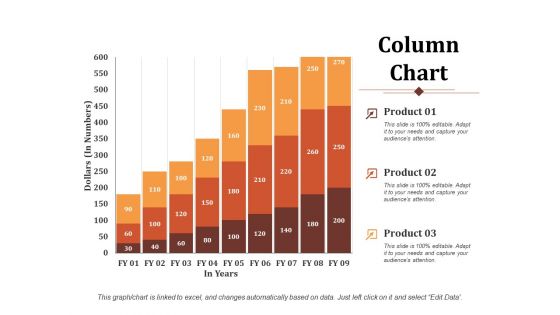
Column Chart Business Analysis Ppt PowerPoint Presentation Outline Example Introduction
This is a column chart business analysis ppt powerpoint presentation outline example introduction. This is a three stage process. The stages in this process are column chart, finance, marketing, management, investment.
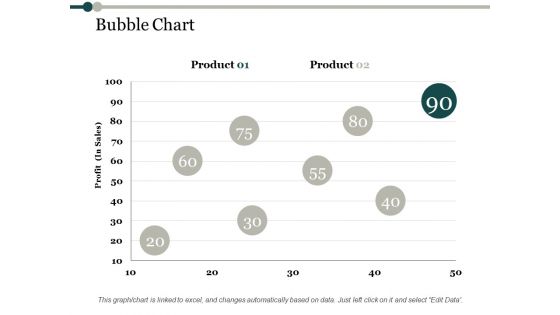
Bubble Chart Process Analysis Ppt PowerPoint Presentation Ideas Files
This is a bubble chart process analysis ppt powerpoint presentation ideas files. This is a two stage process. The stages in this process are bubble chart, product, profit, finance, business.
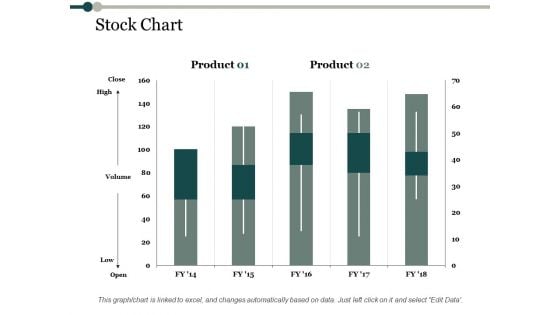
Stock Chart Process Analysis Ppt PowerPoint Presentation Professional Information
This is a stock chart process analysis ppt powerpoint presentation professional information. This is a two stage process. The stages in this process are stock chart, product, high, volume, low.
Combo Chart Marketing Analysis Ppt Powerpoint Presentation Pictures Icons
This is a combo chart marketing analysis ppt powerpoint presentation pictures icons. This is a three stage process. The stages in this process are finance, marketing, management, investment, analysis.
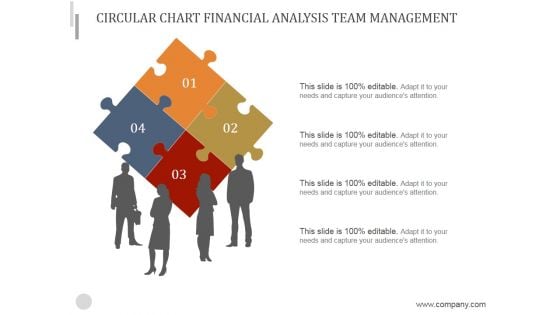
Circular Chart Financial Analysis Team Management Ppt PowerPoint Presentation Guide
This is a circular chart financial analysis team management ppt powerpoint presentation guide. This is a four stage process. The stages in this process are puzzle, teamwork, business, marketing, analysis.
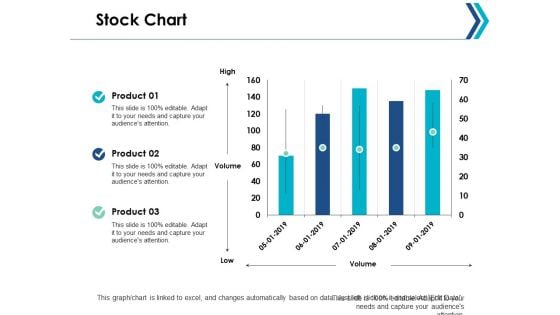
Stock Chart Finance Analysis Ppt Powerpoint Presentation Ideas Portrait
This is a stock chart finance analysis ppt powerpoint presentation ideas portrait. This is a three stage process. The stages in this process are finance, marketing, management, investment, strategy.
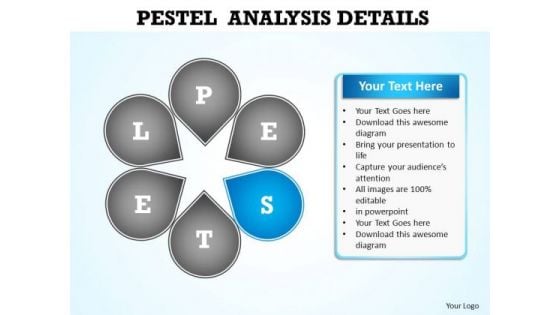
PowerPoint Slide Layout Chart Pestel Analysis Ppt Design
PowerPoint Slide layout Chart Pestel Analysis PPT Design-The Circle of Life - a concept embedded in our minds and hence easy to comprehend. Life and Business is made up of processes comprising stages that flow from one to another. An excellent graphic to attract the attention of and understanding by your audience to improve earnings. Be a conscious and capable citizen. Elaborate on your environmental concerns with our PowerPoint Slide Layout Chart Pestel Analysis Ppt Design.
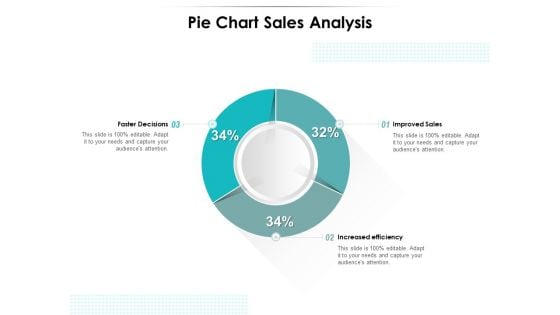
Pie Chart Sales Analysis Ppt PowerPoint Presentation Samples PDF
Presenting this set of slides with name pie chart sales analysis ppt powerpoint presentation samples pdf. The topics discussed in these slides are improved sales, increased efficiency, faster decisions. This is a completely editable PowerPoint presentation and is available for immediate download. Download now and impress your audience.
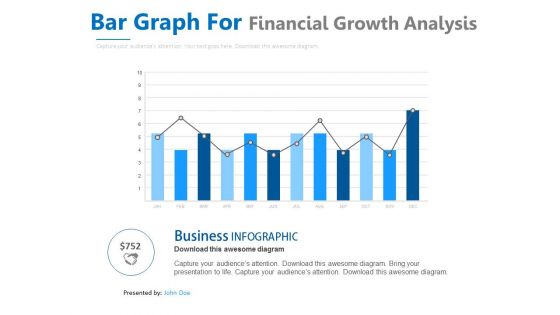
Bar Graph With Line Chart For Analysis Powerpoint Slides
This PowerPoint template contains design of bar graph with line chart. You may download this slide to display strategy steps for business growth. You can easily customize this template to make it more unique as per your need.
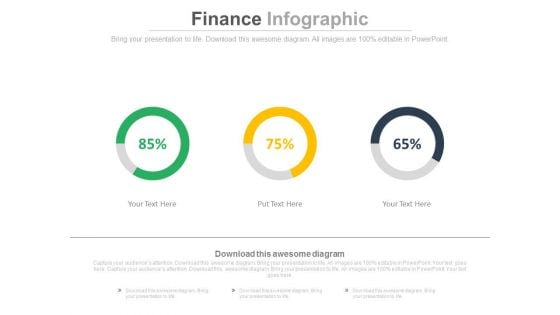
Linear Circles Percentage Analysis Charts Powerpoint Slides
This PowerPoint template has been designed with graphics of three circles and percentage ratios. You may use this dashboard slide design for topics like profit growth and financial planning. This PPT slide is powerful tool to describe your ideas.
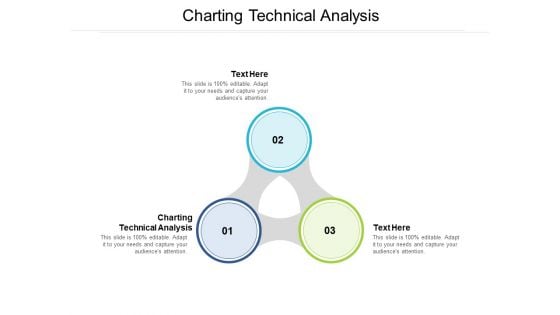
Charting Technical Analysis Ppt PowerPoint Presentation Inspiration Gallery Cpb
Presenting this set of slides with name charting technical analysis ppt powerpoint presentation inspiration gallery cpb. This is an editable Powerpoint three stages graphic that deals with topics like charting technical analysis to help convey your message better graphically. This product is a premium product available for immediate download and is 100 percent editable in Powerpoint. Download this now and use it in your presentations to impress your audience.
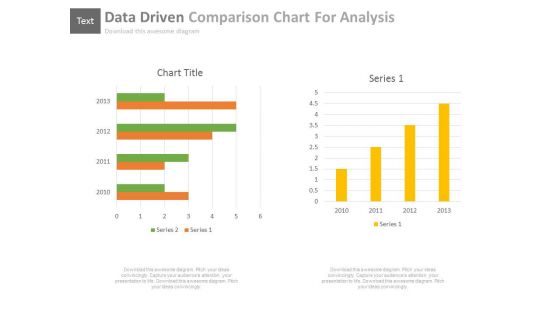
Data Driven Comparison Charts For Analysis Powerpoint Slides
You can download this PowerPoint template to display statistical data and analysis. This PPT slide contains data driven comparison charts. Draw an innovative business idea using this professional diagram.
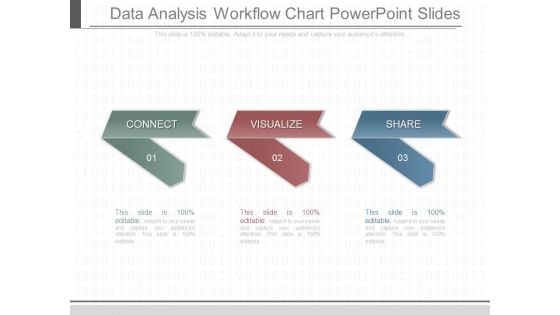
Data Analysis Workflow Chart Powerpoint Slides
This is a data analysis workflow chart powerpoint slides. This is a three stage process. The stages in this process are connect, visualize, share.
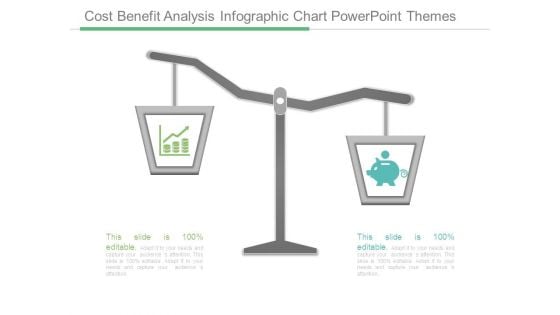
Cost Benefit Analysis Infographic Chart Powerpoint Themes
This is a cost benefit analysis infographic chart powerpoint themes. This is a two stage process. The stages in this process are balance, icons, finance, strategy, business.
Operating Expenses Analysis Pie Chart Ppt Icon
This is a operating expenses analysis pie chart ppt icon. This is a seven stage process. The stages in this process are finance, success, business, marketing, percentage.
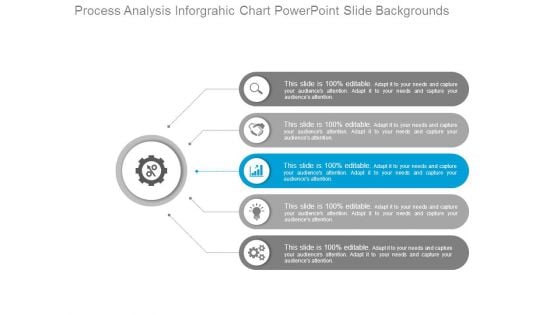
Process Analysis Inforgrahic Chart Powerpoint Slide Backgrounds
This is a process analysis inforgrahic chart powerpoint slide backgrounds. This is a five stage process. The stages in this process are customer business, marketing, icons, strategy.
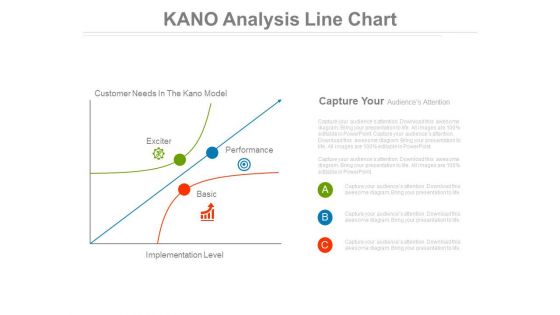
Kano Analysis Line Chart Ppt Slides
This is a kano analysis line chart ppt slides. This is a three stage process. The stages in this process are marketing, business.\n\n
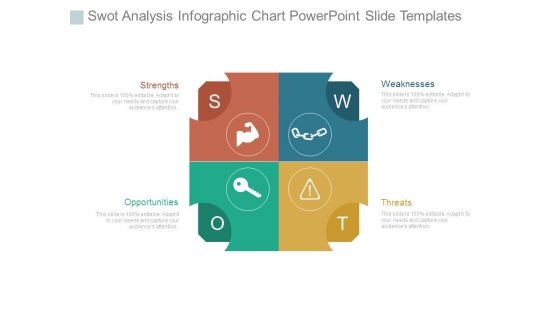
Swot Analysis Infographic Chart Powerpoint Slide Templates
This is a swot analysis infographic chart powerpoint slide templates. This is a four stage process. The stages in this process are strengths, opportunities, threats, weaknesses.
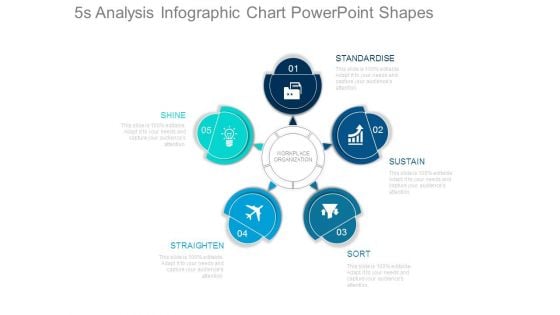
5s Analysis Infographic Chart Powerpoint Shapes
This is a 5s analysis infographic chart powerpoint shapes. This is a five stage process. The stages in this process are workplace organization, shine, straighten, sort, sustain, standardise.
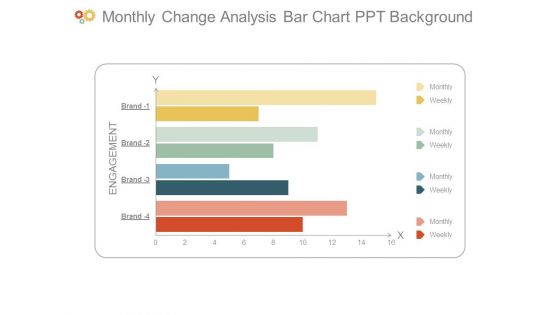
Monthly Change Analysis Bar Chart Ppt Background
This is a monthly change analysis bar chart ppt background. This is a four stage process. The stages in this process are engagement, monthly, weekly, brand.
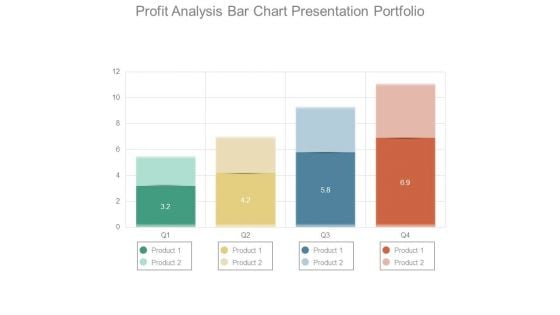
Profit Analysis Bar Chart Presentation Portfolio
This is a profit analysis bar chart presentation portfolio. This is a four stage process. The stages in this process are product.
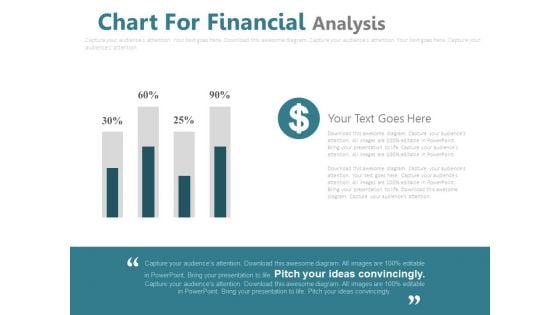
Chart For Financial Percentage Analysis Powerpoint Slides
This PowerPoint template has been designed with financial chart with dollar icon. This PPT slide may be used to display dollar value analysis chart. Download this slide to build unique presentation.
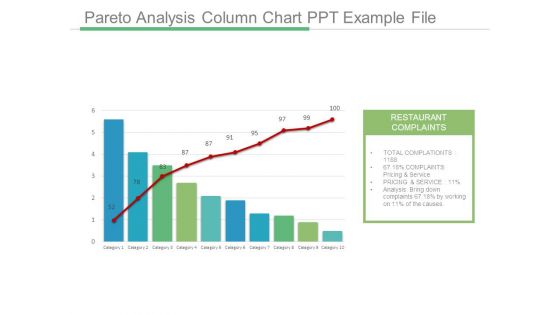
Pareto Analysis Column Chart Ppt Example File
This is a pareto analysis column chart ppt example file. This is a ten stage process. The stages in this process are restaurant complaints, total complaints, complaints pricing and service, pricing and service, analysis bring down complaints, category.
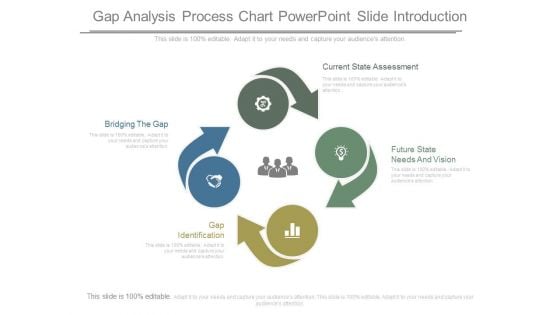
Gap Analysis Process Chart Powerpoint Slide Introduction
This is a gap analysis process chart powerpoint slide introduction. This is a four stage process. The stages in this process are bridging the gap, gap identification, future state needs and vision, current state assessment.
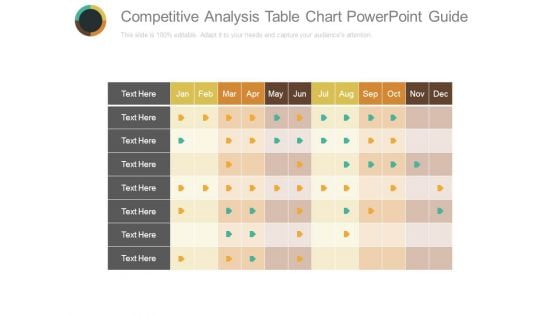
Competitive Analysis Table Chart Powerpoint Guide
This is a competitive analysis table chart powerpoint guide. This is a twelve stage process. The stages in this process are jan,feb, mar, apr, may, jun, jul, aug, sep, oct, nov, dec.
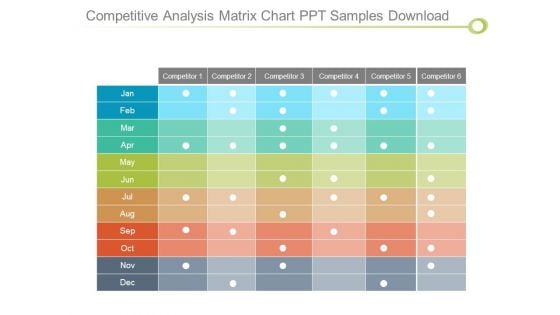
Competitive Analysis Matrix Chart Ppt Samples Download
This is a competitive analysis matrix chart ppt samples download. This is a six stage process. The stages in this process are competitor, jan, feb, mar, apr, may, jun, jul, aug, sep, oct, nov, dec.
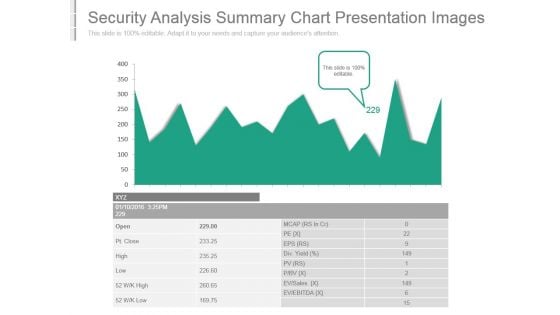
Security Analysis Summary Chart Presentation Images
This is a security analysis summary chart presentation images. This is a one stage process. The stages in this process are ev ebitda, ev sales, div yield, open, pt close, high, low, mcap, eps.
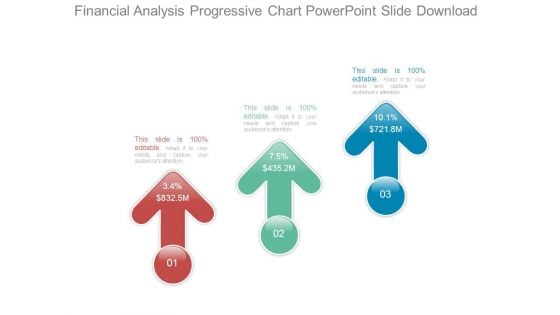
Financial Analysis Progressive Chart Powerpoint Slide Download
This is a financial analysis progressive chart powerpoint slide download. This is a three stage process. The stages in this process are 3 point 4 percent dollar 832 point 5m, 7 point 5 percent dollar 435 point 2 m, 10 point 1 percent dollar 721 point 8m.
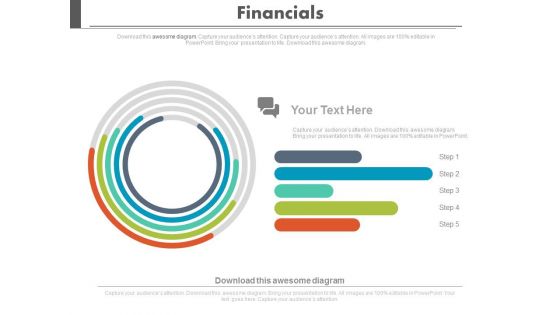
Financial Growth Analysis Circular Chart Powerpoint Slides
Visually support your presentation with our above template containing graphics of circular chart. This diagram slide helps to display financial growth analysis. Etch your views in the brains of your audience with this diagram slide.

Comprehensive Solution Analysis Solution Assessment Criteria Analysis Chart Mockup PDF
This slide shows the solution assessment criteria analysis chart whose purpose is to evaluate the options available for a particular solution based on management receptivity, degree of risk and feasibility, solution cost etc.. along with the total score of each solution. This is a comprehensive solution analysis solution assessment criteria analysis chart mockup pdf template with various stages. Focus and dispense information on one stage using this creative set, that comes with editable features. It contains large content boxes to add your information on topics like solution assessment criteria analysis chart. You can also showcase facts, figures, and other relevant content using this PPT layout. Grab it now.
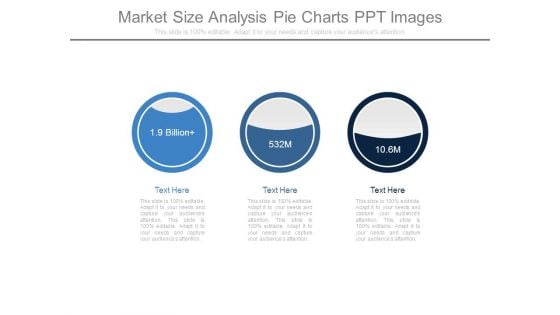
Market Size Analysis Pie Charts Ppt Images
This is a market size analysis pie charts ppt images. This is a three stage process. The stages in this process are business, marketing, analysis, management, strategy.
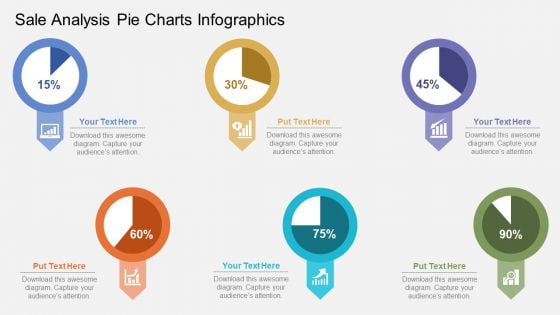
Sales Analysis Pie Charts Infographics Powerpoint Template
Pie charts infographic diagram has been used to design this PowerPoint template. This PPT slide may be used to depict Sales trend analysis and sales forecasting. Download this professional slide to make impressive presentation.
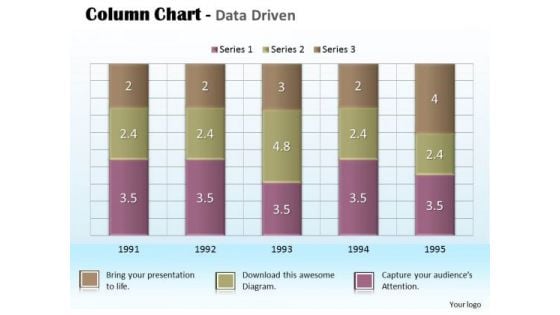
Business Data Analysis Chart For Project PowerPoint Templates
Document Your Views On Our business data analysis chart for project Powerpoint Templates. They Will Create A Strong Impression.

Business Data Analysis Chart For Case Studies PowerPoint Templates
Get Out Of The Dock With Our business data analysis chart for case studies Powerpoint Templates. Your Mind Will Be Set Free.
Value Canvas Icon With Competitor Analysis Chart Pictures Pdf
Showcasing this set of slides titled Value Canvas Icon With Competitor Analysis Chart Pictures Pdf. The topics addressed in these templates are Value Canvas Icon, Competitor Analysis Chart. All the content presented in this PPT design is completely editable. Download it and make adjustments in color, background, font etc. as per your unique business setting. Our Value Canvas Icon With Competitor Analysis Chart Pictures Pdf are topically designed to provide an attractive backdrop to any subject. Use them to look like a presentation pro.
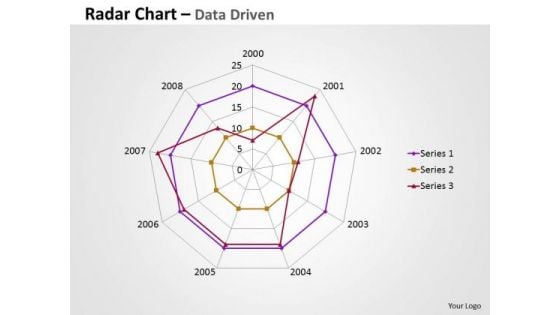
Business Data Analysis Chart Comparing Multiple Entities PowerPoint Templates
Analyze Ailments On Our business data analysis chart comparing multiple entities Powerpoint Templates. Bring Out The Thinking Doctor In You. Dock Your Thoughts With Our Financial Analysis . They Will Launch Them Into Orbit.
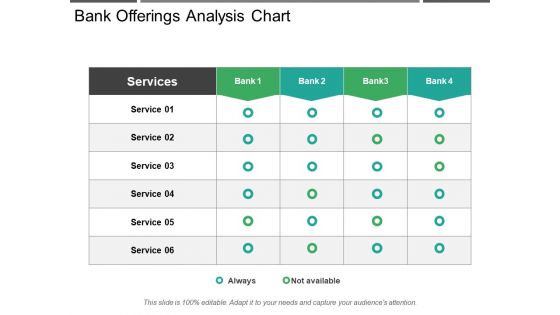
Bank Offerings Analysis Chart Ppt PowerPoint Presentation Slides Show
This is a bank offerings analysis chart ppt powerpoint presentation slides show. This is a five stage process. The stages in this process are comparison chart, comparison table, comparison matrix.
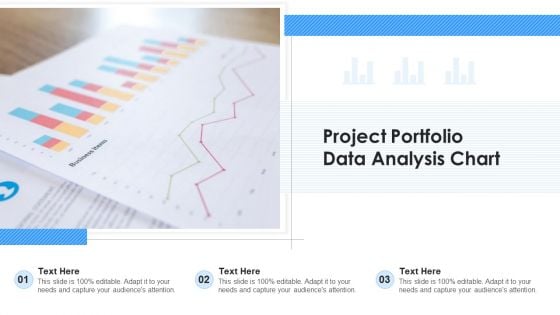
Project Portfolio Data Analysis Chart Ppt Ideas Gallery PDF
Presenting project portfolio data analysis chart ppt ideas gallery pdf to dispense important information. This template comprises three stages. It also presents valuable insights into the topics including project portfolio data analysis chart. This is a completely customizable PowerPoint theme that can be put to use immediately. So, download it and address the topic impactfully.

 Home
Home