Chart Analysis
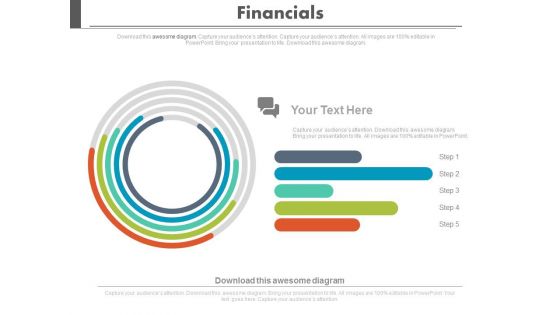
Financial Growth Analysis Circular Chart Powerpoint Slides
Visually support your presentation with our above template containing graphics of circular chart. This diagram slide helps to display financial growth analysis. Etch your views in the brains of your audience with this diagram slide.

Comprehensive Solution Analysis Solution Assessment Criteria Analysis Chart Mockup PDF
This slide shows the solution assessment criteria analysis chart whose purpose is to evaluate the options available for a particular solution based on management receptivity, degree of risk and feasibility, solution cost etc.. along with the total score of each solution. This is a comprehensive solution analysis solution assessment criteria analysis chart mockup pdf template with various stages. Focus and dispense information on one stage using this creative set, that comes with editable features. It contains large content boxes to add your information on topics like solution assessment criteria analysis chart. You can also showcase facts, figures, and other relevant content using this PPT layout. Grab it now.
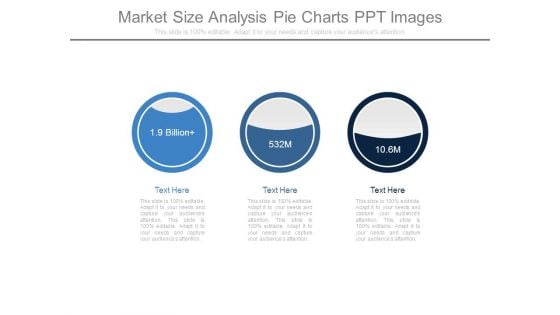
Market Size Analysis Pie Charts Ppt Images
This is a market size analysis pie charts ppt images. This is a three stage process. The stages in this process are business, marketing, analysis, management, strategy.
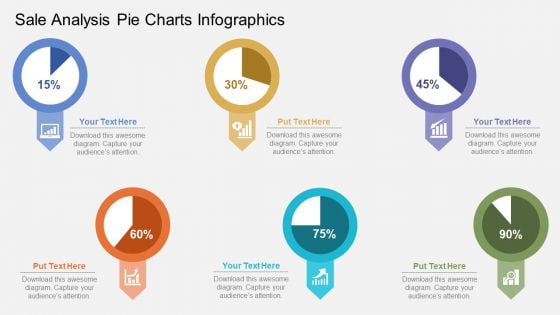
Sales Analysis Pie Charts Infographics Powerpoint Template
Pie charts infographic diagram has been used to design this PowerPoint template. This PPT slide may be used to depict Sales trend analysis and sales forecasting. Download this professional slide to make impressive presentation.
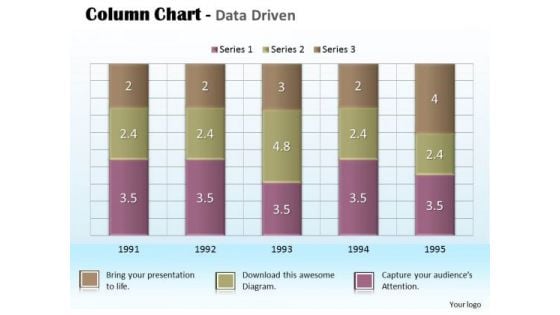
Business Data Analysis Chart For Project PowerPoint Templates
Document Your Views On Our business data analysis chart for project Powerpoint Templates. They Will Create A Strong Impression.

Business Data Analysis Chart For Case Studies PowerPoint Templates
Get Out Of The Dock With Our business data analysis chart for case studies Powerpoint Templates. Your Mind Will Be Set Free.
Value Canvas Icon With Competitor Analysis Chart Pictures Pdf
Showcasing this set of slides titled Value Canvas Icon With Competitor Analysis Chart Pictures Pdf. The topics addressed in these templates are Value Canvas Icon, Competitor Analysis Chart. All the content presented in this PPT design is completely editable. Download it and make adjustments in color, background, font etc. as per your unique business setting. Our Value Canvas Icon With Competitor Analysis Chart Pictures Pdf are topically designed to provide an attractive backdrop to any subject. Use them to look like a presentation pro.
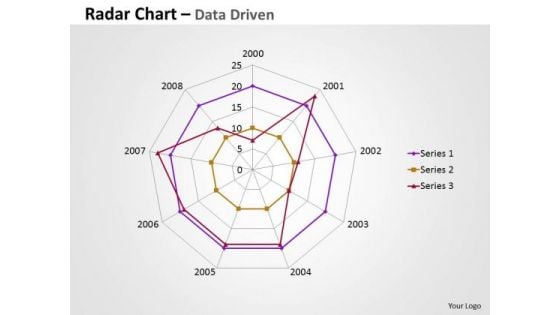
Business Data Analysis Chart Comparing Multiple Entities PowerPoint Templates
Analyze Ailments On Our business data analysis chart comparing multiple entities Powerpoint Templates. Bring Out The Thinking Doctor In You. Dock Your Thoughts With Our Financial Analysis . They Will Launch Them Into Orbit.
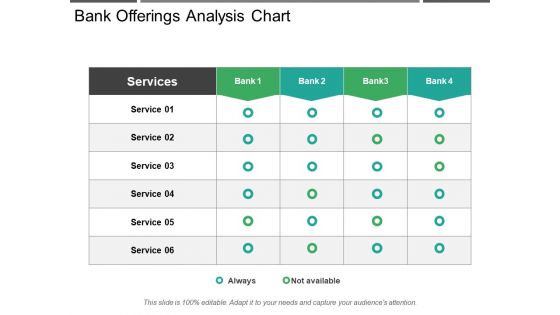
Bank Offerings Analysis Chart Ppt PowerPoint Presentation Slides Show
This is a bank offerings analysis chart ppt powerpoint presentation slides show. This is a five stage process. The stages in this process are comparison chart, comparison table, comparison matrix.
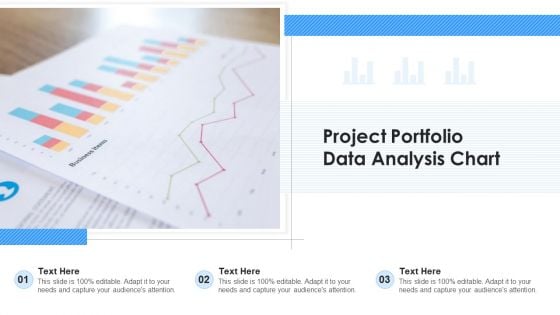
Project Portfolio Data Analysis Chart Ppt Ideas Gallery PDF
Presenting project portfolio data analysis chart ppt ideas gallery pdf to dispense important information. This template comprises three stages. It also presents valuable insights into the topics including project portfolio data analysis chart. This is a completely customizable PowerPoint theme that can be put to use immediately. So, download it and address the topic impactfully.
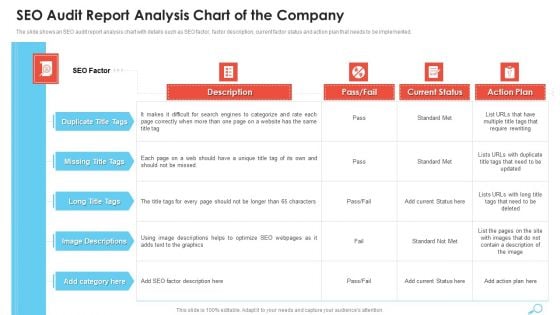
SEO Audit Report Analysis Chart Of The Company Rules PDF
The slide shows an SEO audit report analysis chart with details such as SEO factor, factor description, current factor status and action plan that needs to be implemented.Deliver an awe inspiring pitch with this creative SEO Audit Report Analysis Chart Of The Company Rules PDF bundle. Topics like Engines To Categorize, Duplicate Title, Image Descriptions can be discussed with this completely editable template. It is available for immediate download depending on the needs and requirements of the user.
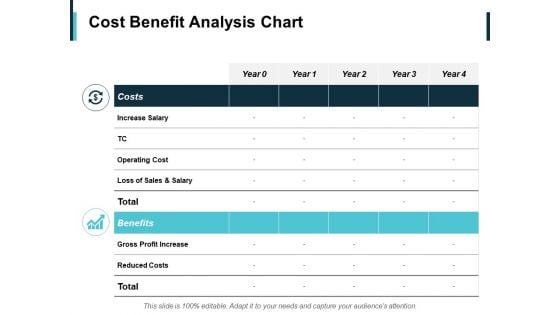
Cost Benefit Analysis Chart Ppt PowerPoint Presentation Ideas Shapes
This is a cost benefit analysis chart ppt powerpoint presentation ideas shapes. This is a two stage process. The stages in this process are reduced costs, operating cost, benefits, costs, increase salary.
Area Chart For Data Analysis Ppt PowerPoint Presentation Icon Backgrounds
Presenting this set of slides with name area chart for data analysis ppt powerpoint presentation icon backgrounds. The topics discussed in these slide is area chart for data analysis. This is a completely editable PowerPoint presentation and is available for immediate download. Download now and impress your audience.
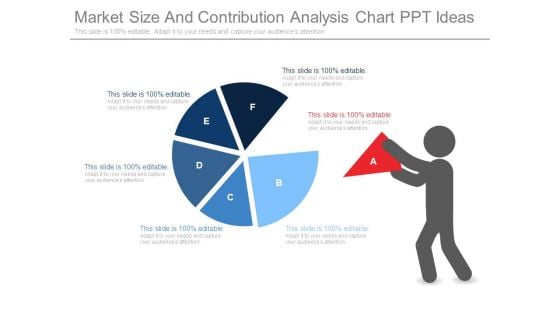
Market Size And Contribution Analysis Chart Ppt Ideas
This is a market size and contribution analysis chart ppt ideas. This is a six stage process. The stages in this process are business, marketing, contribution, management, ideas.
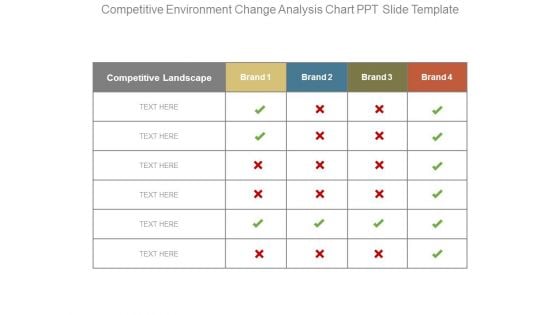
Competitive Environment Change Analysis Chart Ppt Slide Template
This is a competitive environment change analysis chart ppt slide template. This is a four stage process. The stages in this process are competitive landscape, brand.
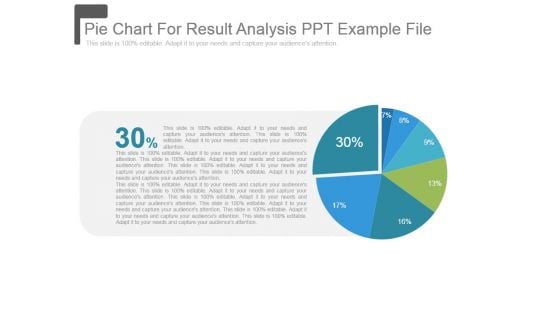
Pie Chart For Result Analysis Ppt Example File
This is a pie chart for result analysis ppt example file. This is a seven stage process. The stages in this process are pie, marketing, strategy, finance, percentage.
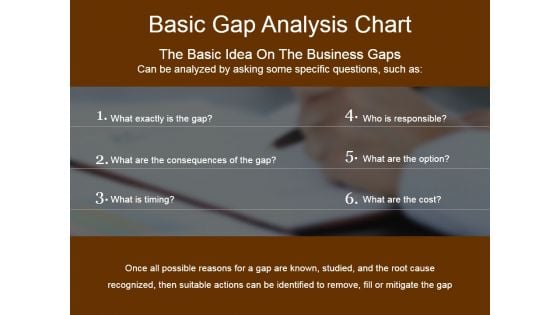
Basic Gap Analysis Chart Ppt PowerPoint Presentation Professional Portfolio
This is a basic gap analysis chart ppt powerpoint presentation professional portfolio. This is a six stage process. The stages in this process are business, step, marketing, management.

Statistical Data Analysis Chart Of Collected Data Formats PDF
Presenting statistical data analysis chart of collected data formats pdf to dispense important information. This template comprises four stages. It also presents valuable insights into the topics including statistical data analysis chart of collected data. This is a completely customizable PowerPoint theme that can be put to use immediately. So, download it and address the topic impactfully.
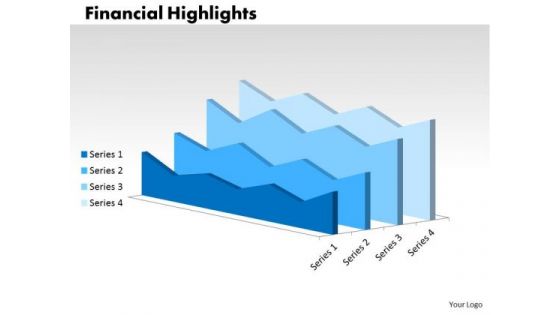
Strategy Diagram Growth Analysis Chart Diagram Consulting Diagram
Double Up Our Strategy Diagram Growth Analysis Chart Diagram Consulting Diagram Powerpoint Templates With Your Thoughts. They Will Make An Awesome Pair. When In Doubt Use Our Strategy Diagram Growth Analysis Chart Diagram Consulting Diagram Powerpoint Templates. The Way Ahead Will Become Crystal Clear.
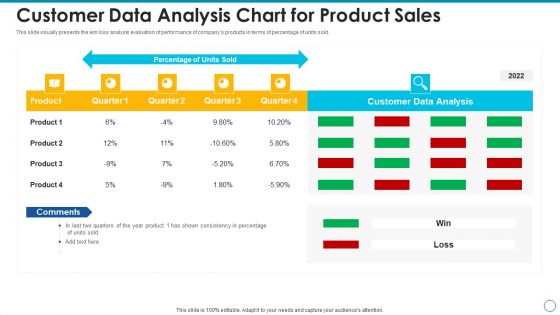
Customer Data Analysis Chart For Product Sales Inspiration PDF
Showcasing this set of slides titled customer data analysis chart for product sales inspiration pdf. The topics addressed in these templates are customer data analysis chart for product sales. All the content presented in this PPT design is completely editable. Download it and make adjustments in color, background, font etc. as per your unique business setting.
Input Process Output Processing Analysis Chart Icon Sample PDF
Presenting Input Process Output Processing Analysis Chart Icon Sample PDF to dispense important information. This template comprises Three stages. It also presents valuable insights into the topics including Input Process, Output Processing, Analysis Chart. This is a completely customizable PowerPoint theme that can be put to use immediately. So, download it and address the topic impactfully.
cost volume profit analysis chart ppt powerpoint presentation icon slideshow
This is a cost volume profit analysis chart ppt powerpoint presentation icon slideshow. This is a three stage process. The stages in this process are break even point,break even analysis,break even level.
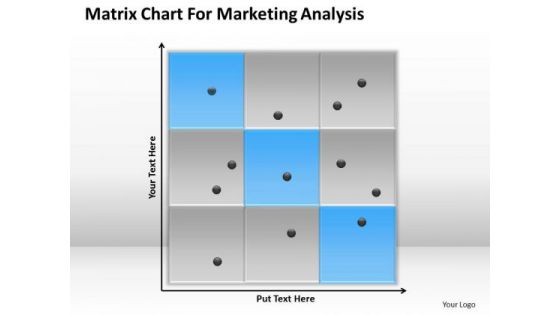
Strategy PowerPoint Template Matrix Chart For Marketing Analysis Ppt Templates
Your thoughts are dripping with wisdom. Lace it with our strategy powerpoint template matrix chart for marketing analysis ppt templates. Give a new drift to your views. Change tack with our Communication PowerPoint Templates. Do not allow things to drift. Ring in changes with our Org Charts PowerPoint Templates. Our Strategy PowerPoint Template Matrix Chart For Marketing Analysis Ppt Templates have more than what meets the eye. They contain additional dimensions.
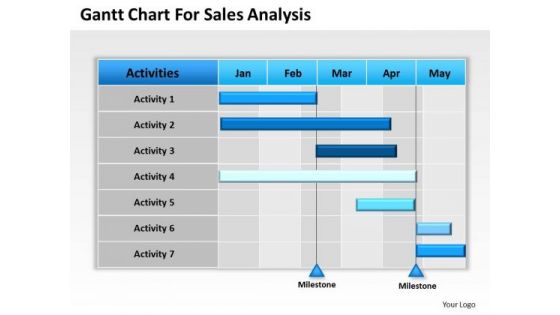
Business PowerPoint Template Gantt Chart For Sales Analysis Pppt Slides
Open up doors that lead to success. Our Business powerpoint template gantt chart for sales analysis pppt Slides provide the handles. Oppurtunity will come knocking at your door. Welcome it with our Org Charts PowerPoint Templates. Our Advertising PowerPoint Templates abhor doodling. They never let the interest flag. Advocate your case with our Business PowerPoint Template Gantt Chart For Sales Analysis Pppt Slides. They will deliver a strong defense.
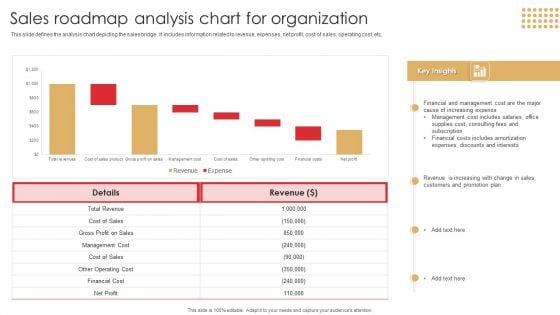
Sales Roadmap Analysis Chart For Organization Download PDF
This slide defines the analysis chart depicting the sales bridge . It includes information related to revenue, expenses, net profit, cost of sales, operating cost, etc.Showcasing this set of slides titled Sales Roadmap Analysis Chart For Organization Download PDF. The topics addressed in these templates are Management Cost, Financial Cost, Includes Amortization. All the content presented in this PPT design is completely editable. Download it and make adjustments in color, background, font etc. as per your unique business setting.
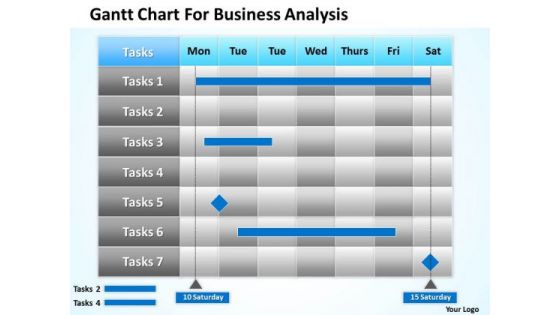
Consulting PowerPoint Template Gantt Chart For Business Analysis Ppt Templates
Your approach is truly down to earth. Our practical consulting PowerPoint template gantt chart for business analysis ppt templates are apt for you. Draft it out on our Business PowerPoint Templates. Give the final touches with your ideas. Get a baker's dozen with our Advertising PowerPoint Templates. Recieve that little bit more than expected. Take your thoughts that extra mile. Express your dream with our Consulting PowerPoint Template Gantt Chart For Business Analysis Ppt Templates.
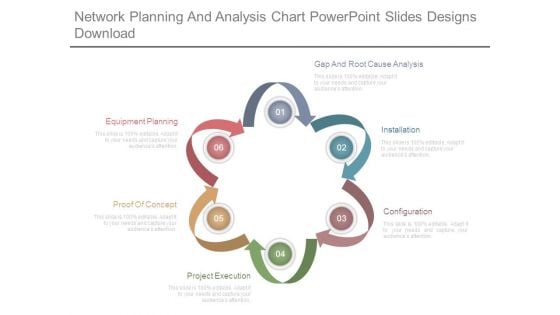
Network Planning And Analysis Chart Powerpoint Slides Designs Download
This is a network planning and analysis chart powerpoint slides designs download. This is a six stage process. The stages in this process are equipment planning, proof of concept, project execution, configuration, installation, gap and root cause analysis.
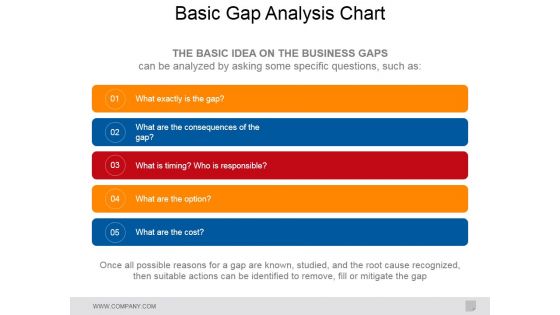
Basic Gap Analysis Chart Ppt PowerPoint Presentation Professional Slide Download
This is a basic gap analysis chart ppt powerpoint presentation professional slide download. This is a five stage process. The stages in this process are business, marketing, analysis, gap, idea, management.
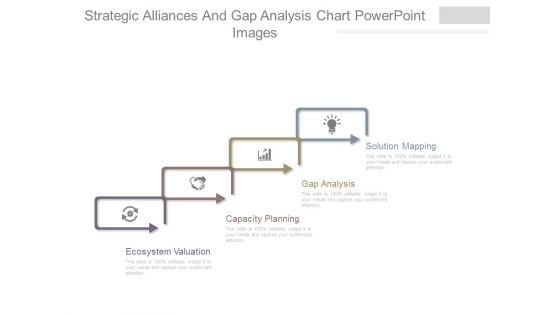
Strategic Alliances And Gap Analysis Chart Powerpoint Images
This is a strategic alliances and gap analysis chart powerpoint images. This is a four stage process. The stages in this process are solution mapping, gap analysis, capacity planning, ecosystem valuation.
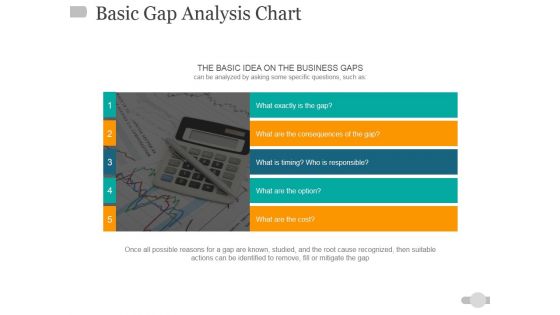
Basic Gap Analysis Chart Ppt PowerPoint Presentation Pictures Design Ideas
This is a basic gap analysis chart ppt powerpoint presentation pictures design ideas. This is a five stage process. The stages in this process are business, finance, marketing, analysis, investment.
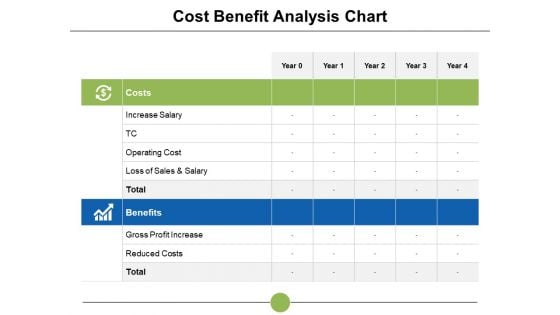
Cost Benefit Analysis Chart Ppt PowerPoint Presentation Slides Example File
This is a cost benefit analysis chart ppt powerpoint presentation slides example file. This is a two stage process. The stages in this process are increase salary, cost benefit, reduced costs, analysis, operating cost.
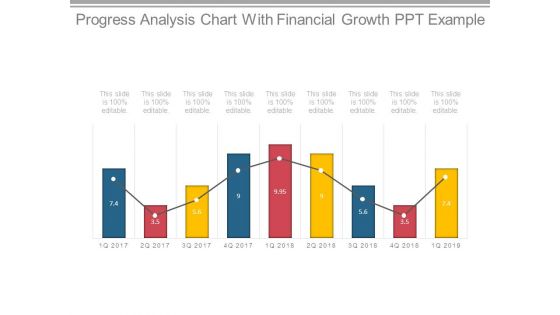
Progress Analysis Chart With Financial Growth Ppt Example
This is a progress analysis chart with financial growth ppt example. This is a nine stage process. The stages in this process are chart, years, business, growth, marketing, management.
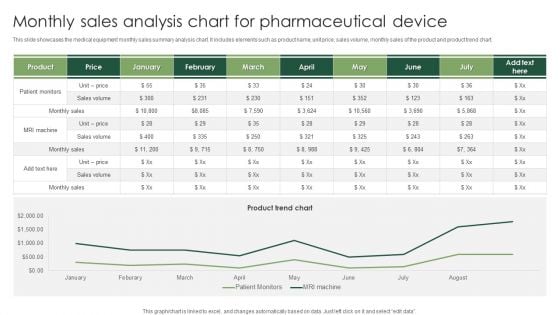
Monthly Sales Analysis Chart For Pharmaceutical Device Structure PDF
This slide showcases the medical equipment monthly sales summary analysis chart. It includes elements such as product name, unit price, sales volume, monthly sales of the product and product trend chart. Showcasing this set of slides titled Monthly Sales Analysis Chart For Pharmaceutical Device Structure PDF. The topics addressed in these templates are Monthly Sales Analysis, Pharmaceutical Device. All the content presented in this PPT design is completely editable. Download it and make adjustments in color, background, font etc. as per your unique business setting.
Business Analysis Chart Vector Icon Ppt PowerPoint Presentation Professional Display
This is a business analysis chart vector icon ppt powerpoint presentation professional display. This is a four stage process. The stages in this process are business marketing plan, business marketing strategies, business marketing approach.
Cost Benefit Analysis Chart With Icons Powerpoint Layout
This is a cost benefit analysis chart with icons powerpoint layout. This is a two stage process. The stages in this process are balance scale, compare, business, marketing, management.
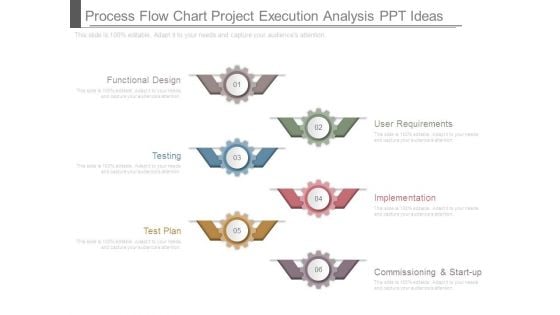
Process Flow Chart Project Execution Analysis Ppt Ideas
This is a process flow chart project execution analysis ppt ideas. This is a six stage process. The stages in this process are functional design, testing, test plan, user requirements, implementation, commissioning and start up.
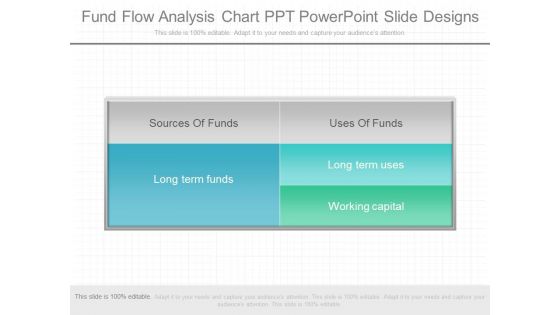
Fund Flow Analysis Chart Ppt Powerpoint Slide Designs
This is a fund flow analysis chart ppt powerpoint slide designs. This is a five stage process. The stages in this process are sources of funds, long term funds, uses of funds, long term uses, working capital.

Break Point Chart For Quality Analysis Powerpoint Slide Show
This is a break point chart for quality analysis powerpoint slide show. This is a one stage process. The stages in this process are total variable costs, fixed costs, quality sold.
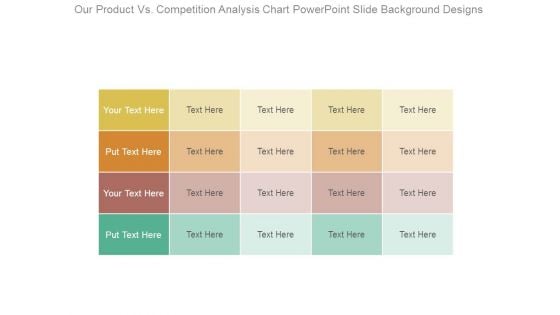
Our Product Vs Competition Analysis Chart Powerpoint Slide Background Designs
This is a our product vs competition analysis chart powerpoint slide background designs. This is a four stage process. The stages in this process are business, marketing, success, strategy, compare.
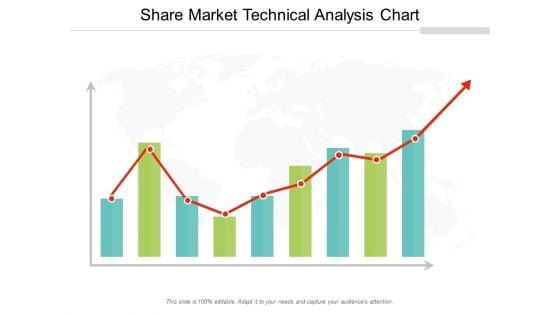
Share Market Technical Analysis Chart Ppt Powerpoint Presentation Professional Rules
This is a share market technical analysis chart ppt powerpoint presentation professional rules. This is a three stage process. The stages in this process are stock market, financial market, bull market.
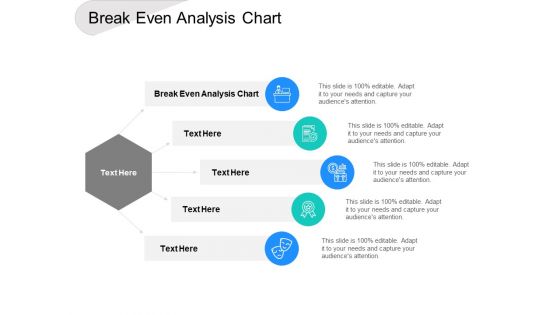
Break Even Analysis Chart Ppt PowerPoint Presentationmodel Brochure Cpb
Presenting this set of slides with name break even analysis chart ppt powerpoint presentationmodel brochure cpb. This is an editable Powerpoint five stages graphic that deals with topics like break even analysis chart to help convey your message better graphically. This product is a premium product available for immediate download and is 100 percent editable in Powerpoint. Download this now and use it in your presentations to impress your audience.
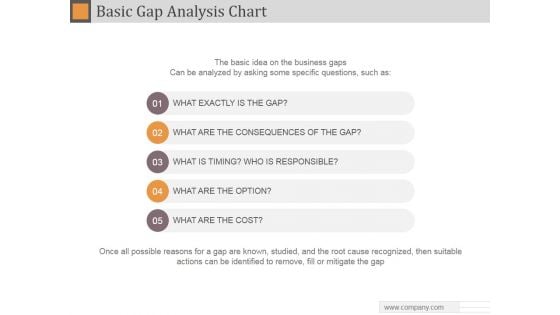
Basic Gap Analysis Chart Ppt PowerPoint Presentation Microsoft
This is a basic gap analysis chart ppt powerpoint presentation microsoft. This is a five stage process. The stages in this process are what exactly is the gap, what are the consequences of the gap, what is timing who is responsible, what are the option, what are the cost.
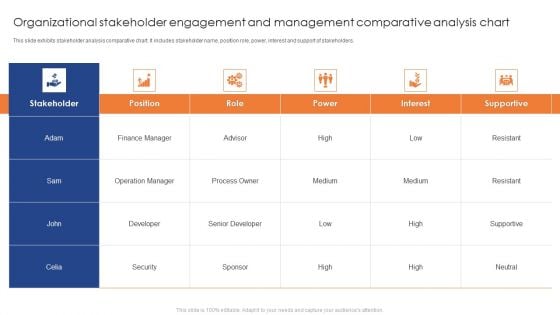
Organizational Stakeholder Engagement And Management Comparative Analysis Chart Professional PDF
This slide exhibits stakeholder analysis comparative chart. It includes stakeholder name, position role, power, interest and support of stakeholders. Showcasing this set of slides titled Organizational Stakeholder Engagement And Management Comparative Analysis Chart Professional PDF. The topics addressed in these templates are Finance Manager, Operation Manager, Developer. All the content presented in this PPT design is completely editable. Download it and make adjustments in color, background, font etc. as per your unique business setting.
Error Tracking With Priority And Status Analysis Chart Icons PDF
This template covers issues analysis reports based on problem status and priority level. It also includes KPIs such as department, reporting date, responsible person, the actual status of the issue, etc. Showcasing this set of slides titled Error Tracking With Priority And Status Analysis Chart Icons PDF. The topics addressed in these templates are Issue Description, Current Status Issues, Analysis Chart. All the content presented in this PPT design is completely editable. Download it and make adjustments in color, background, font etc. as per your unique business setting.

Cross Departmental Technology Skill Gaps Analysis Chart Introduction PDF
This slide covers the gaps in desired and actual skills scorecard of team members in various departments. It includes technical problem solving ability, updating to new innovation, required certification, meeting deadlines, etc. Pitch your topic with ease and precision using this cross departmental technology skill gaps analysis chart introduction pdf. This layout presents information on cross departmental technology skill gaps analysis chart. It is also available for immediate download and adjustment. So, changes can be made in the color, design, graphics or any other component to create a unique layout.
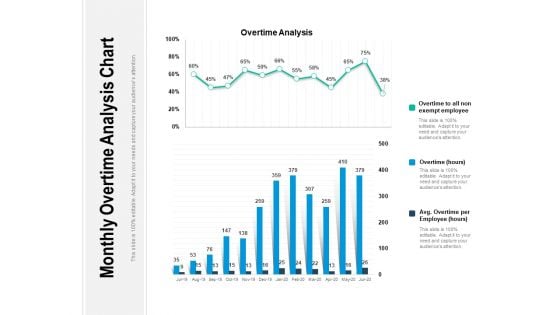
Monthly Overtime Analysis Chart Ppt PowerPoint Presentation File Infographics PDF
Showcasing this set of slides titled monthly overtime analysis chart ppt powerpoint presentation file infographics pdf. The topics addressed in these templates are analysis, employee, overtime. All the content presented in this PPT design is completely editable. Download it and make adjustments in color, background, font etc. as per your unique business setting.
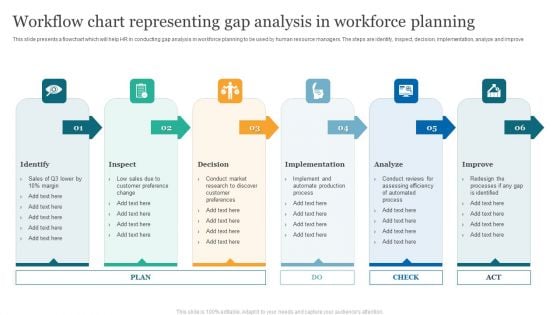
Workflow Chart Representing Gap Analysis In Workforce Planning Formats PDF
This slide presents a flowchart which will help HR in conducting gap analysis in workforce planning to be used by human resource managers. The steps are identify, inspect, decision, implementation, analyze and improve. Persuade your audience using this Workflow Chart Representing Gap Analysis In Workforce Planning Formats PDF. This PPT design covers Six stages, thus making it a great tool to use. It also caters to a variety of topics including Identify, Inspect, Decision. Download this PPT design now to present a convincing pitch that not only emphasizes the topic but also showcases your presentation skills.
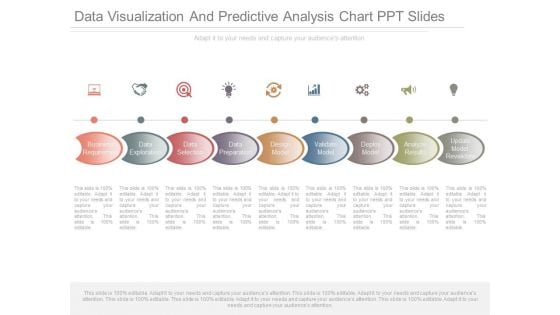
Data Visualization And Predictive Analysis Chart Ppt Slides
This is a data visualization and predictive analysis chart ppt slides. This is a nine stage process. The stages in this process are business requirement, data exploration, data selection, data preparation, design model, validate model, deploy model, analyze results, update model, revalidate.
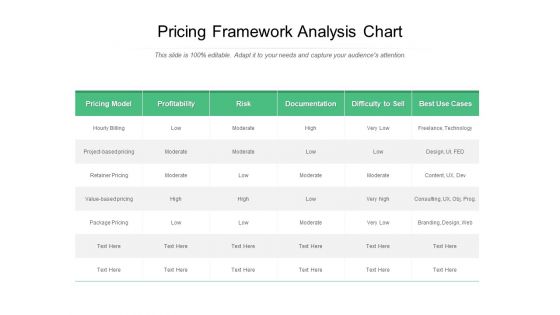
Pricing Framework Analysis Chart Ppt PowerPoint Presentation Summary Demonstration PDF
Pitch your topic with ease and precision using this pricing framework analysis chart ppt powerpoint presentation summary demonstration pdf. This layout presents information on pricing model, profitability, risk, documentation, difficulty to sell, best use cases. It is also available for immediate download and adjustment. So, changes can be made in the color, design, graphics or any other component to create a unique layout.
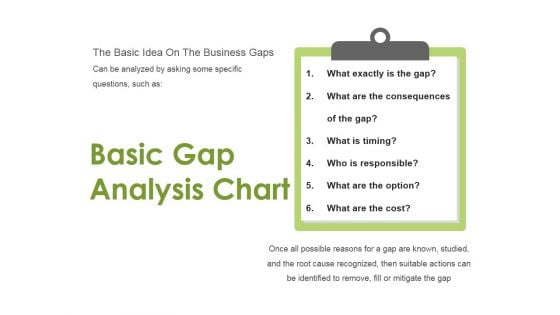
Basic Gap Analysis Chart Ppt Powerpoint Presentation Ideas File Formats
This is a basic gap analysis chart ppt powerpoint presentation ideas file formats. This is a six stage process. The stages in this process are what exactly is the gap, what are the consequences of the gap, what is timing, who is responsible.
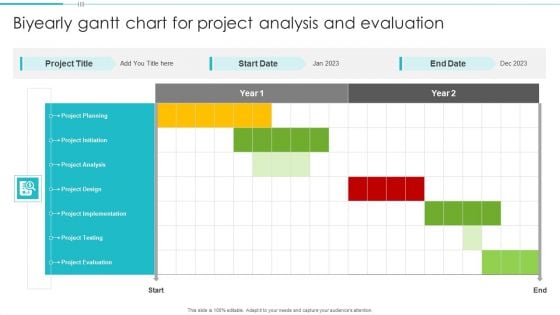
Biyearly Gantt Chart For Project Analysis And Evaluation Structure PDF
Showcasing this set of slides titled Biyearly Gantt Chart For Project Analysis And Evaluation Structure PDF. The topics addressed in these templates are Project Planning, Project Design, Project Implementation. All the content presented in this PPT design is completely editable. Download it and make adjustments in color, background, font etc. as per your unique business setting.
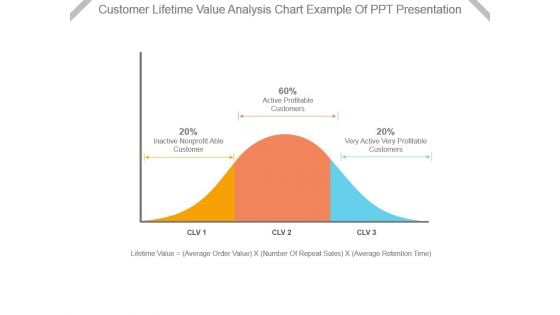
Customer Lifetime Value Analysis Chart Example Of Ppt Presentation
This is a customer lifetime value analysis chart example of ppt presentation. This is a three stage process. The stages in this process are inactive nonprofit able customer, active profitable customers, very active very profitable customers, lifetime value, average order value, number of repeat sales, average retention time.
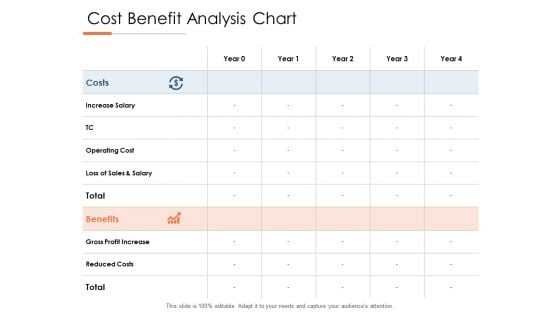
Cost Benefit Analysis Chart Ppt PowerPoint Presentation Summary Graphics Example
Presenting this set of slides with name cost benefit analysis chart ppt powerpoint presentation summary graphics example. The topics discussed in these slides are increase salary, operating cost, loss of sales and salary, gross profit increase, reduced costs. This is a completely editable PowerPoint presentation and is available for immediate download. Download now and impress your audience.
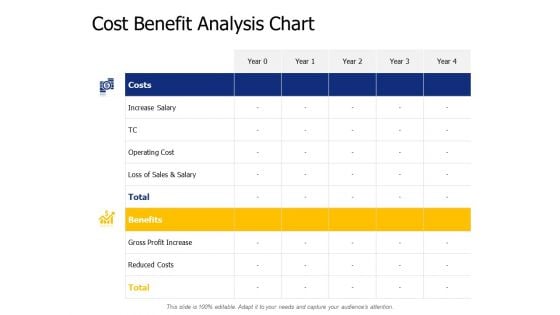
Cost Benefit Analysis Chart Ppt PowerPoint Presentation Portfolio Aids
Presenting this set of slides with name cost benefit analysis chart ppt powerpoint presentation portfolio aids. The topics discussed in these slides are increase salary, operating cost, loss sales and salary, benefits, gross profit increase. This is a completely editable PowerPoint presentation and is available for immediate download. Download now and impress your audience.
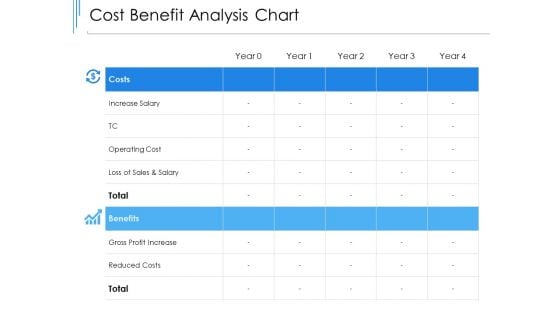
Cost Benefit Analysis Chart Ppt PowerPoint Presentation Gallery Example Introduction
Presenting this set of slides with name cost benefit analysis chart ppt powerpoint presentation gallery example introduction. The topics discussed in these slides are increase salary, operating cost, loss sales and salary, benefits, gross profit increase. This is a completely editable PowerPoint presentation and is available for immediate download. Download now and impress your audience.
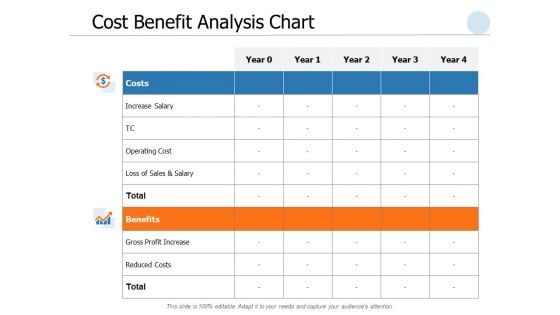
Cost Benefit Analysis Chart Ppt PowerPoint Presentation Gallery File Formats
Presenting this set of slides with name cost benefit analysis chart ppt powerpoint presentation gallery file formats. The topics discussed in these slides are operating cost, loss sales and salary, gross profit increase, reduced costs. This is a completely editable PowerPoint presentation and is available for immediate download. Download now and impress your audience.
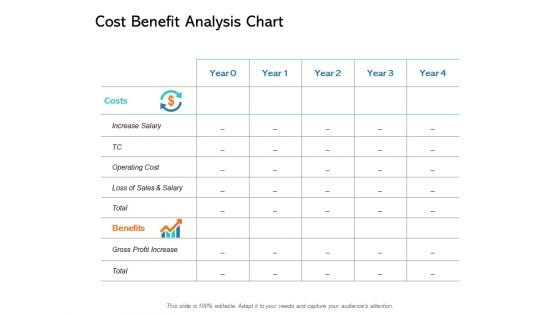
Cost Benefit Analysis Chart Ppt PowerPoint Presentation File Backgrounds
Presenting this set of slides with name cost benefit analysis chart ppt powerpoint presentation file backgrounds. The topics discussed in these slides are increase salary, operating cost, loss sales and salary, benefits, gross profit increase. This is a completely editable PowerPoint presentation and is available for immediate download. Download now and impress your audience.
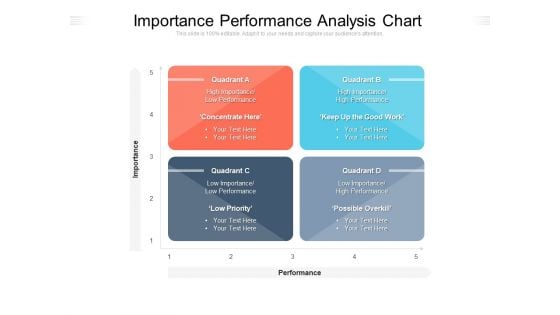
Importance Performance Analysis Chart Ppt PowerPoint Presentation Gallery Examples PDF
Presenting this set of slides with name importance performance analysis chart ppt powerpoint presentation gallery examples pdf. This is a four stage process. The stages in this process are performance, priority, quadrant. This is a completely editable PowerPoint presentation and is available for immediate download. Download now and impress your audience.
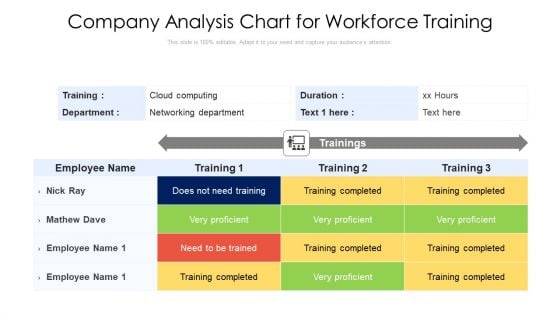
Company Analysis Chart For Workforce Training Ppt Infographics Show PDF
Showcasing this set of slides titled company analysis chart for workforce training ppt infographics show pdf. The topics addressed in these templates are cloud computing, duration, employee. All the content presented in this PPT design is completely editable. Download it and make adjustments in color, background, font etc. as per your unique business setting.
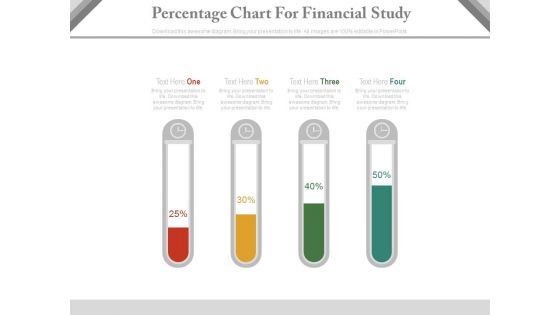
Test Tubes Percentage Chart For Financial Analysis Powerpoint Slides
This PPT slide contains test tubes percentage chart. You may download this PowerPoint template for financial analysis in your presentations. Make outstanding business presentation with this template.

 Home
Home