Chart Analysis
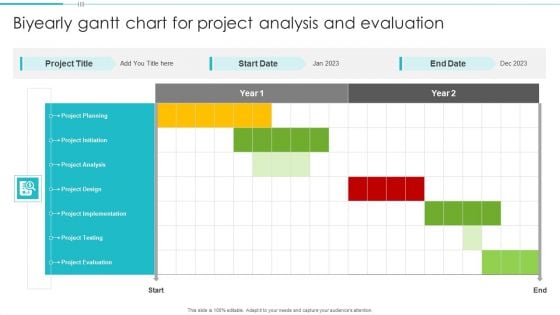
Biyearly Gantt Chart For Project Analysis And Evaluation Structure PDF
Showcasing this set of slides titled Biyearly Gantt Chart For Project Analysis And Evaluation Structure PDF. The topics addressed in these templates are Project Planning, Project Design, Project Implementation. All the content presented in this PPT design is completely editable. Download it and make adjustments in color, background, font etc. as per your unique business setting.
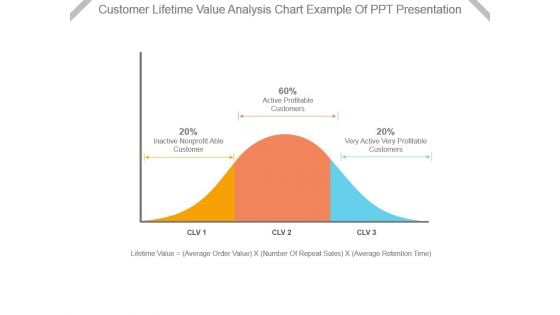
Customer Lifetime Value Analysis Chart Example Of Ppt Presentation
This is a customer lifetime value analysis chart example of ppt presentation. This is a three stage process. The stages in this process are inactive nonprofit able customer, active profitable customers, very active very profitable customers, lifetime value, average order value, number of repeat sales, average retention time.
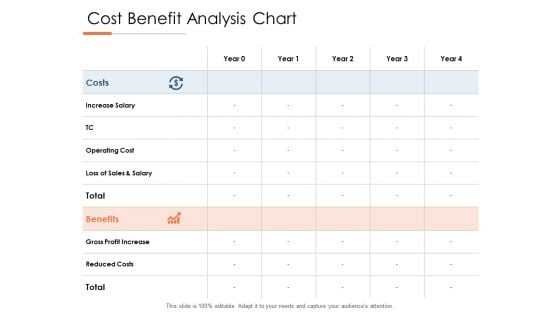
Cost Benefit Analysis Chart Ppt PowerPoint Presentation Summary Graphics Example
Presenting this set of slides with name cost benefit analysis chart ppt powerpoint presentation summary graphics example. The topics discussed in these slides are increase salary, operating cost, loss of sales and salary, gross profit increase, reduced costs. This is a completely editable PowerPoint presentation and is available for immediate download. Download now and impress your audience.
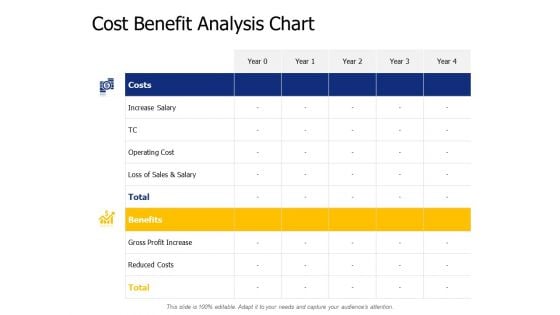
Cost Benefit Analysis Chart Ppt PowerPoint Presentation Portfolio Aids
Presenting this set of slides with name cost benefit analysis chart ppt powerpoint presentation portfolio aids. The topics discussed in these slides are increase salary, operating cost, loss sales and salary, benefits, gross profit increase. This is a completely editable PowerPoint presentation and is available for immediate download. Download now and impress your audience.
Cost Benefit Analysis Chart Ppt PowerPoint Presentation Gallery Example Introduction
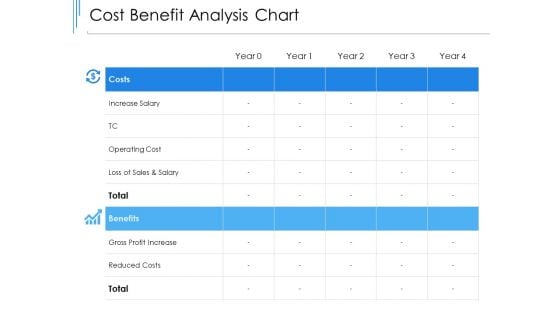
Presenting this set of slides with name cost benefit analysis chart ppt powerpoint presentation gallery example introduction. The topics discussed in these slides are increase salary, operating cost, loss sales and salary, benefits, gross profit increase. This is a completely editable PowerPoint presentation and is available for immediate download. Download now and impress your audience.
Cost Benefit Analysis Chart Ppt PowerPoint Presentation Gallery File Formats
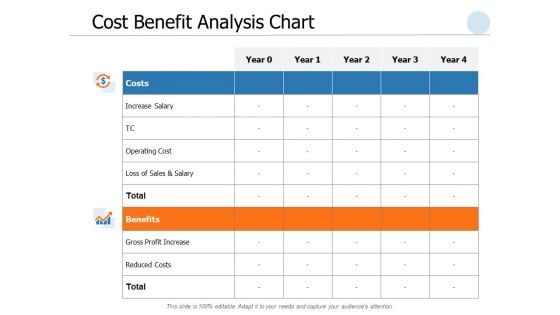
Presenting this set of slides with name cost benefit analysis chart ppt powerpoint presentation gallery file formats. The topics discussed in these slides are operating cost, loss sales and salary, gross profit increase, reduced costs. This is a completely editable PowerPoint presentation and is available for immediate download. Download now and impress your audience.
Cost Benefit Analysis Chart Ppt PowerPoint Presentation File Backgrounds
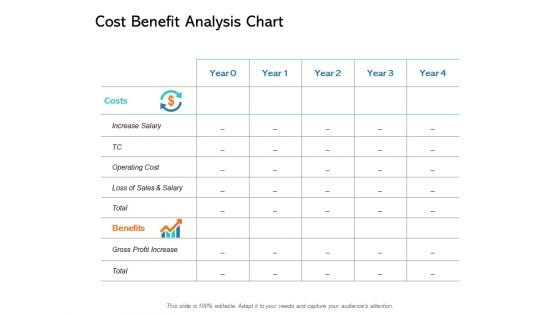
Presenting this set of slides with name cost benefit analysis chart ppt powerpoint presentation file backgrounds. The topics discussed in these slides are increase salary, operating cost, loss sales and salary, benefits, gross profit increase. This is a completely editable PowerPoint presentation and is available for immediate download. Download now and impress your audience.
Importance Performance Analysis Chart Ppt PowerPoint Presentation Gallery Examples PDF
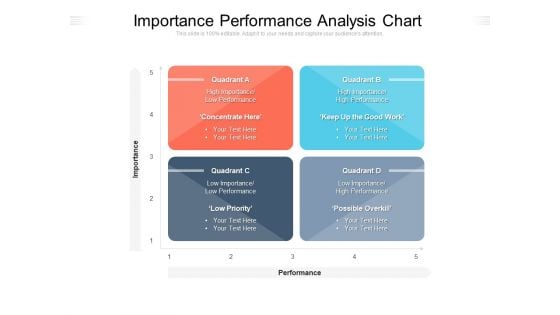
Presenting this set of slides with name importance performance analysis chart ppt powerpoint presentation gallery examples pdf. This is a four stage process. The stages in this process are performance, priority, quadrant. This is a completely editable PowerPoint presentation and is available for immediate download. Download now and impress your audience.
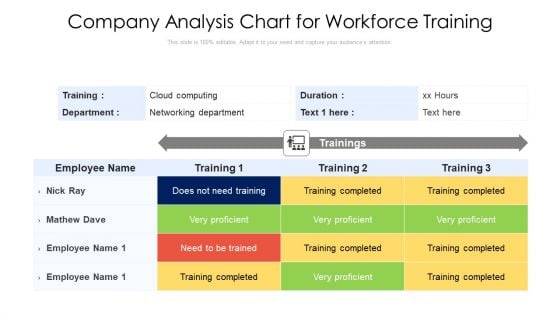
Company Analysis Chart For Workforce Training Ppt Infographics Show PDF
Showcasing this set of slides titled company analysis chart for workforce training ppt infographics show pdf. The topics addressed in these templates are cloud computing, duration, employee. All the content presented in this PPT design is completely editable. Download it and make adjustments in color, background, font etc. as per your unique business setting.
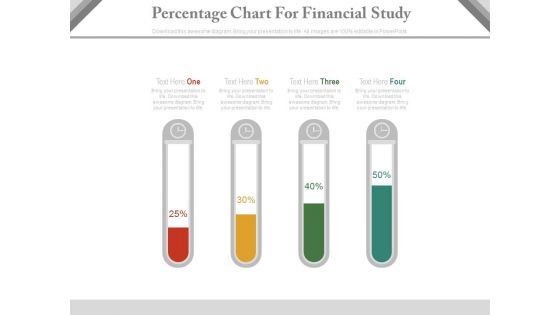
Test Tubes Percentage Chart For Financial Analysis Powerpoint Slides
This PPT slide contains test tubes percentage chart. You may download this PowerPoint template for financial analysis in your presentations. Make outstanding business presentation with this template.
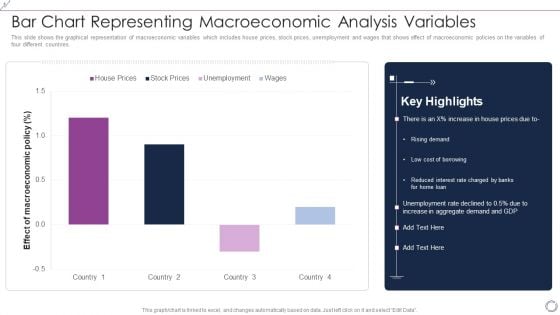
Bar Chart Representing Macroeconomic Analysis Variables Background PDF
This slide shows the graphical representation of macroeconomic variables which includes house prices, stock prices, unemployment and wages that shows effect of macroeconomic policies on the variables of four different countries. Showcasing this set of slides titled Bar Chart Representing Macroeconomic Analysis Variables Background PDF. The topics addressed in these templates are House Prices, Stock Prices, Unemployment, Wages. All the content presented in this PPT design is completely editable. Download it and make adjustments in color, background, font etc. as per your unique business setting.
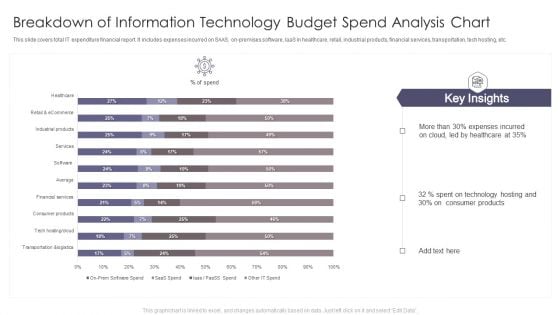
Breakdown Of Information Technology Budget Spend Analysis Chart Download PDF
This slide covers total IT expenditure financial report. It includes expenses incurred on SAAS, on-premises software, laaS in healthcare, retail, industrial products, financial services, transportation, tech hosting, etc. Pitch your topic with ease and precision using this Breakdown Of Information Technology Budget Spend Analysis Chart Download PDF. This layout presents information on Expenses Incurred, Technology Hosting, Consumer Products. It is also available for immediate download and adjustment. So, changes can be made in the color, design, graphics or any other component to create a unique layout.
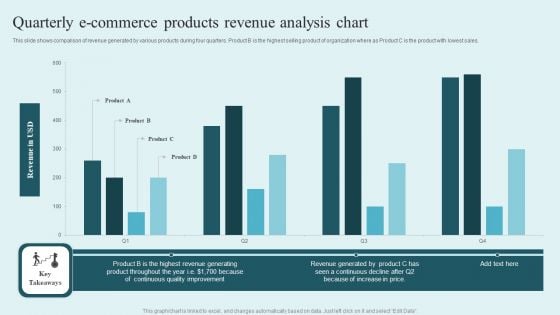
Quarterly E Commerce Products Revenue Analysis Chart Guidelines PDF
This slide shows comparison of revenue generated by various products during four quarters. Product B is the highest selling product of organization where as Product C is the product with lowest sales. Showcasing this set of slides titled Quarterly E Commerce Products Revenue Analysis Chart Guidelines PDF. The topics addressed in these templates are Revenue USD, Product, Continuous Quality Improvement. All the content presented in this PPT design is completely editable. Download it and make adjustments in color, background, font etc. as per your unique business setting.
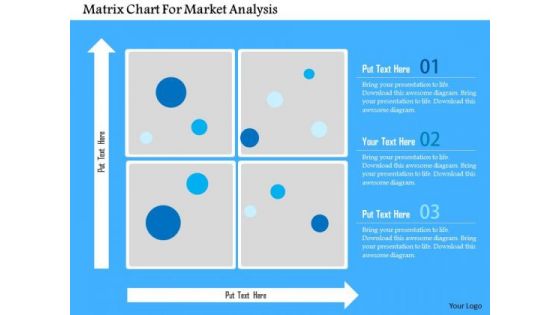
Business Diagram Matrix Chart For Market Analysis Presentation Template
This slide has been designed with graphics of matrix chart. This diagram is suitable to present market analysis. This professional slide helps in making an instant impact on viewers.
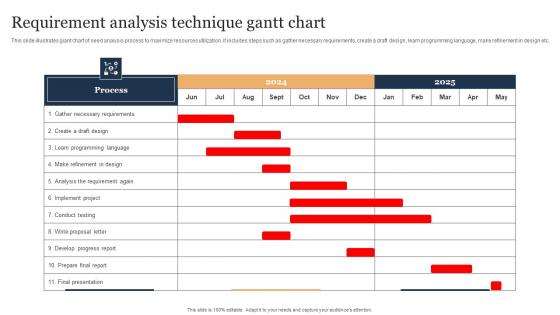
Requirement Analysis Technique Gantt Chart Guidelines Pdf
This slide illustrates giant chart of need analysis process to maximize resources utilization. It includes steps such as gather necessary requirements, create a draft design, learn programming language, make refinement in design etc. Pitch your topic with ease and precision using this Requirement Analysis Technique Gantt Chart Guidelines Pdf. This layout presents information on Requirement Analysis Technique, Resources Utilization, Learn Programming Language. It is also available for immediate download and adjustment. So, changes can be made in the color, design, graphics or any other component to create a unique layout. This slide illustrates giant chart of need analysis process to maximize resources utilization. It includes steps such as gather necessary requirements, create a draft design, learn programming language, make refinement in design etc.
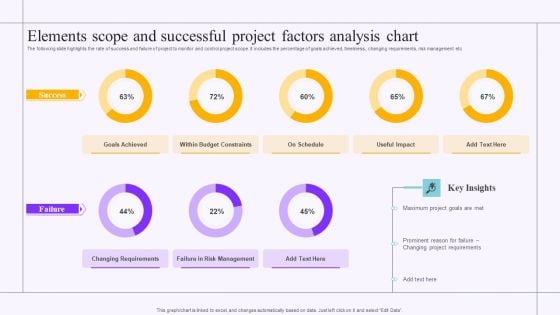
Elements Scope And Successful Project Factors Analysis Chart Sample PDF
The following slide highlights the rate of success and failure of project to monitor and control project scope. It includes the percentage of goals achieved, timeliness, changing requirements, risk management etc. Showcasing this set of slides titled Elements Scope And Successful Project Factors Analysis Chart Sample PDF. The topics addressed in these templates are Goals Achieved, Budget Constraints, Project Requirements. All the content presented in this PPT design is completely editable. Download it and make adjustments in color, background, font etc. as per your unique business setting.
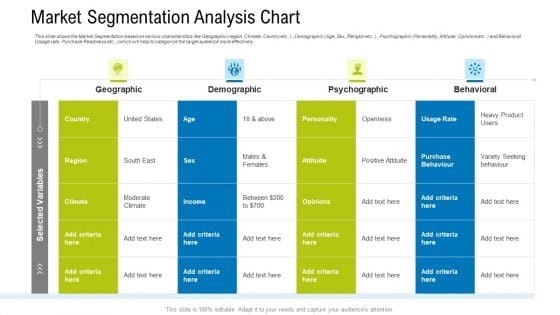
Market Segmentation Analysis Chart Ppt Infographic Template Graphic Tips PDF
This slide shows the Market Segmentation based on various characteristics like Geographic region, Climate, Country etc. , Demographic Age, Sex, Religion etc., Psychographic Personality, Attitude, Opinions etc. and Behavioral Usage rate, Purchase Readiness etc. which will help to categorize the target audience more effectively Deliver and pitch your topic in the best possible manner with this market segmentation analysis chart ppt infographic template graphic tips pdf. Use them to share invaluable insights on geographic, demographic, psychographic, behavioral and impress your audience. This template can be altered and modified as per your expectations. So, grab it now.
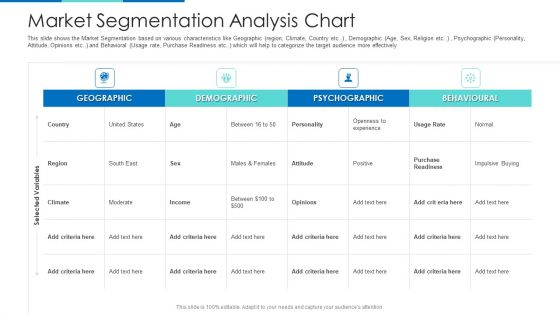
Market Segmentation Analysis Chart Ppt Show Designs PDF
This slide shows the Market Segmentation based on various characteristics like Geographic region, Climate, Country etc. Demographic Age, Sex, Religion etc. Psychographic Personality, Attitude, Opinions etc. and Behavioral Usage rate, Purchase Readiness etc which will help to categorize the target audience more effectively Deliver an awe-inspiring pitch with this creative market segmentation analysis chart ppt show designs pdf. bundle. Topics like geographic, demographic, psychographic, behavioural can be discussed with this completely editable template. It is available for immediate download depending on the needs and requirements of the user.
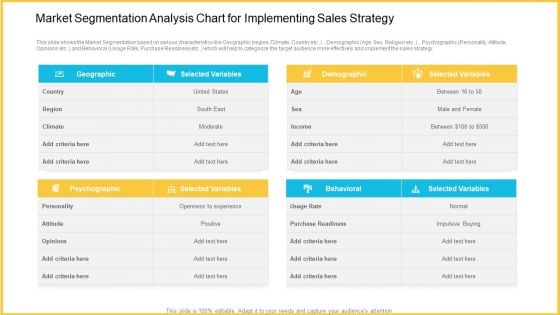
Market Segmentation Analysis Chart For Implementing Sales Strategy Clipart PDF
This slide shows the Market Segmentation based on various characteristics like Geographic region, Climate, Country etc , Demographic Age, Sex, Religion etc , Psychographic Personality, Attitude, Opinions etc and Behavioral Usage Rate, Purchase Readiness etc which will help to categorize the target audience more effectively and implement the sales strategy. Deliver an awe-inspiring pitch with this creative market segmentation analysis chart for implementing sales strategy clipart pdf. bundle. Topics like geographic, psychographic, selected variables, behavioral, selected variables, demographic can be discussed with this completely editable template. It is available for immediate download depending on the needs and requirements of the user.
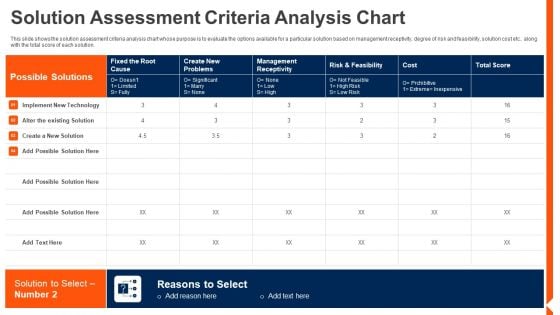
Solution Monitoring Verification Solution Assessment Criteria Analysis Chart Template PDF
This slide shows the overview and some details of the fifth task in solution assessment and validation process i.e. Validate Solution such as purpose of validating solution, process inputs and output description, elements, stakeholder details and validate solution model. Deliver an awe inspiring pitch with this creative solution monitoring verification solution assessment criteria analysis chart template pdf bundle. Topics like process, output, elements can be discussed with this completely editable template. It is available for immediate download depending on the needs and requirements of the user.
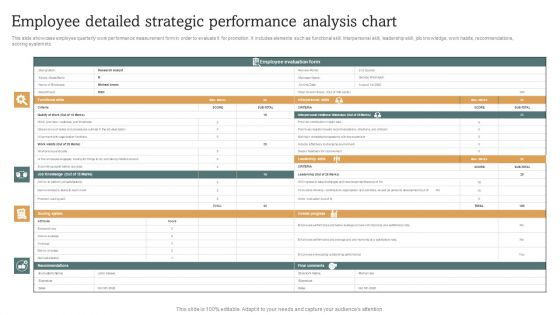
Employee Detailed Strategic Performance Analysis Chart Elements PDF
This slide showcase employee quarterly work performance measurement form in order to evaluate it for promotion. It includes elements such as functional skill. Interpersonal skill, leadership skill, job knowledge, work habits, recommendations, scoring system etc. Showcasing this set of slides titled Employee Detailed Strategic Performance Analysis Chart Elements PDF. The topics addressed in these templates are Employee Evaluation, Interpersonal Skills, Leadership Skills. All the content presented in this PPT design is completely editable. Download it and make adjustments in color, background, font etc. as per your unique business setting.
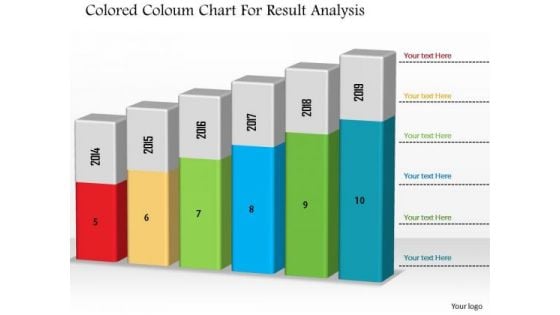
Business Diagram Colored Column Chart For Result Analysis PowerPoint Slide
This Power Point diagram has been designed with graphic of column chart. It contains diagram of bar char depicting annual business progress report. Use this diagram to build professional presentations for your viewers.
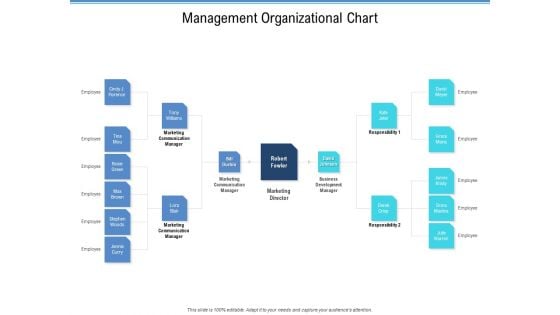
Enterprise Analysis Management Organizational Chart Elements PDF
Deliver and pitch your topic in the best possible manner with this enterprise analysis management organizational chart elements pdf. Use them to share invaluable insights on marketing communication manager, business development manager, marketing director and impress your audience. This template can be altered and modified as per your expectations. So, grab it now.
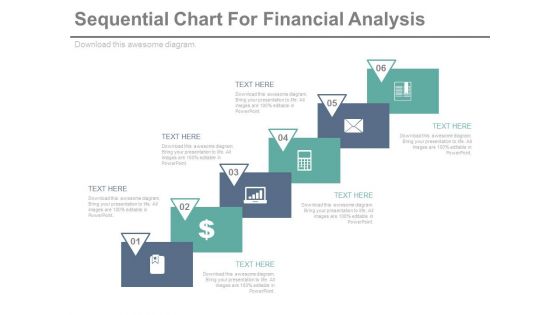
Sequential Steps Chart For Data Analysis Powerpoint Slides
This PowerPoint template has been designed sequential steps chart with icons. This PPT slide can be used to display corporate level financial strategy. You can download finance PowerPoint template to prepare awesome presentations.
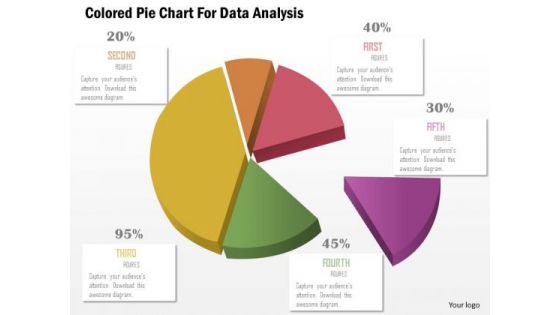
Business Diagram Colored Pie Chart For Data Analysis Presentation Template
This business slide displays pie chart. This diagram is a data visualization tool that gives you a simple way to present statistical information. This slide helps your audience examine and interpret the data you present.
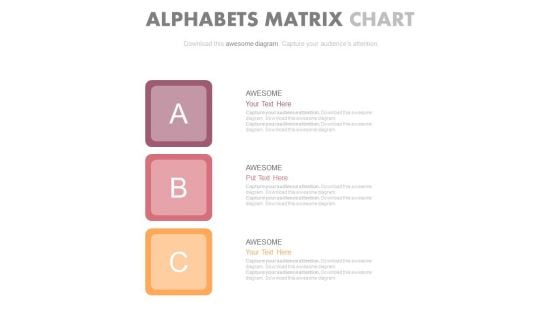
Abc Steps Chart For Data Analysis Powerpoint Slides
Our above PPT slide contains graphics of ABC steps chart. This business diagram helps to depict business information for strategic management. Use this diagram to impart more clarity to data and to create more sound impact on viewers.
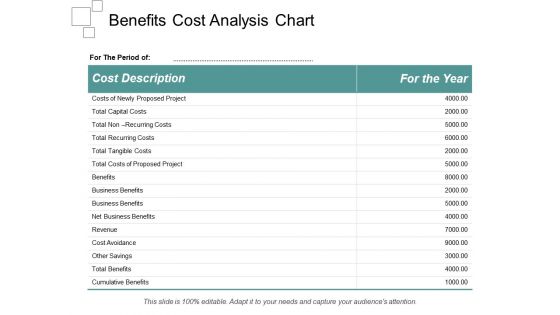
Benefits Cost Analysis Chart Ppt Powerpoint Presentation Summary Visuals
This is a balance scale with cost and benefits ppt powerpoint presentation show. This is a two stage process. The stages in this process are business, finance, marketing, strategy, compare, management.
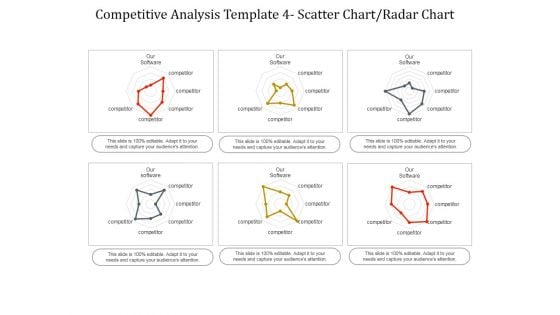
Competitive Analysis Scatter Chart Radar Chart Ppt PowerPoint Presentation Infographics
This is a competitive analysis scatter chart radar chart ppt powerpoint presentation infographics. This is a eight stage process. The stages in this process are users interface, data import, example, pricing, support, update, tutorials, easy to use.
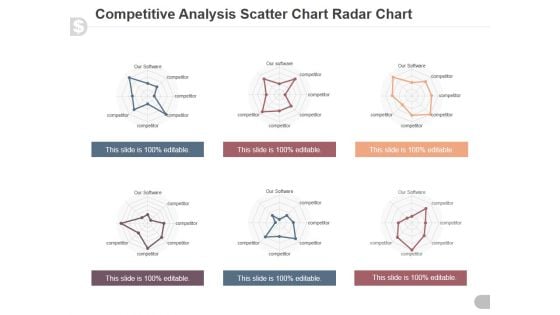
Competitive Analysis Scatter Chart Radar Chart Ppt PowerPoint Presentation Model
This is a competitive analysis scatter chart radar chart ppt powerpoint presentation model. This is a eight stage process. The stages in this process are users interface, data import, example, pricing, support, update, tutorials, easy to use.
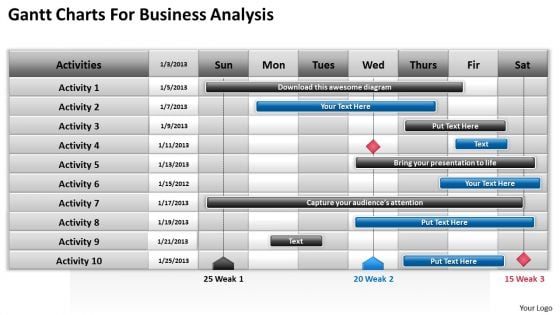
Consulting PowerPoint Template Gantt Charts For Business Analysis Ppt Templates
Be the dramatist with our consulting PowerPoint template gantt charts for business analysis ppt templates. Script out the play of words. Put our Competition PowerPoint Templates into the draw. Your thoughts will win the lottery. Add some dramatization to your thoughts. Our Org Charts PowerPoint Templates make useful props. Adorn your thoughts with our Consulting PowerPoint Template Gantt Charts For Business Analysis Ppt Templates. They will always remain in fashion.
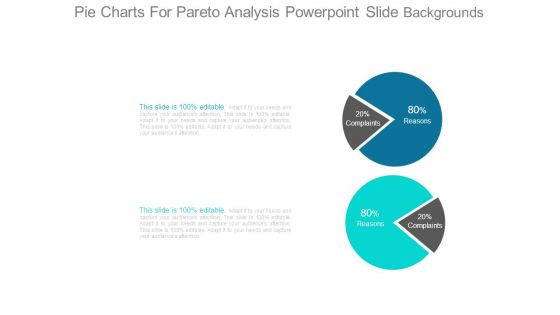
Pie Charts For Pareto Analysis Powerpoint Slide Backgrounds
This is a pie charts for pareto analysis powerpoint slide backgrounds. This is a two stage process. The stages in this process are reasons, complaints.
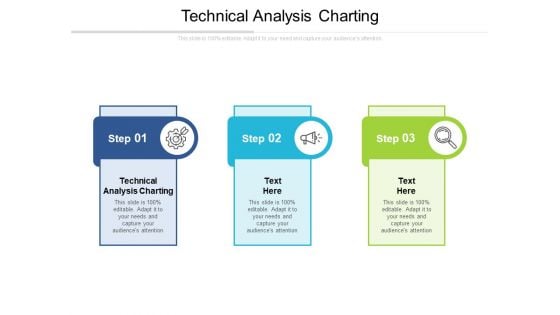
Technical Analysis Charting Ppt PowerPoint Presentation Gallery Microsoft Cpb
Presenting this set of slides with name technical analysis charting ppt powerpoint presentation gallery microsoft cpb. This is an editable Powerpoint three stages graphic that deals with topics like technical analysis charting to help convey your message better graphically. This product is a premium product available for immediate download and is 100 percent editable in Powerpoint. Download this now and use it in your presentations to impress your audience.
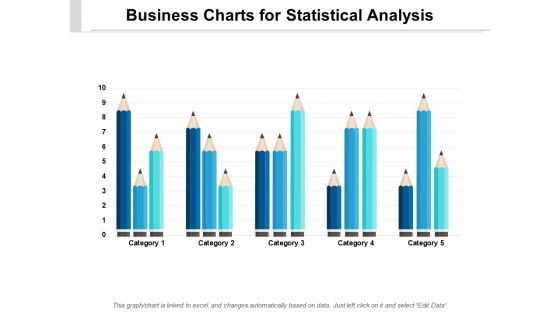
Business Charts For Statistical Analysis Ppt PowerPoint Presentation Pictures Gridlines
Presenting this set of slides with name business charts for statistical analysis ppt powerpoint presentation pictures gridlines. The topics discussed in these slides are education, growth, pencil bar graph. This is a completely editable PowerPoint presentation and is available for immediate download. Download now and impress your audience.
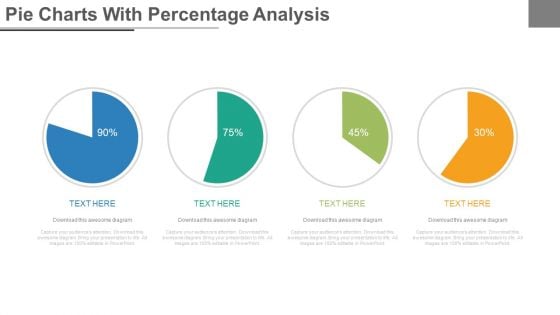
Four Steps Pie Charts For Financial Analysis Powerpoint Slides
Four pie charts have been displayed in this business slide. This PowerPoint template helps to exhibit financial ratio analysis. Use this diagram slide to build an exclusive presentation.
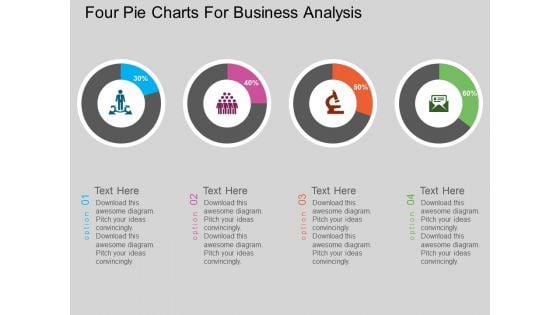
Four Pie Charts For Business Analysis Powerpoint Template
This PowerPoint template has been designed with graphics of four pie charts This diagram can be used to display financial planning and business analysis. Capture the attention of your audience with this slide.
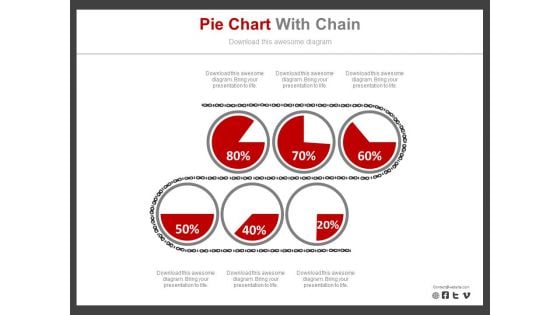
Six Pie Charts For Revenue Analysis Report Powerpoint Slides
Six pie charts have been displayed in this business slide. This business diagram helps to exhibit revenue analysis report. Download this PowerPoint template to build an exclusive presentation.
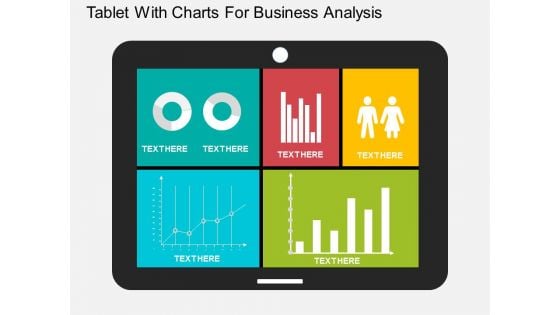
Tablet With Charts For Business Analysis Powerpoint Templates
Our compelling template consists with a design of four gear tags and icons. This slide has been professionally designed to exhibit process control. This template offers an excellent background to build impressive presentation.
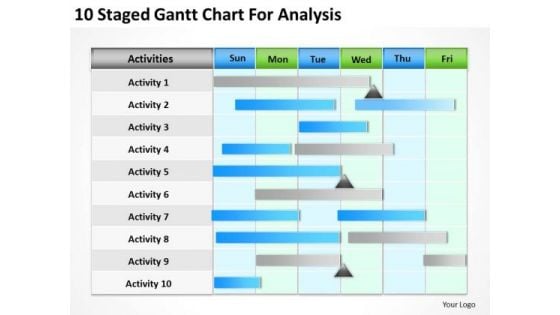
Business PowerPoint Template 10 Staged Gantt Chart For Analysis Ppt Slides
Do the done thing with your thoughts. Uphold custom with our Business powerpoint template 10 staged gantt chart for analysis ppt Slides. Be a donor of great ideas. Display your charity on our Competition PowerPoint Templates. Make a donation of your ideas. Our Advertising PowerPoint Templates will convey your charitable attitude. Display leadership with our Business PowerPoint Template 10 Staged Gantt Chart For Analysis Ppt Slides. Download without worries with our money back guaranteee.
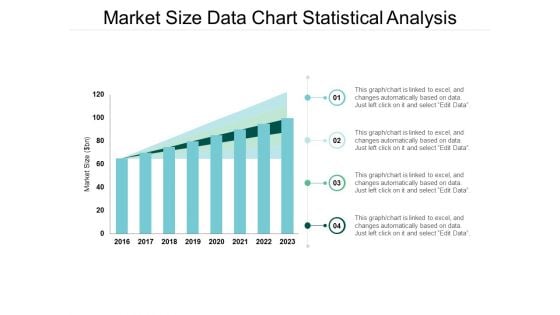
Market Size Data Chart Statistical Analysis Ppt Powerpoint Presentation Model Format
This is a market size data chart statistical analysis ppt powerpoint presentation model format. The topics discussed in this diagram are market growth, market opportunity, market profitability. This is a completely editable PowerPoint presentation, and is available for immediate download.
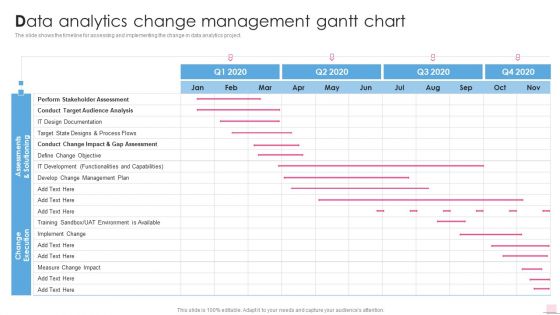
Data Analytics Change Management Gantt Chart Business Analysis Modification Toolkit Portrait PDF
Deliver an awe inspiring pitch with this creative Data Analytics Change Management Gantt Chart Business Analysis Modification Toolkit Portrait PDF bundle. Topics like Functionalities Capabilities, Environment Available, Implement Change can be discussed with this completely editable template. It is available for immediate download depending on the needs and requirements of the user.

Business Diagram Data Driven Bar Graph And Pie Chart For Analysis PowerPoint Slide
This PowerPoint template displays technology gadgets with various business charts. Use this diagram slide, in your presentations to make business reports for statistical analysis. You may use this diagram to impart professional appearance to your presentations.
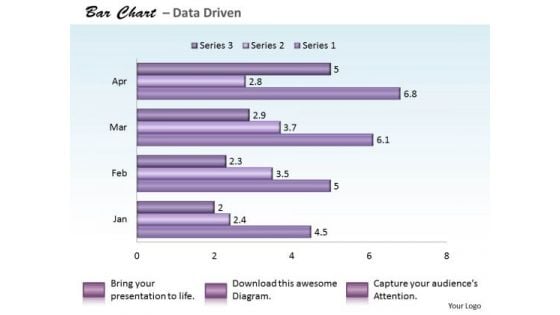
Quantitative Data Analysis Bar Chart For PowerPoint Templates
Reduce The Drag With Our quantitative data analysis bar chart for Powerpoint Templates . Give More Lift To Your Thoughts.
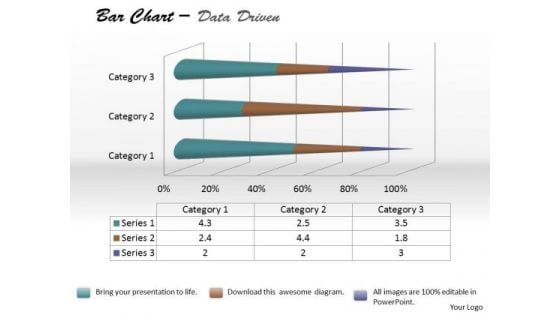
Data Analysis Bar Chart For Foreign Trade PowerPoint Templates
Be The Doer With Our data analysis bar chart for foreign trade Powerpoint Templates. Put Your Thoughts Into Practice.
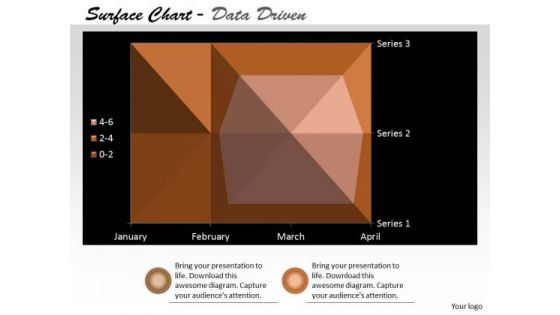
Multivariate Data Analysis Surface Chart Plots Trends PowerPoint Templates
Our multivariate data analysis surface chart plots trends Powerpoint Templates Heighten Concentration. Your Audience Will Be On The Edge.
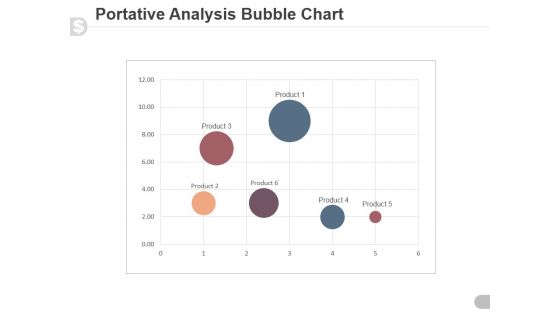
Portative Analysis Bubble Chart Ppt PowerPoint Presentation Slide
This is a portative analysis bubble chart ppt powerpoint presentation slide. This is a six stage process. The stages in this process are portative, analysis, business, graph, bubble chart.
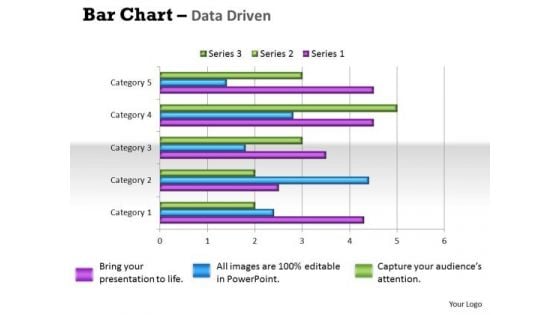
Quantitative Data Analysis Bar Chart For Different Categories PowerPoint Templates
Make Some Dough With Our quantitative data analysis bar chart for different categories Powerpoint Templates . Your Assets Will Rise Significantly.
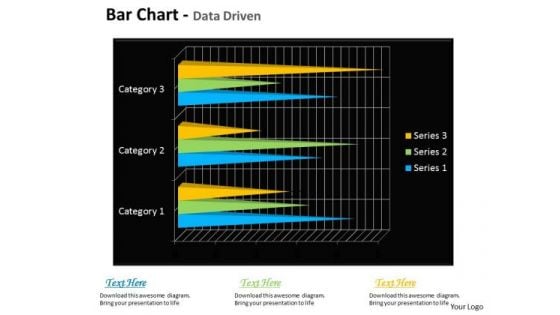
Quantitative Data Analysis Bar Chart For Financial Markets PowerPoint Templates
Draft It Out On Our quantitative data analysis bar chart for financial markets Powerpoint Templates . Give The Final Touches With Your Ideas.
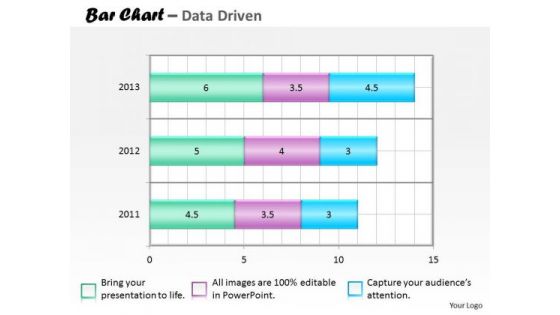
Financial Data Analysis Bar Chart For Collection Of PowerPoint Templates
Our financial data analysis bar chart for collection of Powerpoint Templates Team Are A Dogged Lot. They Keep At It Till They Get It Right.

Microsoft Excel Data Analysis Bar Chart To Handle PowerPoint Templates
Our microsoft excel data analysis bar chart to handle Powerpoint Templates And Your Ideas Make A Great Doubles Pair. Play The Net With Assured Hands.
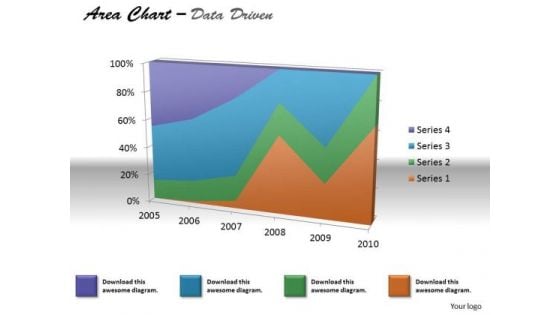
Financial Data Analysis Area Chart For Various Values PowerPoint Templates
Document The Process On Our financial data analysis area chart for various values Powerpoint Templates . Make A Record Of Every Detail.
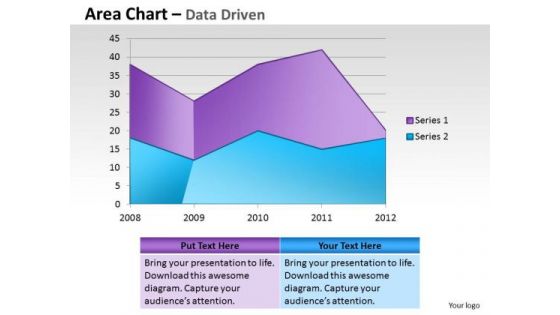
Financial Data Analysis Area Chart For Showing Trends PowerPoint Templates
Document Your Views On Our financial data analysis area chart for showing trends Powerpoint Templates . They Will Create A Strong Impression.
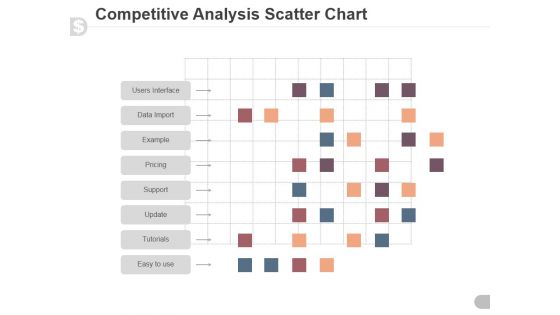
Competitive Analysis Scatter Chart Ppt PowerPoint Presentation Samples
This is a competitive analysis scatter chart ppt powerpoint presentation samples. This is a six stage process. The stages in this process are competitive, analysis, business, marketing, management.
Pre And Post Report Analysis Bar Chart Icon Pictures PDF
Showcasing this set of slides titled Pre And Post Report Analysis Bar Chart Icon Pictures PDF. The topics addressed in these templates are Pre And Post Report Analysis, Bar Chart Icon. All the content presented in this PPT design is completely editable. Download it and make adjustments in color, background, font etc. as per your unique business setting.
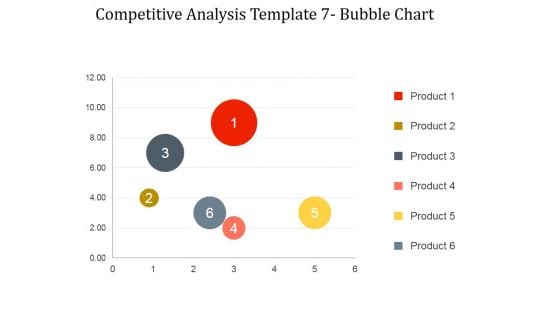
Competitive Analysis Bubble Chart Ppt PowerPoint Presentation Templates
This is a competitive analysis bubble chart ppt powerpoint presentation templates. This is a six stage process. The stages in this process are product, business, management, marketing, strategy.
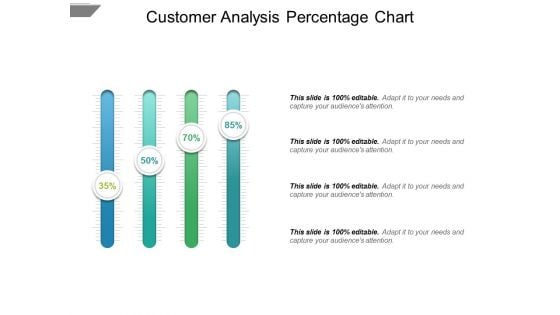
Customer Analysis Percentage Chart Ppt PowerPoint Presentation Infographics Master Slide
This is a customer analysis percentage chart ppt powerpoint presentation infographics master slide. This is a four stage process. The stages in this process are comparison chart, comparison table, comparison matrix.
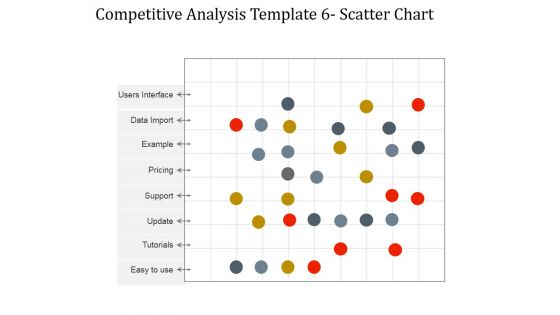
Competitive Analysis Scatter Chart Ppt PowerPoint Presentation Background Designs
This is a competitive analysis scatter chart ppt powerpoint presentation background designs. This is a three stage process. The stages in this process are competitive analysis, business, management, marketing, strategy.
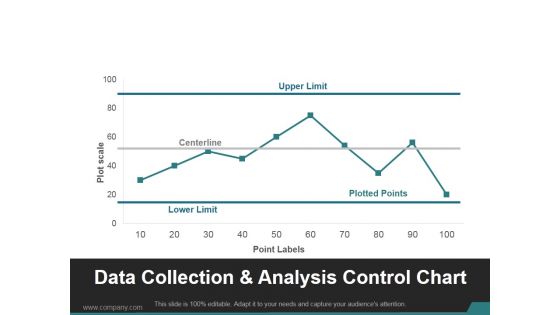
Data Collection And Analysis Control Chart Ppt PowerPoint Presentation Visuals
This is a data collection and analysis control chart ppt powerpoint presentation visuals. This is a ten stage process. The stages in this process are upper limit, centerline, lower limit, plotted points.
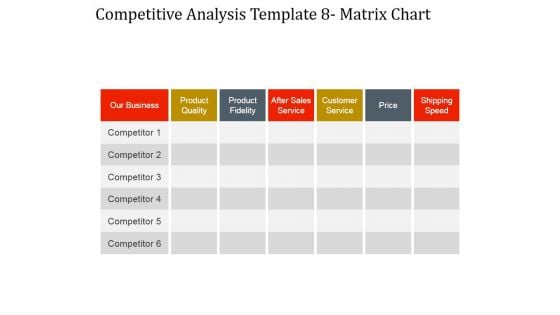
Competitive Analysis Matrix Chart Ppt PowerPoint Presentation Gallery
This is a competitive analysis matrix chart ppt powerpoint presentation gallery. This is a seven stage process. The stages in this process are our business, product quality, product fidelity, after sales service, customer service, price, shipping speed.
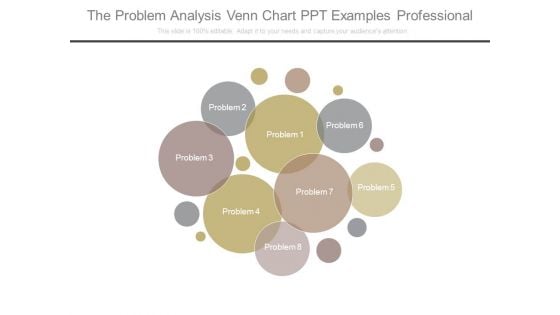
The Problem Analysis Venn Chart Ppt Examples Professional
This is a the problem analysis venn chart ppt examples professional. This is a eight stage process. The stages in this process are business, analysis, marketing, process, strategy.
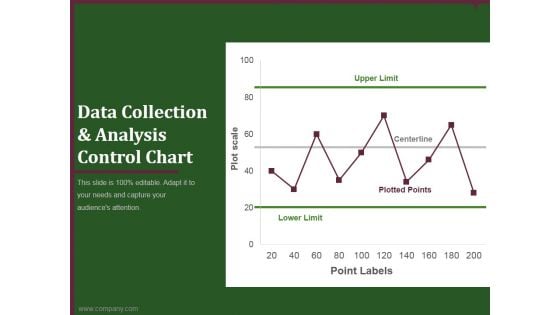
data collection and analysis control chart ppt powerpoint presentation styles
This is a data collection and analysis control chart ppt powerpoint presentation styles. This is a one stage process. The stages in this process are upper limit, centerline, plotted points, lower limit, point labels.

 Home
Home