Comparison Bar Graph
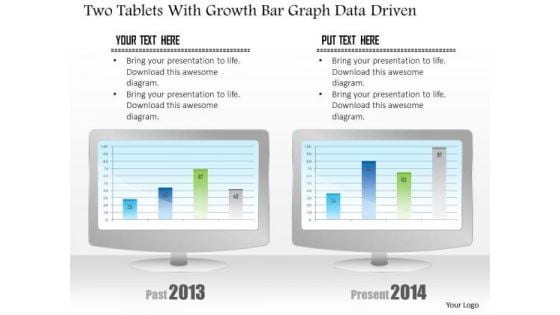
Business Diagram Two Tablets With Growth Bar Graph Data Driven PowerPoint Slide
This business diagram has been designed with comparative charts on tablets. This slide suitable for data representation. You can also use this slide to present business reports and information. Use this diagram to present your views in a wonderful manner.
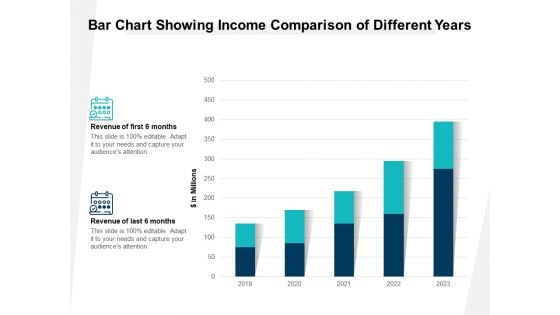
Bar Chart Showing Income Comparison Of Different Years Ppt PowerPoint Presentation Gallery Ideas PDF
Presenting this set of slides with name bar chart showing income comparison of different years ppt powerpoint presentation gallery ideas pdf. The topics discussed in these slides are revenue of first 6 months, revenue of last 6 months. This is a completely editable PowerPoint presentation and is available for immediate download. Download now and impress your audience.
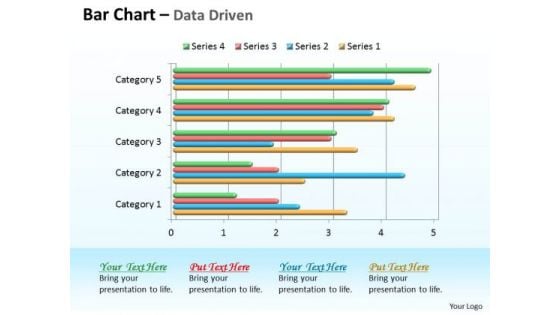
Data Analysis In Excel 3d Bar Chart For Comparison Of Time Series PowerPoint Templates
Double Your Chances With Our data analysis in excel 3d bar chart for comparison of time series Powerpoint Templates . The Value Of Your Thoughts Will Increase Two-Fold.
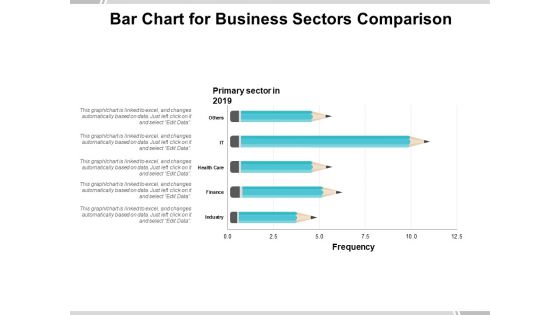
Bar Chart For Business Sectors Comparison Ppt PowerPoint Presentation Professional Guide
Presenting this set of slides with name bar chart for business sectors comparison ppt powerpoint presentation professional guide. The topics discussed in these slides are education, growth, pencil bar graph. This is a completely editable PowerPoint presentation and is available for immediate download. Download now and impress your audience.
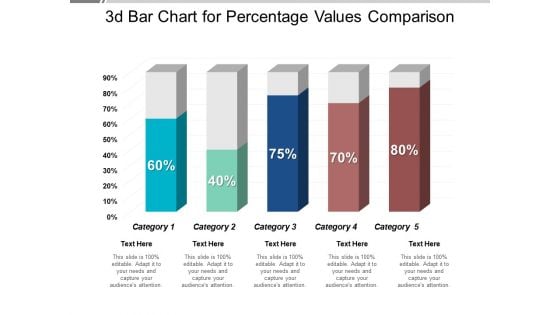
3D Bar Chart For Percentage Values Comparison Ppt PowerPoint Presentation Professional Visual Aids
This is a 3d bar chart for percentage values comparison ppt powerpoint presentation professional visual aids. This is a five stage process. The stages in this process are art, colouring, paint brush.
Vector Showing Statistics Comparison Bar Chart Ppt Visual Aids Styles PDF
Persuade your audience using this Vector Showing Statistics Comparison Bar Chart Ppt Visual Aids Styles PDF. This PPT design covers three stages, thus making it a great tool to use. It also caters to a variety of topics including vector showing statistics comparison bar chart. Download this PPT design now to present a convincing pitch that not only emphasizes the topic but also showcases your presentation skills.
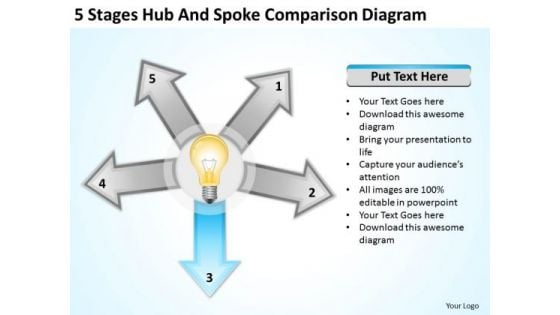
5 Stages Hub And Spoke Comparison Diagram Business Plan For Bar PowerPoint Templates
We present our 5 stages hub and spoke comparison diagram business plan for bar PowerPoint templates.Download our Technology PowerPoint Templates because Our PowerPoint Templates and Slides are created by a hardworking bunch of busybees. Always flitting around with solutions gauranteed to please. Present our Business PowerPoint Templates because Your audience will believe you are the cats whiskers. Download our Process and Flows PowerPoint Templates because You can Create a matrix with our PowerPoint Templates and Slides. Feel the strength of your ideas click into place. Download and present our Marketing PowerPoint Templates because You can Zap them with our PowerPoint Templates and Slides. See them reel under the impact. Use our Arrows PowerPoint Templates because It is Aesthetically crafted by artistic young minds. Our PowerPoint Templates and Slides are designed to display your dexterity.Use these PowerPoint slides for presentations relating to Experiment, spreadsheet, sociology, line chart, conclusion, pie chart, mathematics, innovation, sociological, business, bulb, concept, arrow, presentation, symbol, diagram, social, discovery, process, analysis, report, marketing, intelligent, creative, visualization, mathematical formula, trends, thinking, summary, infographic, exploration, information, conceptual, quantified, exploratory, business. The prominent colors used in the PowerPoint template are Blue, Yellow, White. Approaching the dais can make you anxious. Experience the calmness our 5 Stages Hub And Spoke Comparison Diagram Business Plan For Bar PowerPoint Templates bring.
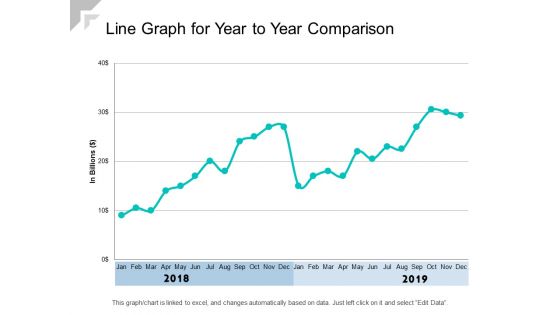
Line Graph For Year To Year Comparison Ppt PowerPoint Presentation Show Graphics Example
Presenting this set of slides with name line graph for year to year comparison ppt powerpoint presentation show graphics example. The topics discussed in these slides are revenue trend, bar chart, financial. This is a completely editable PowerPoint presentation and is available for immediate download. Download now and impress your audience.
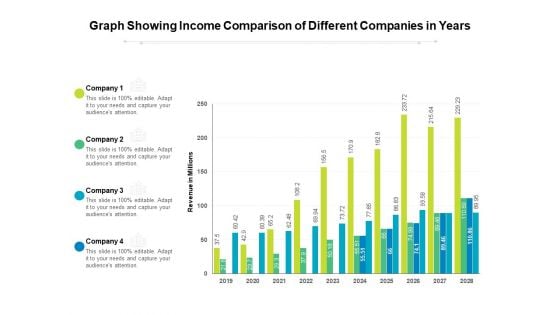
Graph Showing Income Comparison Of Different Companies In Years Ppt PowerPoint Presentation Gallery Clipart PDF
Presenting this set of slides with name graph showing income comparison of different companies in years ppt powerpoint presentation gallery clipart pdf. The topics discussed in these slide is graph showing income comparison of different companies in years. This is a completely editable PowerPoint presentation and is available for immediate download. Download now and impress your audience.
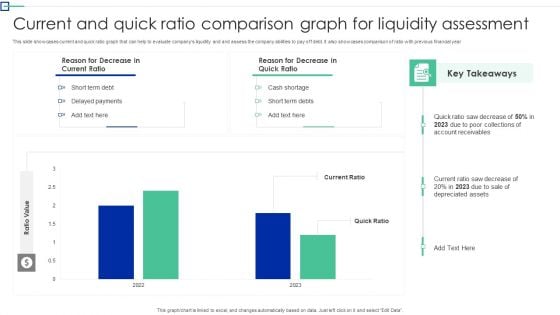
Current And Quick Ratio Comparison Graph For Liquidity Assessment Structure PDF
This slide showcases current and quick ratio graph that can help to evaluate companys liquidity and and assess the company abilities to pay off debt. It also showcases comparison of ratio with previous financial year. Showcasing this set of slides titled Current And Quick Ratio Comparison Graph For Liquidity Assessment Structure PDF. The topics addressed in these templates are Short Term Debt, Delayed Payments, Cash Shortage. All the content presented in this PPT design is completely editable. Download it and make adjustments in color, background, font etc. as per your unique business setting.
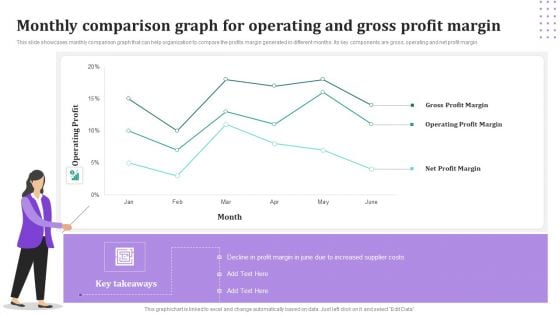
Monthly Comparison Graph For Operating And Gross Profit Margin Pictures PDF
This slide showcases monthly comparison graph that can help organization to compare the profits margin generated in different months. Its key components are gross, operating and net profit margin. Showcasing this set of slides titled Monthly Comparison Graph For Operating And Gross Profit Margin Pictures PDF. The topics addressed in these templates are Gross Profit Margin, Operating Profit Margin, Net Profit Margin. All the content presented in this PPT design is completely editable. Download it and make adjustments in color, background, font etc. as per your unique business setting.
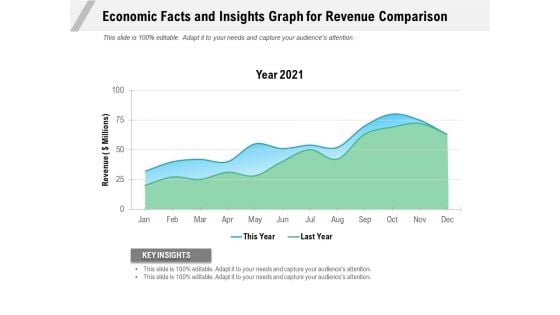
Economic Facts And Insights Graph For Revenue Comparison Ppt PowerPoint Presentation Gallery Portfolio PDF
Pitch your topic with ease and precision using this economic facts and insights graph for revenue comparison ppt powerpoint presentation gallery portfolio pdf. This layout presents information on year 2021, revenue, key insights. It is also available for immediate download and adjustment. So, changes can be made in the color, design, graphics or any other component to create a unique layout.
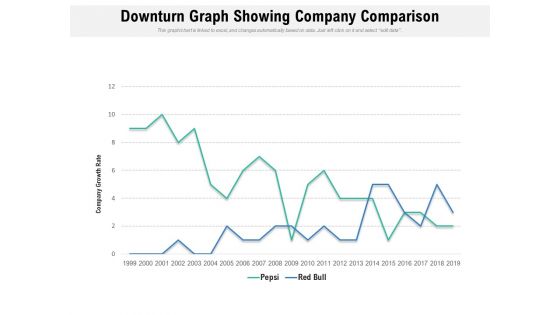
Downturn Graph Showing Company Comparison Ppt PowerPoint Presentation Professional Graphics Design PDF
Pitch your topic with ease and precision using this downturn graph showing company comparison ppt powerpoint presentation professional graphics design pdf. This layout presents information on company growth rate, red bull, pepsi. It is also available for immediate download and adjustment. So, changes can be made in the color, design, graphics or any other component to create a unique layout.
Gross And Net Revenue Comparison Shown By Graph Ppt PowerPoint Presentation File Icons PDF
Presenting this set of slides with name gross and net revenue comparison shown by graph ppt powerpoint presentation file icons pdf. The topics discussed in these slides are gross profit, net profit. This is a completely editable PowerPoint presentation and is available for immediate download. Download now and impress your audience.

House Loan Rates Monthly Comparison Line Graph Ppt PowerPoint Presentation Slides Graphics Pictures PDF
Showcasing this set of slides titled house loan rates monthly comparison line graph ppt powerpoint presentation slides graphics pictures pdf. The topics addressed in these templates are federal housing administration, house loan rates, line graph. All the content presented in this PPT design is completely editable. Download it and make adjustments in color, background, font etc. as per your unique business setting.
Expenses And Income Comparison Graph With Budget Summary Ppt PowerPoint Presentation Icon Inspiration PDF
This slide illustrates budget summary of expenditure of a company. it includes income and expenditure comparative data and expenditure chart etc.Pitch your topic with ease and precision using this Expenses And Income Comparison Graph With Budget Summary Ppt PowerPoint Presentation Icon Inspiration PDF. This layout presents information on Budget Summary, Expenditure Comparative, Actual Income. It is also available for immediate download and adjustment. So, changes can be made in the color, design, graphics or any other component to create a unique layout.
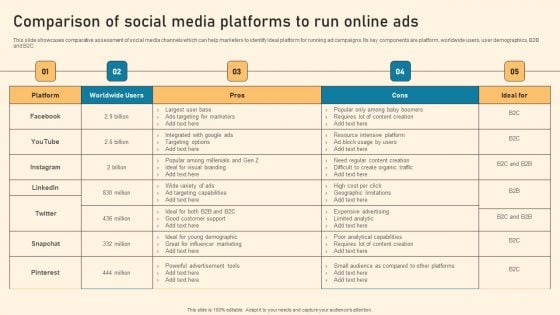
Comparison Of Social Media Platforms To Run Online Ads Ppt PowerPoint Presentation Diagram Graph Charts PDF
This slide showcases comparative assessment of social media channels which can help marketers to identify ideal platform for running ad campaigns. Its key components are platform, worldwide users, user demographics, B2B and B2C Slidegeeks is here to make your presentations a breeze with Comparison Of Social Media Platforms To Run Online Ads Ppt PowerPoint Presentation Diagram Graph Charts PDF With our easy to use and customizable templates, you can focus on delivering your ideas rather than worrying about formatting. With a variety of designs to choose from, you are sure to find one that suits your needs. And with animations and unique photos, illustrations, and fonts, you can make your presentation pop. So whether you are giving a sales pitch or presenting to the board, make sure to check out Slidegeeks first.
Contrast Circle Graph Comparison Circular Shape Ppt PowerPoint Presentation Complete Deck
If designing a presentation takes a lot of your time and resources and you are looking for a better alternative, then this contrast circle graph comparison circular shape ppt powerpoint presentation complete deck is the right fit for you. This is a prefabricated set that can help you deliver a great presentation on the topic. All the ten slides included in this sample template can be used to present a birds-eye view of the topic. These slides are also fully editable, giving you enough freedom to add specific details to make this layout more suited to your business setting. Apart from the content, all other elements like color, design, theme are also replaceable and editable. This helps in designing a variety of presentations with a single layout. Not only this, you can use this PPT design in formats like PDF, PNG, and JPG once downloaded. Therefore, without any further ado, download and utilize this sample presentation as per your liking.
Bar Graph And Pie Charts For Business Reports Vector Icon Ppt PowerPoint Presentation Show Graphics Tutorials PDF
Pitch your topic with ease and precision using this bar graph and pie charts for business reports vector icon ppt powerpoint presentation show graphics tutorials pdf. This layout presents information on bar graph and pie charts for business reports vector icon. It is also available for immediate download and adjustment. So, changes can be made in the color, design, graphics or any other component to create a unique layout.
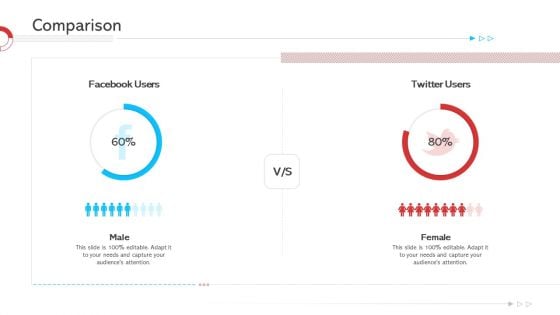
Comparison Template PDF
Deliver an awe inspiring pitch with this creative comparison template pdf bundle. Topics like comparison can be discussed with this completely editable template. It is available for immediate download depending on the needs and requirements of the user.
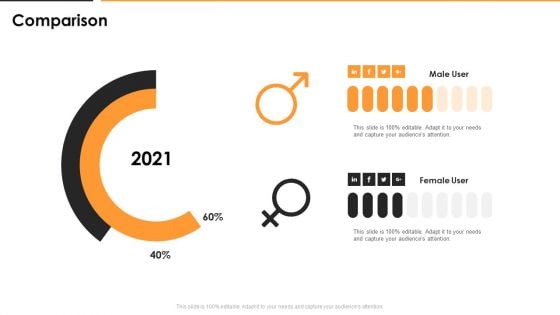
Comparison Brochure PDF
Deliver an awe inspiring pitch with this creative comparison brochure pdf bundle. Topics like comparison can be discussed with this completely editable template. It is available for immediate download depending on the needs and requirements of the user.
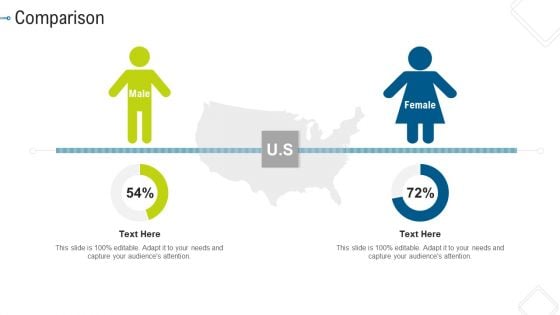
Comparison Information PDF
Deliver and pitch your topic in the best possible manner with this comparison information pdf. Use them to share invaluable insights on comparison and impress your audience. This template can be altered and modified as per your expectations. So, grab it now.
Comparison Icons PDF
Deliver and pitch your topic in the best possible manner with this comparison icons pdf. Use them to share invaluable insights on male population, female population and impress your audience. This template can be altered and modified as per your expectations. So, grab it now.
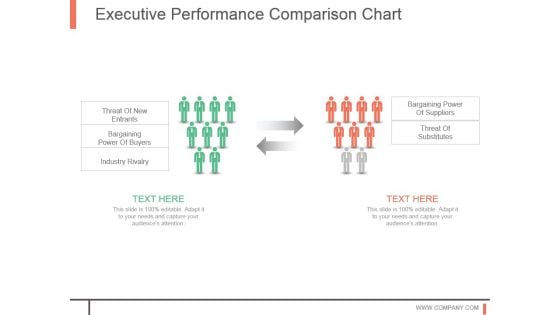
Executive Performance Comparison Chart
This is a executive performance comparison chart. This is a two stage process. The stages in this process are threat of new entrants, bargaining power of buyers, industry rivalry, bargaining power of suppliers, threat of substitutes.
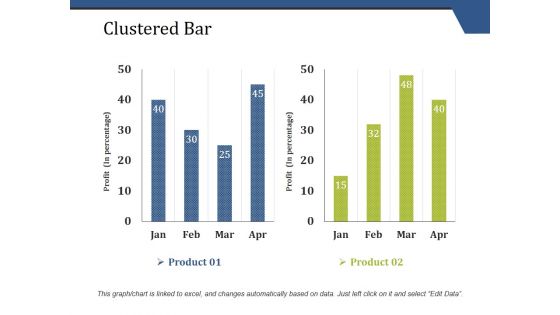
Clustered Bar Ppt PowerPoint Presentation Pictures Demonstration
This is a clustered bar ppt powerpoint presentation pictures demonstration. This is a two stage process. The stages in this process are clustered bar, finance, marketing, analysis, business.
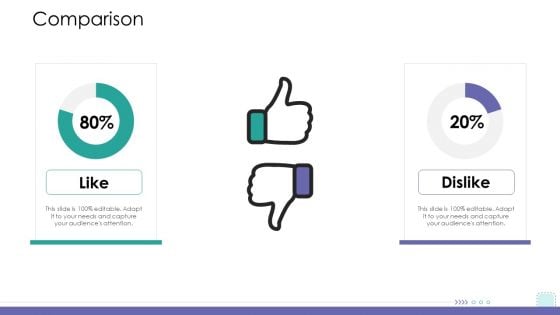
Corporate Governance Comparison Structure PDF
Deliver an awe inspiring pitch with this creative corporate governance comparison structure pdf bundle. Topics like comparison can be discussed with this completely editable template. It is available for immediate download depending on the needs and requirements of the user.
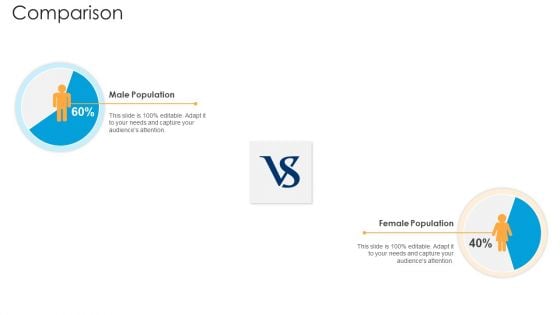
Comparison Ppt Styles Inspiration PDF
Deliver an awe-inspiring pitch with this creative comparison ppt styles inspiration pdf. bundle. Topics like comparison can be discussed with this completely editable template. It is available for immediate download depending on the needs and requirements of the user.
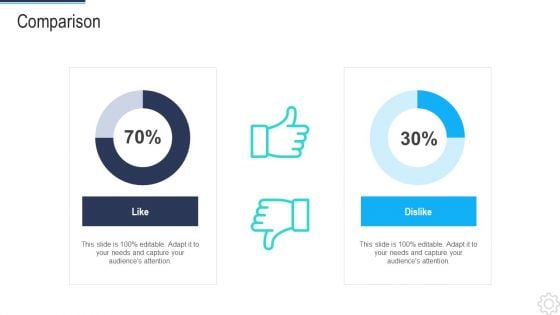
DSDM IT Comparison Slides PDF
Deliver an awe inspiring pitch with this creative dsdm it comparison slides pdf bundle. Topics like comparison can be discussed with this completely editable template. It is available for immediate download depending on the needs and requirements of the user.
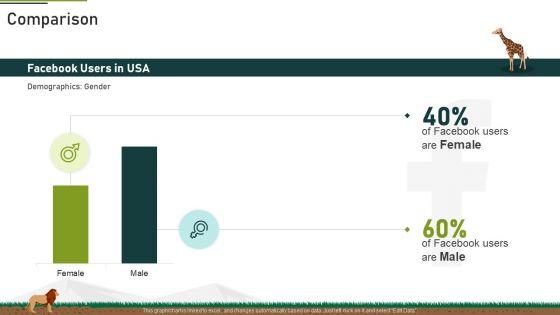
Comparison Ppt Layouts Outline PDF
Deliver and pitch your topic in the best possible manner with this comparison ppt layouts outline pdf. Use them to share invaluable insights on comparison and impress your audience. This template can be altered and modified as per your expectations. So, grab it now.
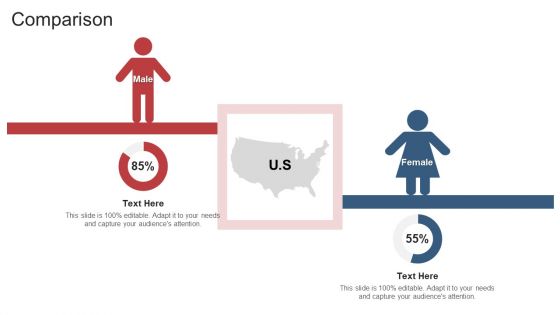
Comparison Ppt Pictures Deck PDF
Deliver and pitch your topic in the best possible manner with this comparison ppt pictures deck pdf. Use them to share invaluable insights on comparison and impress your audience. This template can be altered and modified as per your expectations. So, grab it now.
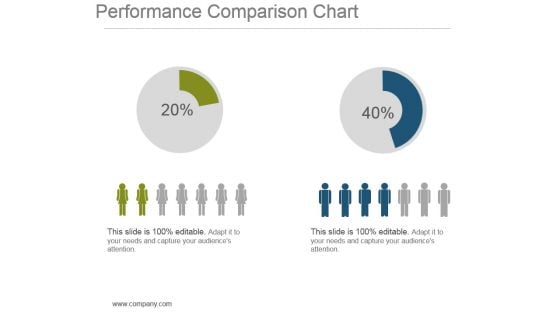
Performance Comparison Chart Powerpoint Show
This is a performance comparison chart powerpoint show. This is a two stage process. The stages in this process are finance, compare, strategy, management, planning.
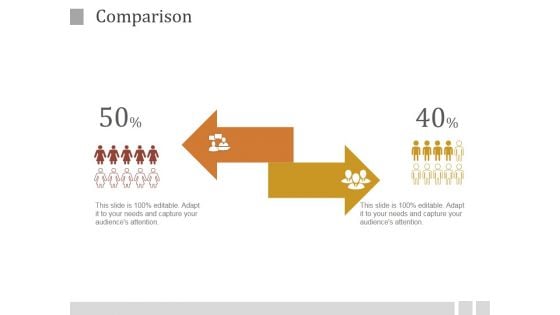
Comparison Ppt PowerPoint Presentation Inspiration
This is a comparison ppt powerpoint presentation inspiration. This is a two stage process. The stages in this process are arrows, business, marketing, management, strategy, success.
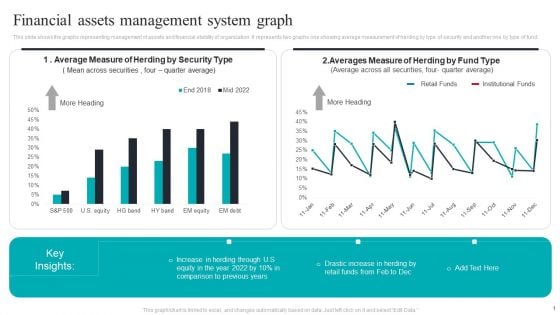
Financial Assets Management System Graph Structure PDF
This slide shows the graphs representing management of assets and financial stability of organization. It represents two graphs one showing average measurement of herding by type of security and another one by type of fund. Pitch your topic with ease and precision using this Financial Assets Management System Graph Structure PDF. This layout presents information on Financial Assets, Management System Graph. It is also available for immediate download and adjustment. So, changes can be made in the color, design, graphics or any other component to create a unique layout.
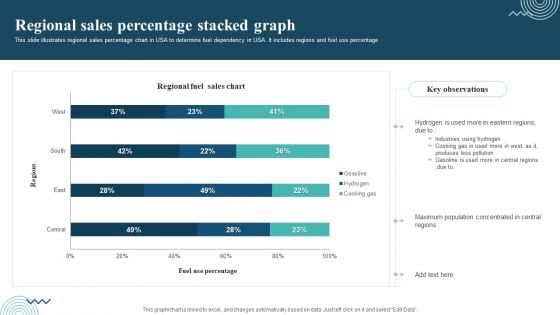
Regional Sales Percentage Stacked Graph Themes PDF
This slide illustrates regional sales percentage chart in USA to determine fuel dependency in USA. It includes regions and fuel use percentage. Pitch your topic with ease and precision using this Regional Sales Percentage Stacked Graph Themes PDF. This layout presents information on Regional Sales, Industries Using Hydrogen, Cooking Gas. It is also available for immediate download and adjustment. So, changes can be made in the color, design, graphics or any other component to create a unique layout.
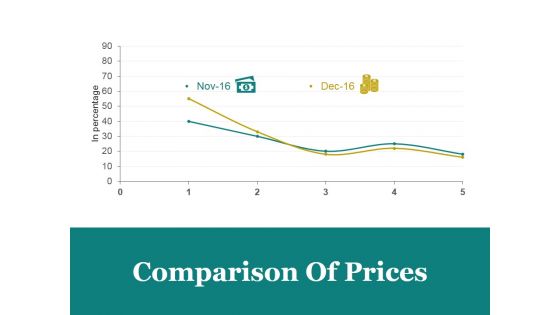
Comparison Of Prices Ppt PowerPoint Presentation Designs Download
This is a comparison of prices ppt powerpoint presentation designs download. This is a two stage process. The stages in this process are comparison of prices, marketing, in percentage, bar graph, business.
Comparison Between Two Graphs On Board Icon Ppt Portfolio Professional PDF
Presenting Comparison Between Two Graphs On Board Icon Ppt Portfolio Professional PDF to dispense important information. This template comprises three stages. It also presents valuable insights into the topics including comparison between two graphs on board icon. This is a completely customizable PowerPoint theme that can be put to use immediately. So, download it and address the topic impactfully.
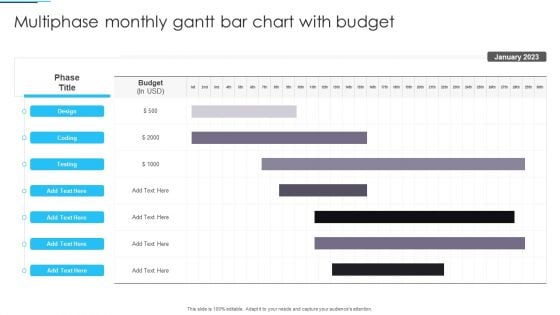
Multiphase Monthly Gantt Bar Chart With Budget Clipart PDF
Pitch your topic with ease and precision using this Multiphase Monthly Gantt Bar Chart With Budget Clipart PDF. This layout presents information on Gantt Bar Chart, Budget. It is also available for immediate download and adjustment. So, changes can be made in the color, design, graphics or any other component to create a unique layout.
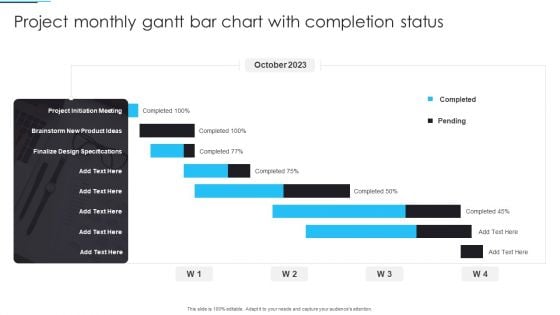
Project Monthly Gantt Bar Chart With Completion Status Infographics PDF
Pitch your topic with ease and precision using this Project Monthly Gantt Bar Chart With Completion Status Infographics PDF. This layout presents information on Project, Monthly Gantt Bar Chart. It is also available for immediate download and adjustment. So, changes can be made in the color, design, graphics or any other component to create a unique layout.
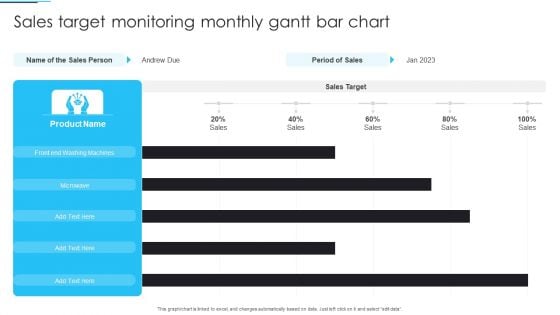
Sales Target Monitoring Monthly Gantt Bar Chart Ideas PDF
Pitch your topic with ease and precision using this Sales Target Monitoring Monthly Gantt Bar Chart Ideas PDF. This layout presents information on Sales Target Monitoring, Monthly Gantt Bar Chart. It is also available for immediate download and adjustment. So, changes can be made in the color, design, graphics or any other component to create a unique layout.
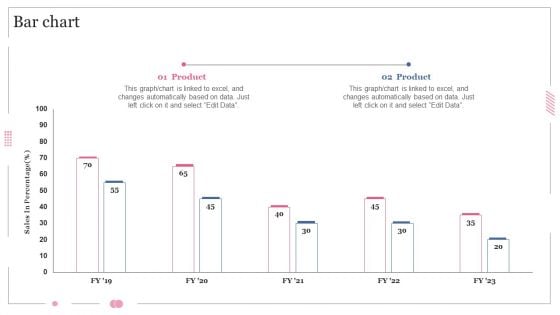
Bar Chart Software Designing And Development Playbook Ideas PDF
Presenting this PowerPoint presentation, titled Bar Chart Software Designing And Development Playbook Ideas PDF, with topics curated by our researchers after extensive research. This editable presentation is available for immediate download and provides attractive features when used. Download now and captivate your audience. Presenting this Bar Chart Software Designing And Development Playbook Ideas PDF. Our researchers have carefully researched and created these slides with all aspects taken into consideration. This is a completely customizable Bar Chart Software Designing And Development Playbook Ideas PDF that is available for immediate downloading. Download now and make an impact on your audience. Highlight the attractive features available with our PPTs.
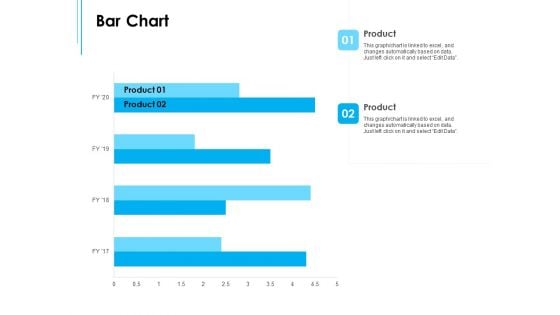
Business Environment Components Bar Chart Ppt Professional Format Ideas PDF
Presenting this set of slides with name business environment components bar chart ppt professional format ideas pdf. The topics discussed in these slides are product 01, product 02. This is a completely editable PowerPoint presentation and is available for immediate download. Download now and impress your audience.
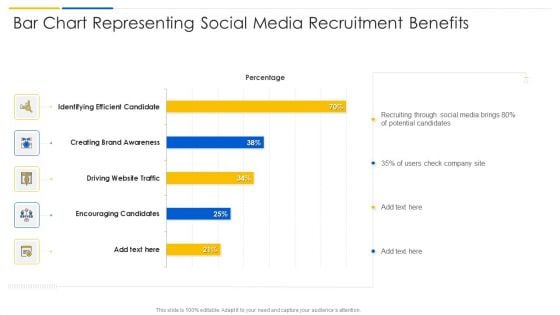
Bar Chart Representing Social Media Recruitment Benefits Infographics PDF
Pitch your topic with ease and precision using this bar chart representing social media recruitment benefits infographics pdf. This layout presents information on encouraging candidates, driving website traffic, creating brand awareness. It is also available for immediate download and adjustment. So, changes can be made in the color, design, graphics or any other component to create a unique layout.
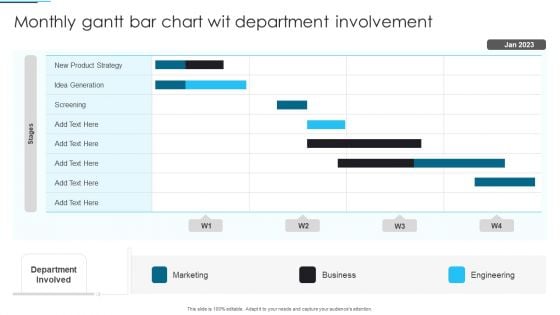
Monthly Gantt Bar Chart Wit Department Involvement Inspiration PDF
Pitch your topic with ease and precision using this Monthly Gantt Bar Chart Wit Department Involvement Inspiration PDF. This layout presents information on Product Strategy, Business, Marketing. It is also available for immediate download and adjustment. So, changes can be made in the color, design, graphics or any other component to create a unique layout.
Stacked Bar Chart Ppt PowerPoint Presentation Complete Deck With Slides
This Stacked Bar Chart Ppt PowerPoint Presentation Complete Deck With Slides acts as backup support for your ideas, vision, thoughts, etc. Use it to present a thorough understanding of the topic. This PPT slideshow can be utilized for both in-house and outside presentations depending upon your needs and business demands. Entailing eleven slides with a consistent design and theme, this template will make a solid use case. As it is intuitively designed, it suits every business vertical and industry. All you have to do is make a few tweaks in the content or any other component to design unique presentations. The biggest advantage of this complete deck is that it can be personalized multiple times once downloaded. The color, design, shapes, and other elements are free to modify to add personal touches. You can also insert your logo design in this PPT layout. Therefore a well-thought and crafted presentation can be delivered with ease and precision by downloading this Stacked Bar Chart Ppt PowerPoint Presentation Complete Deck With Slides PPT slideshow.
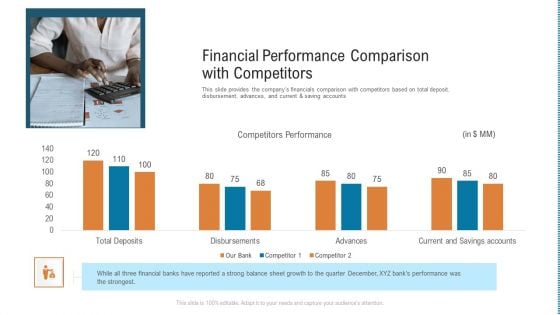
Financial Performance Comparison With Competitors Rules PDF
This slide provides the companys financials comparison with competitors based on total deposit, disbursement, advances, and current and saving accounts. Deliver an awe-inspiring pitch with this creative financial performance comparison with competitors rules pdf. bundle. Topics like financial performance comparison with competitors can be discussed with this completely editable template. It is available for immediate download depending on the needs and requirements of the user.
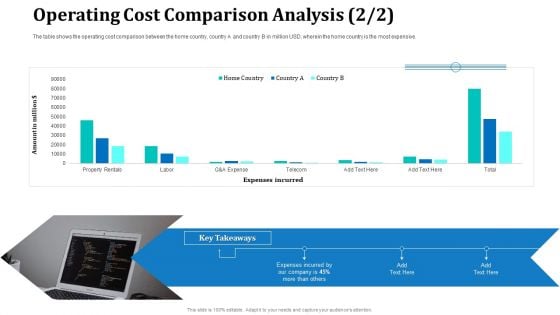
Operating Cost Comparison Analysis Labor Structure PDF
The table shows the operating cost comparison between the home country, country A and country B in million USD, wherein the home country is the most expensive. Deliver an awe inspiring pitch with this creative operating cost comparison analysis labor structure pdf bundle. Topics like operating cost comparison analysis can be discussed with this completely editable template. It is available for immediate download depending on the needs and requirements of the user.
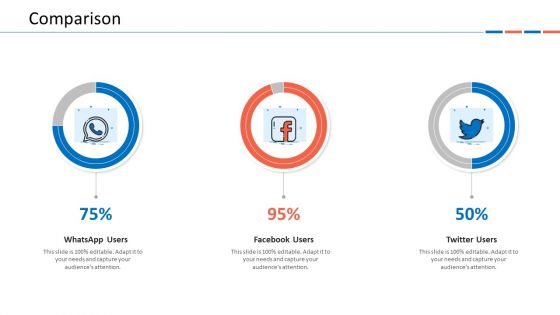
Customer Relationship Management Dashboard Comparison Formats PDF
Deliver an awe inspiring pitch with this creative customer relationship management dashboard comparison formats pdf bundle. Topics like comparison can be discussed with this completely editable template. It is available for immediate download depending on the needs and requirements of the user.
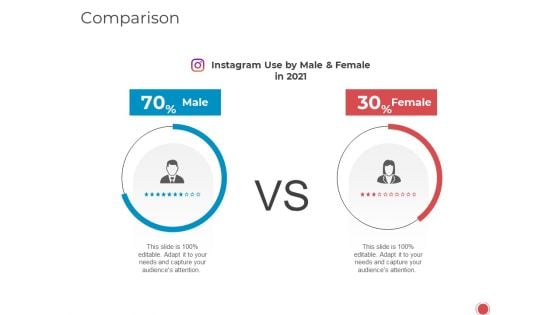
Introduce Yourself Comparison Ppt Professional Sample PDF
Deliver an awe inspiring pitch with this creative introduce yourself comparison ppt professional sample pdf bundle. Topics like comparison can be discussed with this completely editable template. It is available for immediate download depending on the needs and requirements of the user.
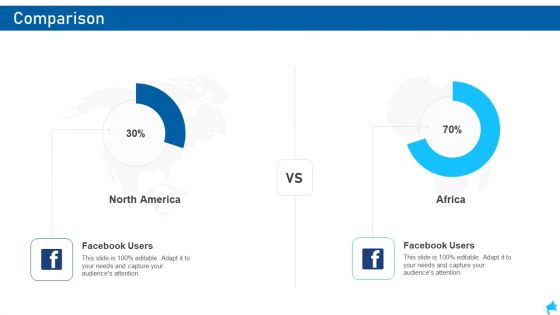
Social Media Marketing Comparison Sample PDF
Deliver and pitch your topic in the best possible manner with this social media marketing comparison sample pdf. Use them to share invaluable insights on comparison and impress your audience. This template can be altered and modified as per your expectations. So, grab it now.
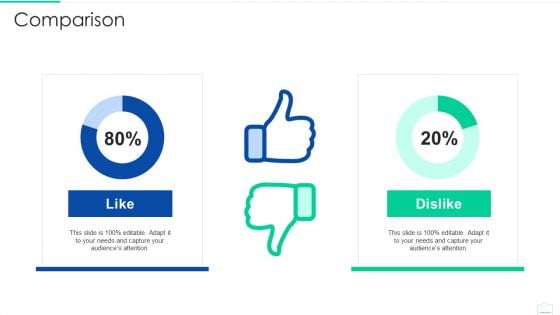
Market Area Analysis Comparison Slides PDF
Deliver an awe inspiring pitch with this creative market area analysis comparison slides pdf bundle. Topics like comparison can be discussed with this completely editable template. It is available for immediate download depending on the needs and requirements of the user.
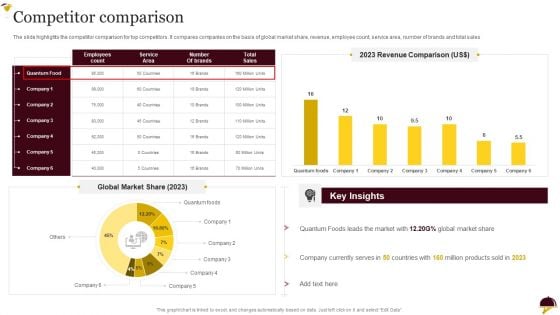
Food Company Overview Competitor Comparison Infographics PDF
The slide highlights the competitor comparison for top competitors. It compares companies on the basis of global market share, revenue, employee count, service area, number of brands and total sales.Deliver and pitch your topic in the best possible manner with this Food Company Overview Competitor Comparison Infographics PDF. Use them to share invaluable insights on Currently Serves, Quantum Foods, Key Insights and impress your audience. This template can be altered and modified as per your expectations. So, grab it now.
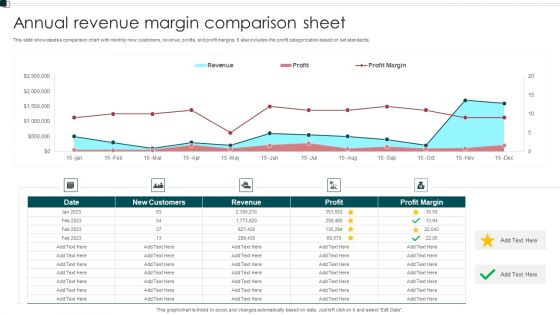
Annual Revenue Margin Comparison Sheet Information PDF
This slide showcases a comparison chart with monthly new customers, revenue, profits, and profit margins. It also includes the profit categorization based on set standards. Showcasing this set of slides titled Annual Revenue Margin Comparison Sheet Information PDF. The topics addressed in these templates are Customers, Revenue, Profit Margin. All the content presented in this PPT design is completely editable. Download it and make adjustments in color, background, font etc. as per your unique business setting.
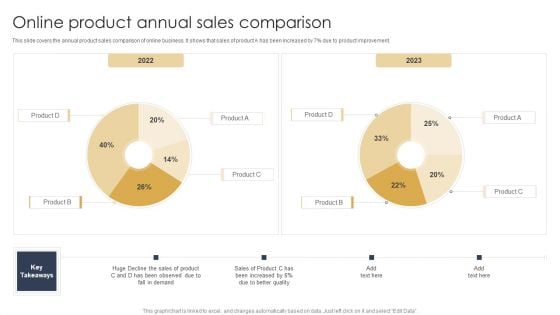
Online Product Annual Sales Comparison Brochure PDF
This slide covers the annual product sales comparison of online business. It shows that sales of product A has been increased by 7 percent due to product improvement. Showcasing this set of slides titled Online Product Annual Sales Comparison Brochure PDF. The topics addressed in these templates are Demand, Sales Of Product, Quality. All the content presented in this PPT design is completely editable. Download it and make adjustments in color, background, font etc. as per your unique business setting.
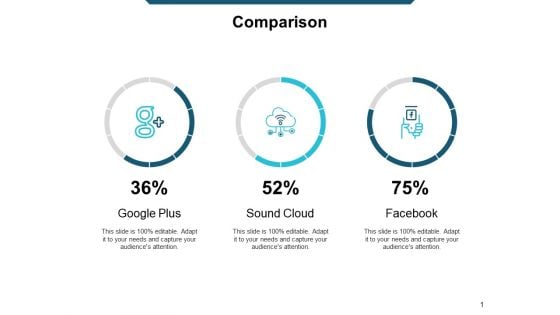
Comparison Management Ppt Powerpoint Presentation Styles Vector
This is a comparison management ppt powerpoint presentation styles vector. The topics discussed in this diagram are finance, marketing, management, investment, analysis. This is a completely editable PowerPoint presentation, and is available for immediate download.

Two Consecutive Years Revenue Comparison Topics PDF
This slide showcases profitability comparison with the help of a trend chart. It represents revenue, cost of goods sold, gross profit, net profit, etc. Pitch your topic with ease and precision using this Two Consecutive Years Revenue Comparison Topics PDF. This layout presents information on Revenue, Gross Profit, Net Income. It is also available for immediate download and adjustment. So, changes can be made in the color, design, graphics or any other component to create a unique layout.

Engineering Enterprise Competitive Competitor Comparison Topics PDF
The slide highlights the competitor comparison for top competitors. It compares companies on the basis of global market share, revenue, employee count, location served and services offered. If you are looking for a format to display your unique thoughts, then the professionally designed Engineering Enterprise Competitive Competitor Comparison Topics PDF is the one for you. You can use it as a Google Slides template or a PowerPoint template. Incorporate impressive visuals, symbols, images, and other charts. Modify or reorganize the text boxes as you desire. Experiment with shade schemes and font pairings. Alter, share or cooperate with other people on your work. Download Engineering Enterprise Competitive Competitor Comparison Topics PDF and find out how to give a successful presentation. Present a perfect display to your team and make your presentation unforgettable.
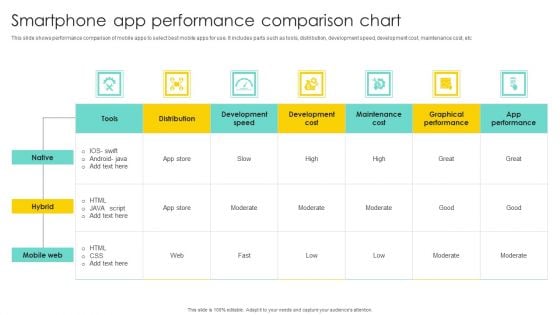
Smartphone App Performance Comparison Chart Rules PDF
Showcasing this set of slides titled Smartphone App Performance Comparison Chart Rules PDF. The topics addressed in these templates are Development Speed, Maintenance Cost, Graphical Performance. All the content presented in this PPT design is completely editable. Download it and make adjustments in color, background, font etc. as per your unique business setting.
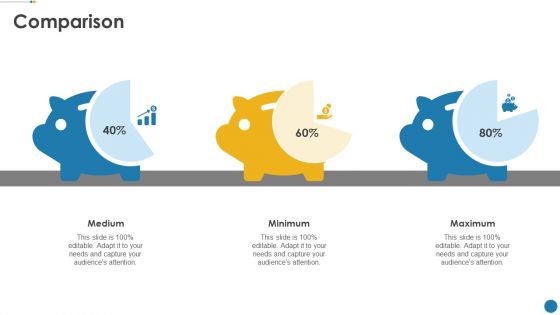
IT Operations Automation Comparison Slides PDF
Deliver an awe inspiring pitch with this creative it operations automation comparison slides pdf bundle. Topics like medium, minimum, maximum can be discussed with this completely editable template. It is available for immediate download depending on the needs and requirements of the user.

 Home
Home
