Comparison Dashboard
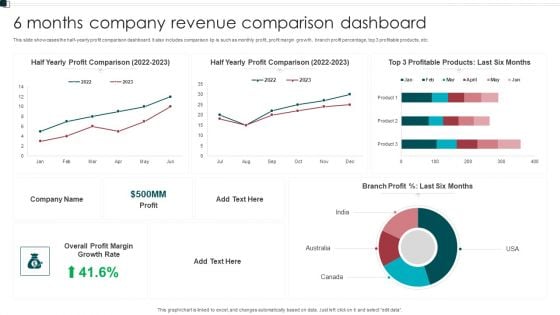
6 Months Company Revenue Comparison Dashboard Graphics PDF
This slide showcases the half yearly profit comparison dashboard. It also includes comparison kp is such as monthly profit, profit margin growth, branch profit percentage, top 3 profitable products, etc. Showcasing this set of slides titled 6 Months Company Revenue Comparison Dashboard Graphics PDF. The topics addressed in these templates are Growth Rate, Overall Profit Margin, Branch Profit. All the content presented in this PPT design is completely editable. Download it and make adjustments in color, background, font etc. as per your unique business setting.
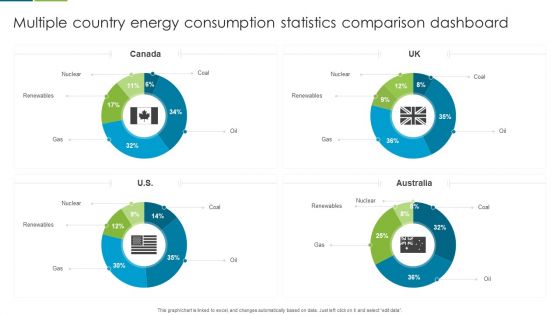
Multiple Country Energy Consumption Statistics Comparison Dashboard Formats PDF
This graph or chart is linked to excel, and changes automatically based on data. Just left click on it and select edit data. Pitch your topic with ease and precision using this Multiple Country Energy Consumption Statistics Comparison Dashboard Formats PDF. This layout presents information on Nuclear, Renewables, Gas. It is also available for immediate download and adjustment. So, changes can be made in the color, design, graphics or any other component to create a unique layout.
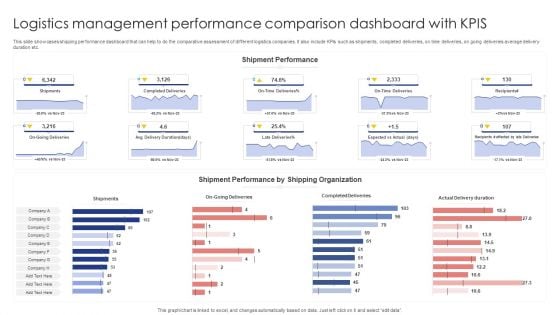
Logistics Management Performance Comparison Dashboard With Kpis Sample PDF
This slide showcases shipping performance dashboard that can help to do the comparative assessment of different logistics companies. It also include KPIs such as shipments, completed deliveries, on time deliveries, on going deliveries average delivery duration etc. Pitch your topic with ease and precision using this Logistics Management Performance Comparison Dashboard With Kpis Sample PDF. This layout presents information on Shipments, Completed Deliveries, Actual Delivery Duration. It is also available for immediate download and adjustment. So, changes can be made in the color, design, graphics or any other component to create a unique layout.
Monthly Comparison Dashboard For Lead Tracking Sample PDF
This slide showcases dashboard that can help organization to compare the leads converted in different months and make changes in sales and marketing campaigns . Its key components lead generated by country, by industry type and lead sources by month. Showcasing this set of slides titled Monthly Comparison Dashboard For Lead Tracking Sample PDF. The topics addressed in these templates are Leads Received, Industry Type, Lead Generated. All the content presented in this PPT design is completely editable. Download it and make adjustments in color, background, font etc. as per your unique business setting.
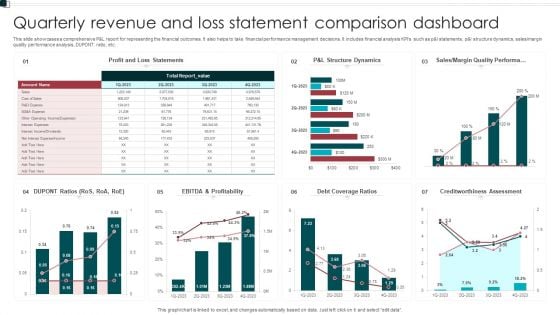
Quarterly Revenue And Loss Statement Comparison Dashboard Portrait PDF
This slide showcases a comprehensive P and L report for representing the financial outcomes. It also helps to take financial performance management decisions. It includes financial analysis KPIs such as p and l statements, p and l structure dynamics, sales or margin quality performance analysis, DUPONT ratio, etc. Showcasing this set of slides titled Quarterly Revenue And Loss Statement Comparison Dashboard Portrait PDF. The topics addressed in these templates are Profitability, Debt Coverage Ratios, Margin Quality Performa. All the content presented in this PPT design is completely editable. Download it and make adjustments in color, background, font etc. as per your unique business setting.
Customer Relationship Management Dashboard Comparison Formats PDF
Deliver an awe inspiring pitch with this creative customer relationship management dashboard comparison formats pdf bundle. Topics like comparison can be discussed with this completely editable template. It is available for immediate download depending on the needs and requirements of the user.
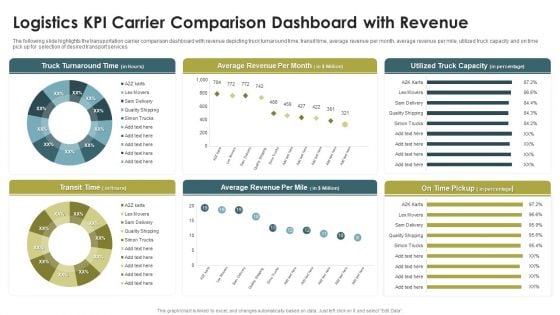
Logistics KPI Carrier Comparison Dashboard With Revenue Ppt Infographics Portfolio PDF
The following slide highlights the transportation carrier comparison dashboard with revenue depicting truck turnaround time, transit time, average revenue per month, average revenue per mile, utilized truck capacity and on time pick up for selection of desired transport services. Pitch your topic with ease and precision using this Logistics KPI Carrier Comparison Dashboard With Revenue Ppt Infographics Portfolio PDF. This layout presents information on Truck Turnaround Time, Average Revenue, Per Month, Transit Time. It is also available for immediate download and adjustment. So, changes can be made in the color, design, graphics or any other component to create a unique layout.
Target Vs Actual Sales Comparison Dashboard Ppt PowerPoint Presentation File Icons PDF
Presenting this set of slides with name target vs actual sales comparison dashboard ppt powerpoint presentation file icons pdf. The topics discussed in these slides are sales amount, avg commission rate, total commissions, total deductions, commission payable, top sales manager, top sales person. This is a completely editable PowerPoint presentation and is available for immediate download. Download now and impress your audience.
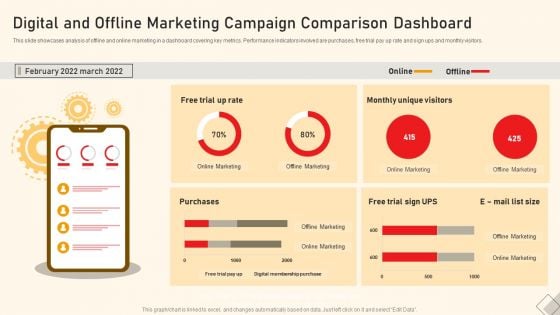
Digital And Offline Marketing Campaign Comparison Dashboard Ppt Inspiration Microsoft PDF
This slide showcases analysis of offline and online marketing in a dashboard covering key metrics. Performance indicators involved are purchases, free trial pay up rate and sign ups and monthly visitors. Pitch your topic with ease and precision using this Digital And Offline Marketing Campaign Comparison Dashboard Ppt Inspiration Microsoft PDF. This layout presents information on Online Marketing, Offline Marketing, Free Trial Sign, UPS. It is also available for immediate download and adjustment. So, changes can be made in the color, design, graphics or any other component to create a unique layout.
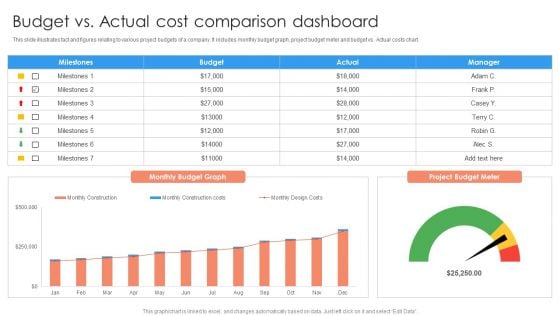
Budget Vs Actual Cost Comparison Dashboard Ppt PowerPoint Presentation Professional Format Ideas PDF
This slide illustrates fact and figures relating to various project budgets of a company. It includes monthly budget graph, project budget meter and budget vs. Actual costs chart.Pitch your topic with ease and precision using this Budget Vs Actual Cost Comparison Dashboard Ppt PowerPoint Presentation Professional Format Ideas PDF. This layout presents information on Milestones, Budget Graph, Manager. It is also available for immediate download and adjustment. So, changes can be made in the color, design, graphics or any other component to create a unique layout.
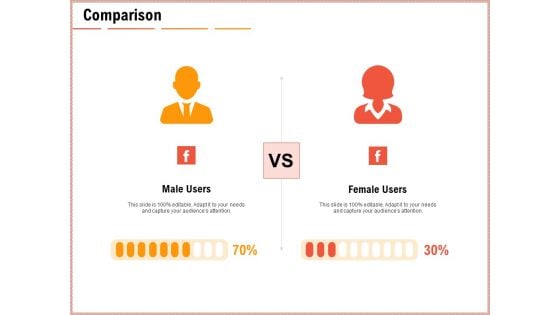
Net Promoter Score Dashboard Comparison Ppt Gallery Graphics Example PDF
This is a net promoter score dashboard comparison ppt gallery graphics example pdf template with various stages. Focus and dispense information on two stages using this creative set, that comes with editable features. It contains large content boxes to add your information on topics like comparison, male, female. You can also showcase facts, figures, and other relevant content using this PPT layout. Grab it now.

Competition Analysis Matrix Dashboard Comparison Ppt PowerPoint Presentation Complete Deck
This competition analysis matrix dashboard comparison ppt powerpoint presentation complete deck acts as backup support for your ideas, vision, thoughts, etc. Use it to present a thorough understanding of the topic. This PPT slideshow can be utilized for both in-house and outside presentations depending upon your needs and business demands. Entailing twelve slides with a consistent design and theme, this template will make a solid use case. As it is intuitively designed, it suits every business vertical and industry. All you have to do is make a few tweaks in the content or any other component to design unique presentations. The biggest advantage of this complete deck is that it can be personalized multiple times once downloaded. The color, design, shapes, and other elements are free to modify to add personal touches. You can also insert your logo design in this PPT layout. Therefore a well-thought and crafted presentation can be delivered with ease and precision by downloading this competition analysis matrix dashboard comparison ppt powerpoint presentation complete deck PPT slideshow.
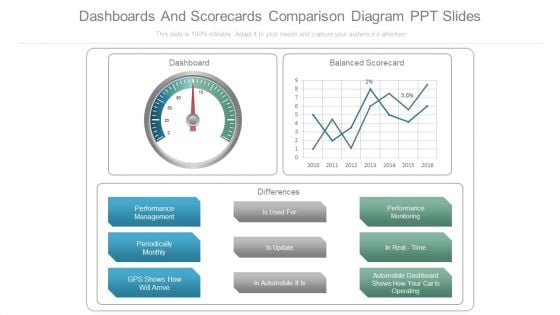
Dashboards And Scorecards Comparison Diagram Ppt Slides
This is a dashboards and scorecards comparison diagram ppt slides. This is a three stage process. The stages in this process are dashboard, balanced scorecard, differences, performance management, periodically monthly, gps shows how will arrive, is used for, is update, in automobile it is, performance monitoring, in real time, automobile dashboard shows how your car is operating.
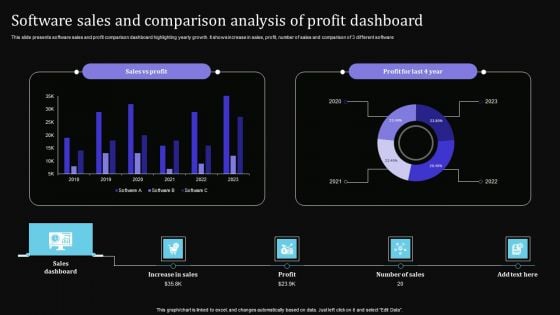
Software Sales And Comparison Analysis Of Profit Dashboard Sample PDF
This slide presents software sales and profit comparison dashboard highlighting yearly growth. It shows increase in sales, profit, number of sales and comparison of 3 different software. Showcasing this set of slides titled Software Sales And Comparison Analysis Of Profit Dashboard Sample PDF. The topics addressed in these templates are Increase Sales, Profit, Sales Dashboard. All the content presented in this PPT design is completely editable. Download it and make adjustments in color, background, font etc. as per your unique business setting.
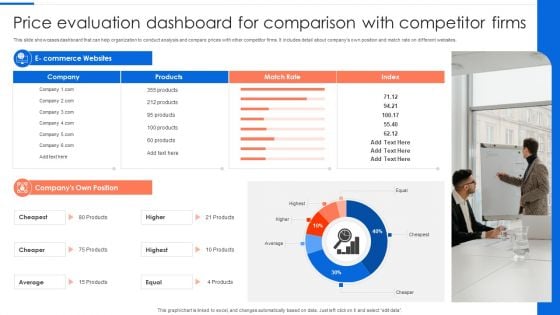
Price Evaluation Dashboard For Comparison With Competitor Firms Mockup PDF
Pitch your topic with ease and precision using this Price Evaluation Dashboard For Comparison With Competitor Firms Mockup PDF. This layout presents information on Dashboard, Comparison With Competitor. It is also available for immediate download and adjustment. So, changes can be made in the color, design, graphics or any other component to create a unique layout.
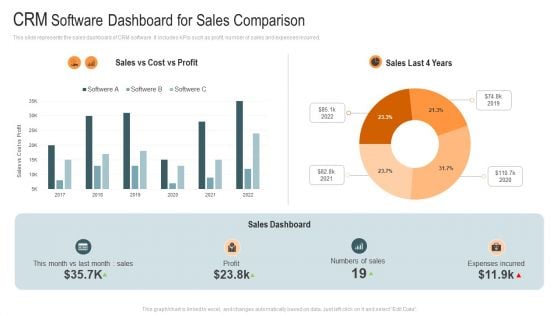
CRM Software Dashboard For Sales Comparison Mockup PDF
This slide represents the sales dashboard of CRM software. It includes KPIs such as profit, number of sales and expenses incurred. Pitch your topic with ease and precision using this CRM Software Dashboard For Sales Comparison Mockup PDF. This layout presents information on Profit, Sales Dashboard, Expenses Incurred. It is also available for immediate download and adjustment. So, changes can be made in the color, design, graphics or any other component to create a unique layout.

Communication KPI Dashboard With KPI Comparison Ideas PDF
Pitch your topic with ease and precision using this Communication KPI Dashboard With KPI Comparison Ideas PDF This layout presents information on Increase In Brand, Employees Knowledge, Vision Statement It is also available for immediate download and adjustment. So, changes can be made in the color, design, graphics or any other component to create a unique layout.
Lead Tracking Dashboard With Metric Comparison Brochure PDF
This slide showcases dashboard of lead pipeline that can help to identify total number of leads generated and expenses incurred to acquire the audience. It also showcases other key performance metrics like lead breakdown by status and number of leads per month. Pitch your topic with ease and precision using this Lead Tracking Dashboard With Metric Comparison Brochure PDF. This layout presents information on Metric Comparison, Lead Pipeline, Lead Breakdown Status. It is also available for immediate download and adjustment. So, changes can be made in the color, design, graphics or any other component to create a unique layout.
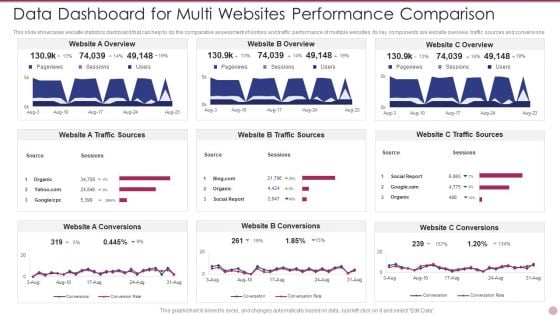
Data Dashboard For Multi Websites Performance Comparison Themes PDF
This slide showcases website statistics dashboard that can help to do the comparative assessment of visitors and traffic performance of multiple websites. Its key components are website overview, traffic sources and conversions. Showcasing this set of slides titled Data Dashboard For Multi Websites Performance Comparison Themes PDF. The topics addressed in these templates are Data Dashboard For Multi Websites Performance Comparison. All the content presented in this PPT design is completely editable. Download it and make adjustments in color, background, font etc. as per your unique business setting.
Catering Business Advertisement Plan KPI Dashboard With Revenue Comparison Icons PDF
This slide shows the KPI dashboard of the catering industry to evaluate the actual and potential targets. It includes KPIs such as expenditure, sales revenue, beverage, etc. Showcasing this set of slides titled Catering Business Advertisement Plan KPI Dashboard With Revenue Comparison Icons PDF. The topics addressed in these templates are Expenditure, Revenue Comparison, Department. All the content presented in this PPT design is completely editable. Download it and make adjustments in color, background, font etc. as per your unique business setting.
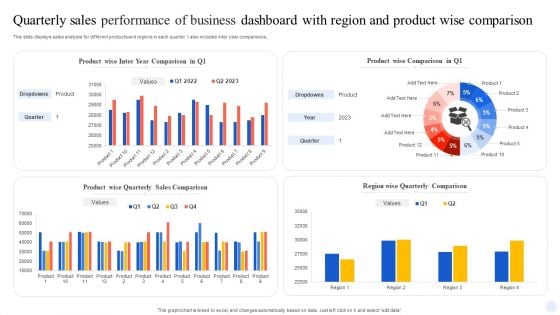
Quarterly Sales Performance Of Business Dashboard With Region And Product Wise Comparison Guidelines PDF
This slide displays sales analysis for different products and regions in each quarter. t also includes inter year comparisons. Pitch your topic with ease and precision using this Quarterly Sales Performance Of Business Dashboard With Region And Product Wise Comparison Guidelines PDF. This layout presents information on Product Wise Quarterly Sales, Comparison. It is also available for immediate download and adjustment. So, changes can be made in the color, design, graphics or any other component to create a unique layout.
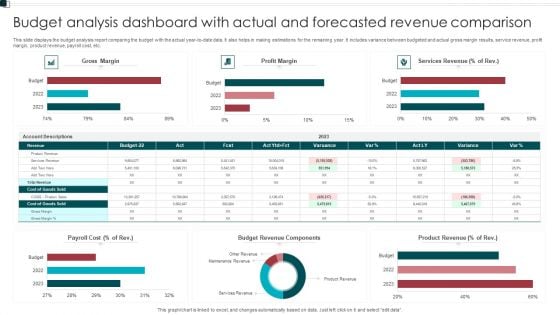
Budget Analysis Dashboard With Actual And Forecasted Revenue Comparison Structure PDF
This slide displays the budget analysis report comparing the budget with the actual year to date data. It also helps in making estimations for the remaining year. It includes variance between budgeted and actual gross margin results, service revenue, profit margin, product revenue, payroll cost, etc. Pitch your topic with ease and precision using this Budget Analysis Dashboard With Actual And Forecasted Revenue Comparison Structure PDF. This layout presents information on Payroll Cost, Budget Revenue Components, Product Revenue. It is also available for immediate download and adjustment. So, changes can be made in the color, design, graphics or any other component to create a unique layout.

KPI Dashboard Of Customer And Product Sales Performance Comparison Information PDF
This slide shows the KPI dashboard of client and product sales comparison. It also includes sales by location and total sales. Pitch your topic with ease and precision using this KPI Dashboard Of Customer And Product Sales Performance Comparison Information PDF. This layout presents information on Product Sales, Client Sales, Tim Santana. It is also available for immediate download and adjustment. So, changes can be made in the color, design, graphics or any other component to create a unique layout.

Comparison Ppt File Show PDF
This is a comparison ppt file show pdf template with various stages. Focus and dispense information on two stages using this creative set, that comes with editable features. It contains large content boxes to add your information on topics like male, female. You can also showcase facts, figures, and other relevant content using this PPT layout. Grab it now.
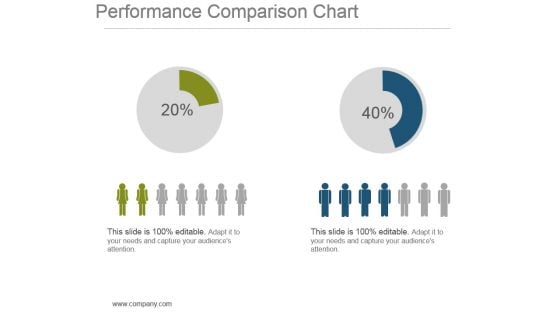
Performance Comparison Chart Powerpoint Show
This is a performance comparison chart powerpoint show. This is a two stage process. The stages in this process are finance, compare, strategy, management, planning.
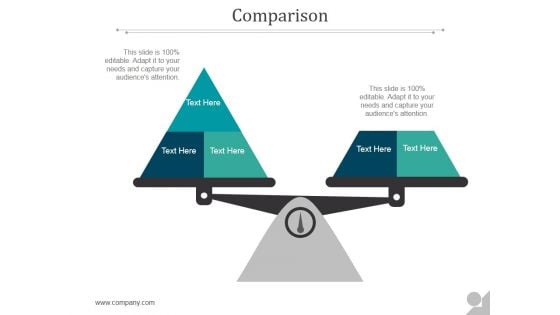
Comparison Ppt PowerPoint Presentation Graphics
This is a comparison ppt powerpoint presentation graphics. This is a two stage process. The stages in this process are business, compare, marketing, management, success.
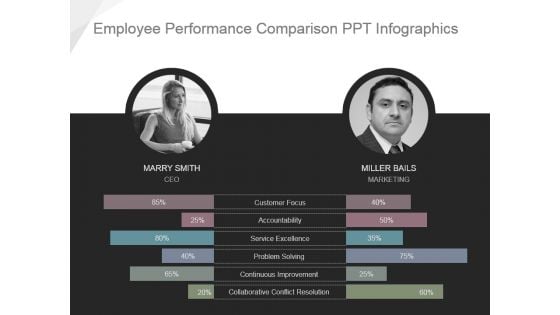
Employee Performance Comparison Ppt Infographics
This is a employee performance comparison ppt infographics. This is a two stage process. The stages in this process are customer focus, accountability, service excellence, problem solving, continuous improvement, collaborative conflict resolution.
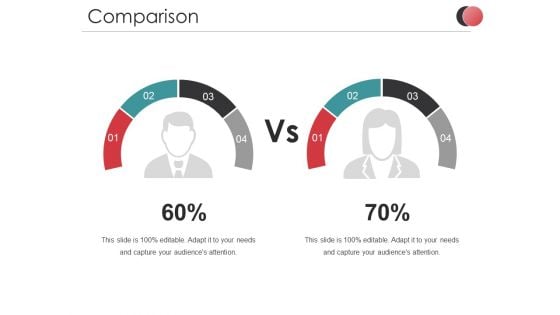
Comparison Ppt PowerPoint Presentation Professional Slide Download
This is a comparison ppt powerpoint presentation professional slide download. This is a two stage process. The stages in this process are business, marketing, planning, comparison, percentage.
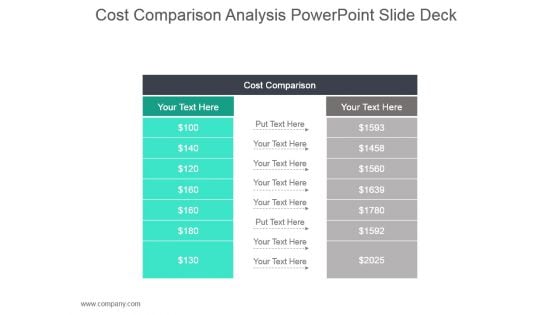
Cost Comparison Analysis Powerpoint Slide Deck
This is a cost comparison analysis powerpoint slide deck. This is a two stage process. The stages in this process are cost comparison, business, strategy, marketing.
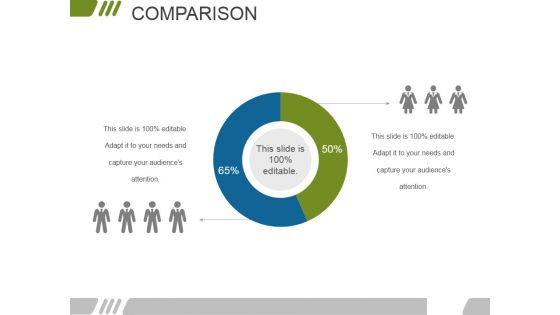
Comparison Ppt PowerPoint Presentation Portfolio Example File
This is a comparison ppt powerpoint presentation portfolio example file. This is a two stage process. The stages in this process are business, marketing, comparison, finance, management.
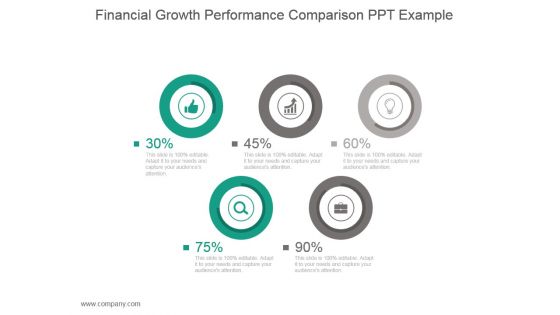
Financial Growth Performance Comparison Ppt Example
This is a financial growth performance comparison ppt example. This is a five stage process. The stages in this process are business, strategy, marketing, finance, icons.
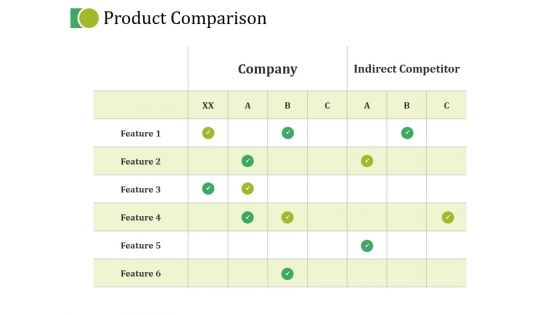
Product Comparison Ppt PowerPoint Presentation Show
This is a product comparison ppt powerpoint presentation show. This is a six stage process. The stages in this process are business, marketing, strategy, planning, tables.
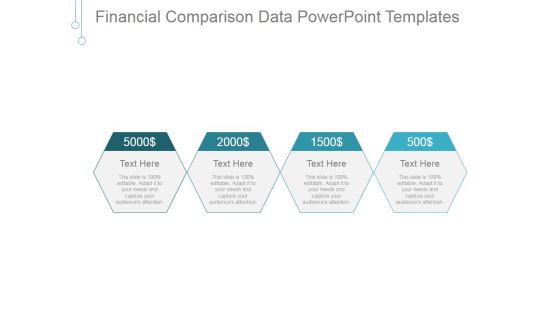
Financial Comparison Data Ppt PowerPoint Presentation Gallery
This is a financial comparison data ppt powerpoint presentation gallery. This is a four stage process. The stages in this process are business, marketing, management, dollar, finance.
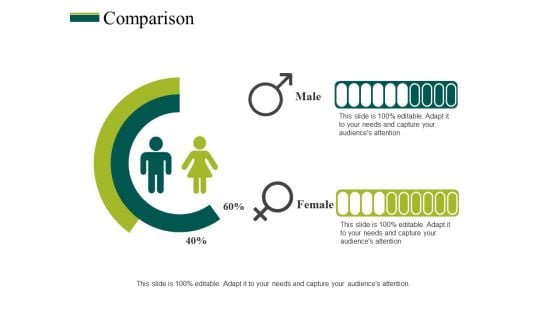
Comparison Ppt PowerPoint Presentation Outline Designs Download
This is a comparison ppt powerpoint presentation outline designs download. This is a two stage process. The stages in this process are male, female, strategy, planning, finance.
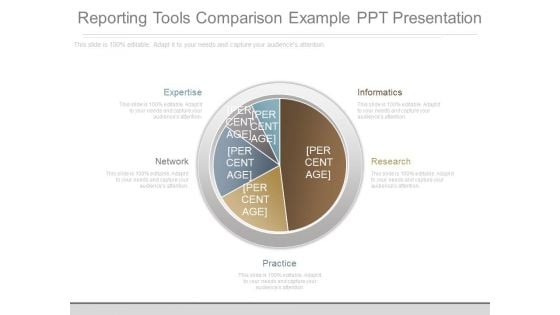
Reporting Tools Comparison Example Ppt Presentation
This is a reporting tools comparison example ppt presentation. This is a five stage process. The stages in this process are expertise, informatics, research, network, practice.
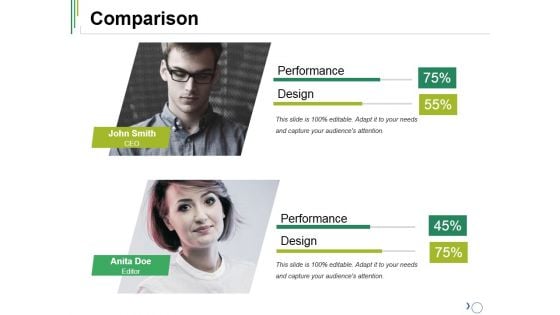
Comparison Ppt PowerPoint Presentation Infographics Information
This is a comparison ppt powerpoint presentation infographics information. This is a two stage process. The stages in this process are design, performance, ceo, editor.
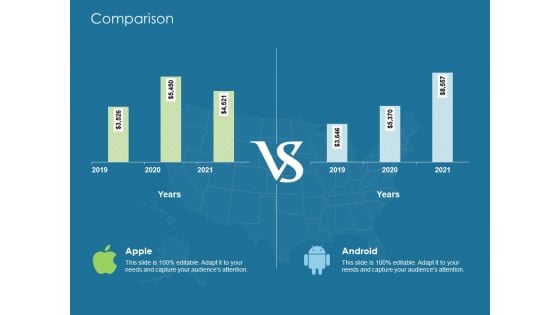
Evaluating Performance Comparison Ppt Infographics Maker PDF
Deliver an awe-inspiring pitch with this creative evaluating performance comparison ppt infographics maker pdf bundle. Topics like comparison can be discussed with this completely editable template. It is available for immediate download depending on the needs and requirements of the user.
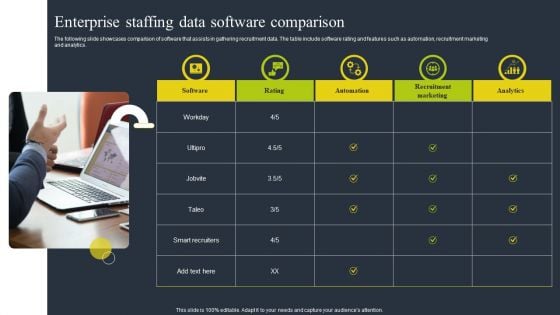
Enterprise Staffing Data Software Comparison Professional PDF
The following slide showcases comparison of software that assists in gathering recruitment data. The table include software rating and features such as automation, recruitment marketing and analytics. Persuade your audience using this Enterprise Staffing Data Software Comparison Professional PDF. This PPT design covers five stages, thus making it a great tool to use. It also caters to a variety of topics including Automation, Recruitment Marketing, Analytics. Download this PPT design now to present a convincing pitch that not only emphasizes the topic but also showcases your presentation skills.

Three Tags For Data Comparison Powerpoint Slides
This PPT slide contains graphics of three tags. Download this PowerPoint template to depict data comparison in business presentations. Deliver amazing presentations to mesmerize your audience by using this PPT slide design.
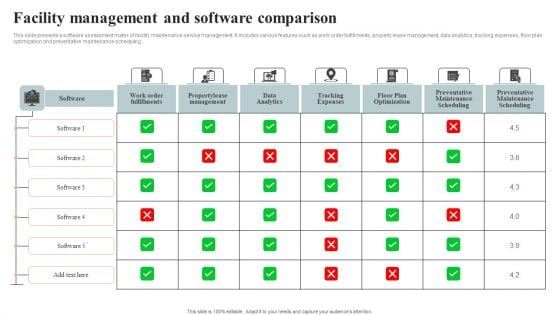
Facility Management And Software Comparison Microsoft PDF
This slide presents a software assessment matrix of facility maintenance service management. It includes various features such as work order fulfillments, property lease management, data analytics, tracking expenses, floor plan optimization and preventative maintenance scheduling. Pitch your topic with ease and precision using this Facility Management And Software Comparison Microsoft PDF. This layout presents information on Work Order Fulfillments, Propertylease Management, Data Analytics. It is also available for immediate download and adjustment. So, changes can be made in the color, design, graphics or any other component to create a unique layout.

Online Application Development Software Comparison Slides PDF
This slide depicts different technological trends for development of new mobile application. It includes trends based on AI and machine learning, mobile commerce, 5G technology.Persuade your audience using this Online Application Development Software Comparison Slides PDF. This PPT design covers one stage, thus making it a great tool to use. It also caters to a variety of topics including Development Cost, Development Environment, Revenue Potential. Download this PPT design now to present a convincing pitch that not only emphasizes the topic but also showcases your presentation skills.
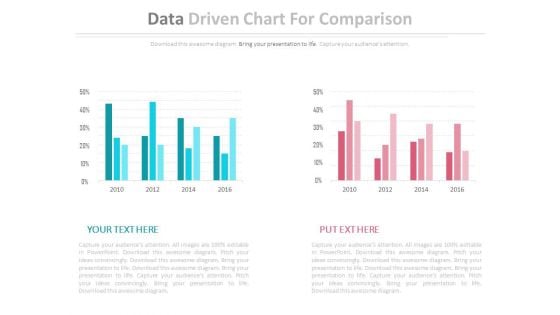
Two Data Driven Comparison Charts Powerpoint Slides
This PowerPoint template contains diagram of two data driven charts. You may use this PPT slide to depict strategic analysis for business. The color coding of this template is specifically designed to highlight you points.
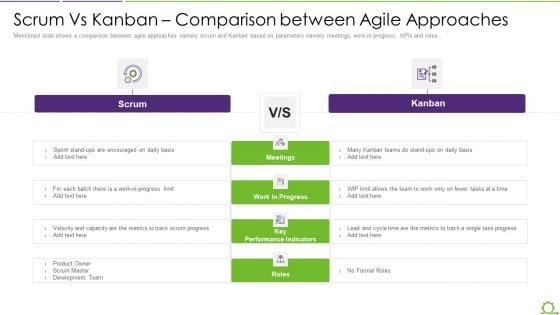
Comparison Between Agile And Scrum IT Scrum Vs Kanban Comparison Between Agile Approaches Slides PDF
Mentioned slide shows a comparison between agile approaches namely scrum and Kanban based on parameters namely meetings, work-in-progress, KPIs and roles. This is a comparison between agile and scrum it scrum vs kanban comparison between agile approaches slides pdf template with various stages. Focus and dispense information on two stages using this creative set, that comes with editable features. It contains large content boxes to add your information on topics like scrum, kanban, meetings work progress, key performance indicators, roles. You can also showcase facts, figures, and other relevant content using this PPT layout. Grab it now.
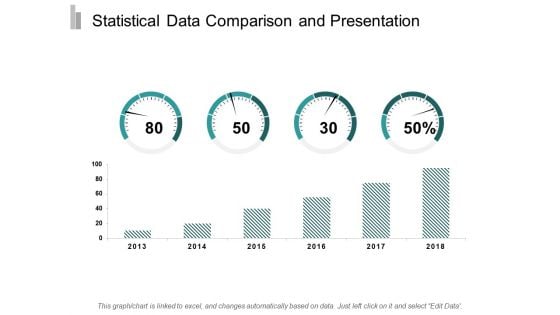
Statistical Data Comparison And Presentation Ppt Powerpoint Presentation Gallery Backgrounds
This is a statistical data comparison and presentation ppt powerpoint presentation gallery backgrounds. This is a two stage process. The stages in this process are data presentation, content presentation, information presentation.
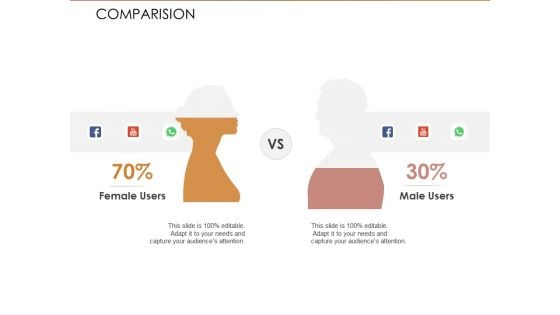
Quality Analysis Of Github Projects Comparison Ppt Outline Rules PDF
Presenting this set of slides with name quality analysis of github projects comparison ppt outline rules pdf. This is a two stage process. The stages in this process are male users, female users. This is a completely editable PowerPoint presentation and is available for immediate download. Download now and impress your audience.
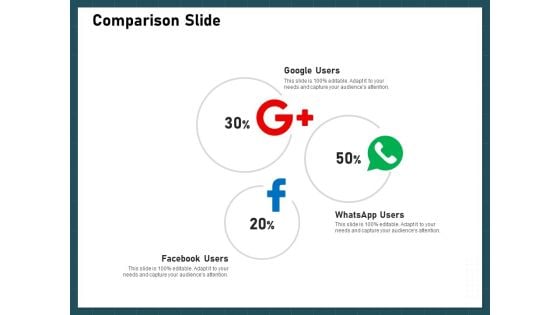
Strategies To Win Customers From Competitors Comparison Slide Brochure PDF
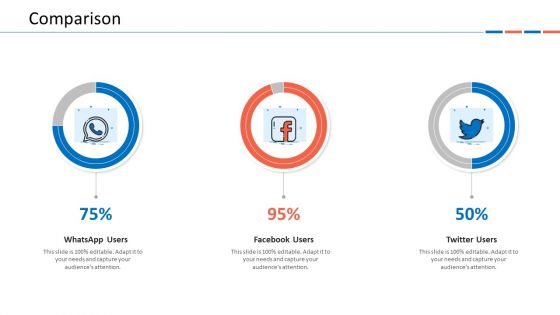
This is a strategies to win customers from competitors comparison slide brochure pdf template with various stages. Focus and dispense information on three stages using this creative set, that comes with editable features. It contains large content boxes to add your information on topics like google users, whatsapp users, facebook users. You can also showcase facts, figures, and other relevant content using this PPT layout. Grab it now.
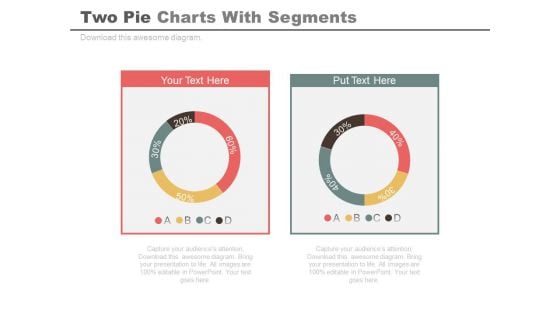
Two Pie Charts For Comparison And Analysis Powerpoint Slides
Develop competitive advantage with our above template of two pie charts. This PowerPoint diagram provides an effective way of displaying business information. You can edit text, color, shade and style as per you need.
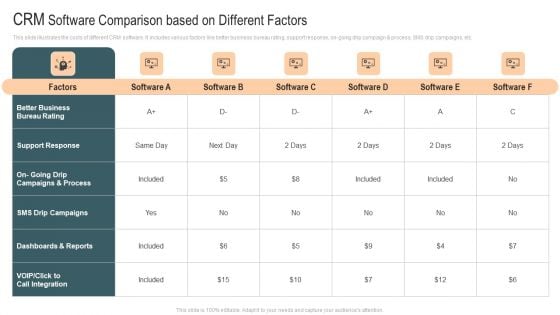
CRM Software Comparison Based On Different Factors Demonstration PDF
This slide illustrates the costs of different CRM software. It includes various factors like better business bureau rating, support response, on going drip campaign and process, SMS drip campaigns, etc. Showcasing this set of slides titled CRM Software Comparison Based On Different Factors Demonstration PDF. The topics addressed in these templates are Dashboards, Business Bureau Rating, CRM Software Comparison. All the content presented in this PPT design is completely editable. Download it and make adjustments in color, background, font etc. as per your unique business setting.

CRM Different Software Product Comparison Chart Portrait PDF
This slide indicates product comparison of two different software. It includes variables like free trial, contact management, deal management, task management, social integration, email integration, analytics and dashboards, etc. Presenting CRM Different Software Product Comparison Chart Portrait PDF to dispense important information. This template comprises three stages. It also presents valuable insights into the topics including Deal Management, Task Management, Advertising Management. This is a completely customizable PowerPoint theme that can be put to use immediately. So, download it and address the topic impactfully.
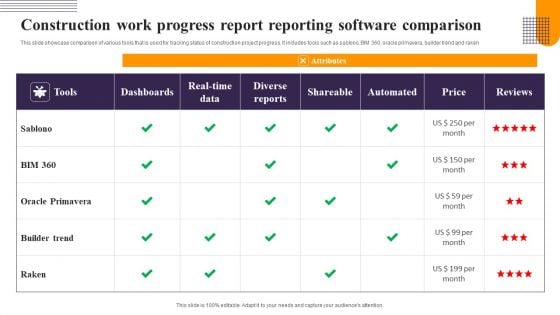
Construction Work Progress Report Reporting Software Comparison Professional PDF
This slide showcase comparison of various tools that is used for tracking status of construction project progress. It includes tools such as sablono, BIM 360, oracle primavera, builder trend and raken Showcasing this set of slides titled Construction Work Progress Report Reporting Software Comparison Professional PDF. The topics addressed in these templates are Tools, Dashboards, Attributes . All the content presented in this PPT design is completely editable. Download it and make adjustments in color, background, font etc. as per your unique business setting.
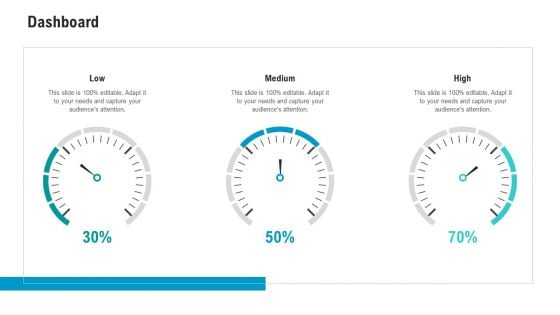
API Ecosystem Dashboard Clipart PDF
This is a api ecosystem dashboard clipart pdf template with various stages. Focus and dispense information on three stages using this creative set, that comes with editable features. It contains large content boxes to add your information on topics like dashboard. You can also showcase facts, figures, and other relevant content using this PPT layout. Grab it now.
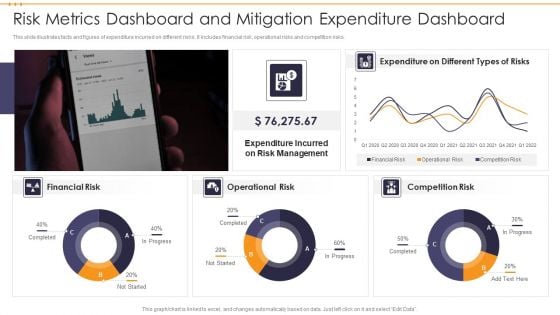
Risk Metrics Dashboard And Mitigation Expenditure Dashboard Ideas PDF
This slide illustrates facts and figures of expenditure incurred on different risks. It includes financial risk, operational risks and competition risks. Pitch your topic with ease and precision using this Risk Metrics Dashboard And Mitigation Expenditure Dashboard Ideas PDF. This layout presents information on Management, Expenditure, Risk. It is also available for immediate download and adjustment. So, changes can be made in the color, design, graphics or any other component to create a unique layout.

Retail Expenditure Dashboard And Performance Dashboard Formats PDF
This slide enables to track quarterly performance and return on marketing expenditure of online marketing executed by an organization. It includes source wise performance report , return on investment, sales funnel, average order value report etc. Pitch your topic with ease and precision using this Retail Expenditure Dashboard And Performance Dashboard Formats PDF. This layout presents information on Return On Investment, Product Sales, Revenue. It is also available for immediate download and adjustment. So, changes can be made in the color, design, graphics or any other component to create a unique layout.
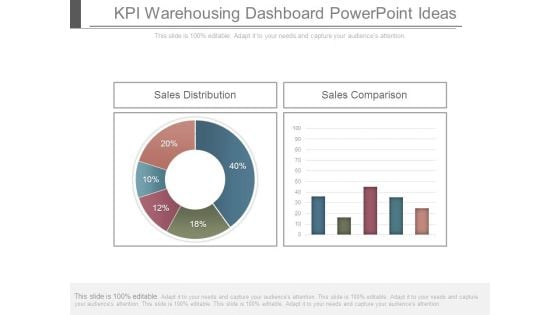
Kpi Warehousing Dashboard Powerpoint Ideas
This is a kpi warehousing dashboard powerpoint ideas. This is a two stage process. The stages in this process are sales distribution, sales comparison.
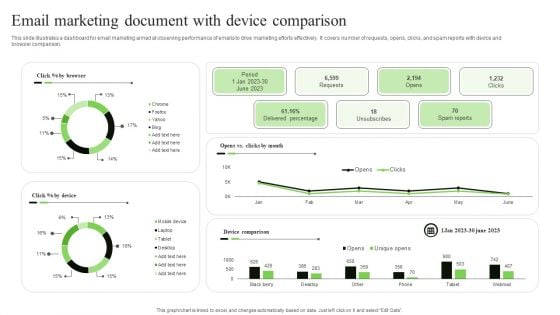
Email Marketing Document With Device Comparison Inspiration PDF
This slide illustrates a dashboard for email marketing aimed at observing performance of emails to drive marketing efforts effectively. It covers number of requests, opens, clicks, and spam reports with device and browser comparison. Showcasing this set of slides titled Email Marketing Document With Device Comparison Inspiration PDF. The topics addressed in these templates are Device Comparison, Requests, Unsubscribes. All the content presented in this PPT design is completely editable. Download it and make adjustments in color, background, font etc. as per your unique business setting.
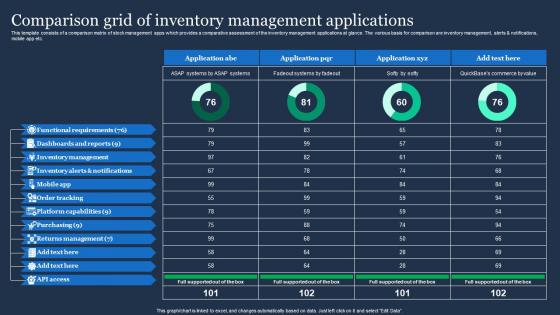
Comparison Grid Of Inventory Management Applications Clipart Pdf
This template consists of a comparison matrix of stock management apps which provides a comparative assessment of the inventory management applications at glance. The various basis for comparison are inventory management, alerts and notifications, mobile app etc. Showcasing this set of slides titled Comparison Grid Of Inventory Management Applications Clipart Pdf. The topics addressed in these templates are Functional Requirements, Dashboards And Reports, Inventory Management. All the content presented in this PPT design is completely editable. Download it and make adjustments in color, background, font etc. as per your unique business setting. This template consists of a comparison matrix of stock management apps which provides a comparative assessment of the inventory management applications at glance. The various basis for comparison are inventory management, alerts and notifications, mobile app etc.
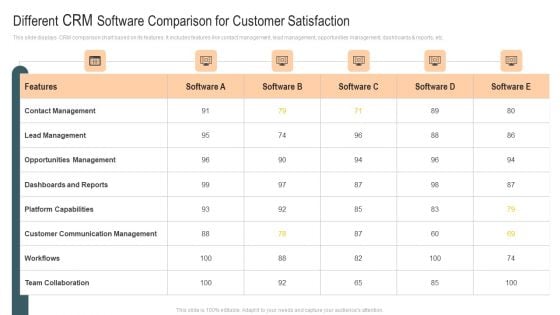
Different CRM Software Comparison For Customer Satisfaction Brochure PDF
This slide displays CRM comparison chart based on its features. It includes features like contact management, lead management, opportunities management, dashboards and reports, etc. Pitch your topic with ease and precision using this Different CRM Software Comparison For Customer Satisfaction Brochure PDF. This layout presents information on Opportunities Management, Lead Management, Customer Communication Management. It is also available for immediate download and adjustment. So, changes can be made in the color, design, graphics or any other component to create a unique layout.
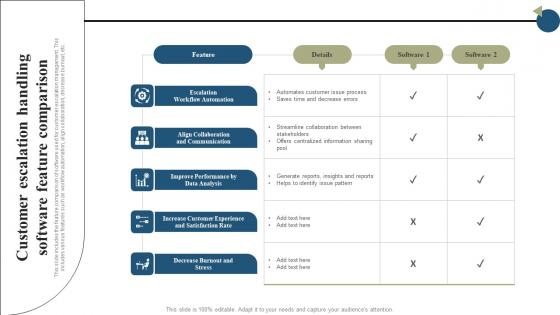
Customer Escalation Handling Software Feature Comparison Designs Pdf
This slide includes the feature comparison of software used for customer escalation management. This includes various features such as workflow automation, align collaboration, decrease burnout, etc. Showcasing this set of slides titled Customer Escalation Handling Software Feature Comparison Designs Pdf The topics addressed in these templates are Workflow Automation, Improve Performance, Data Analysis All the content presented in this PPT design is completely editable. Download it and make adjustments in color, background, font etc. as per your unique business setting. This slide includes the feature comparison of software used for customer escalation management. This includes various features such as workflow automation, align collaboration, decrease burnout, etc.
Comparison Ppt PowerPoint Presentation Infographic Template Graphics Tutorials
This is a comparison ppt powerpoint presentation infographic template graphics tutorials. This is a two stage process. The stages in this process are comparison, planning, business, management, marketing.
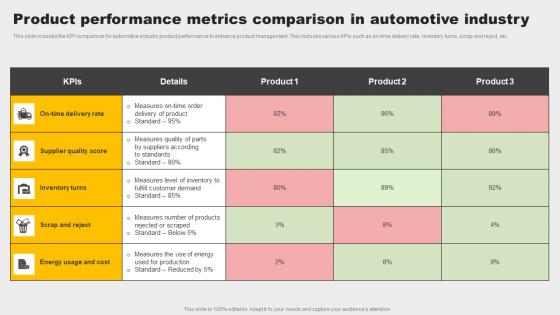
Product Performance Metrics Comparison In Automotive Industry Topics Pdf
This slide includes the KPI comparison for automotive industry product performance to enhance product management. This includes various KPIs such as on time delivery rate, inventory turns, scrap and reject, etc. Showcasing this set of slides titled Product Performance Metrics Comparison In Automotive Industry Topics Pdf. The topics addressed in these templates are Inventory Turns, Supplier Quality Score, Energy Usage And Cost. All the content presented in this PPT design is completely editable. Download it and make adjustments in color, background, font etc. as per your unique business setting. This slide includes the KPI comparison for automotive industry product performance to enhance product management. This includes various KPIs such as on time delivery rate, inventory turns, scrap and reject, etc.

 Home
Home