Data Analytics Icons
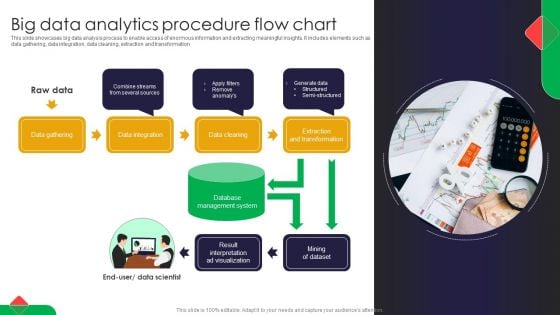
Big Data Analytics Procedure Flow Chart Portrait PDF
This slide showcases big data analysis process to enable access of enormous information and extracting meaningful insights. It includes elements such as data gathering, data integration, data cleaning, extraction and transformation Pitch your topic with ease and precision using this Big Data Analytics Procedure Flow Chart Portrait PDF. This layout presents information on Raw Data, Flow Chart, Big Data. It is also available for immediate download and adjustment. So, changes can be made in the color, design, graphics or any other component to create a unique layout.
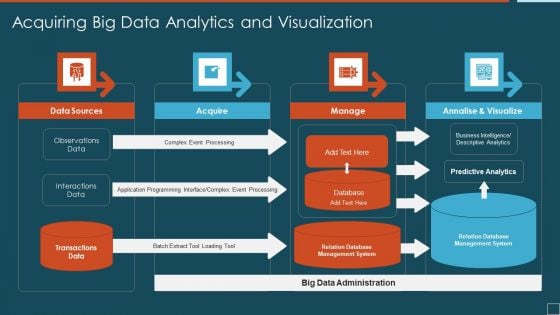
Acquiring Big Data Analytics And Visualization Ideas PDF
Presenting acquiring big data analytics and visualization ideas pdf to dispense important information. This template comprises four stages. It also presents valuable insights into the topics including data sources, acquire, manage. This is a completely customizable PowerPoint theme that can be put to use immediately. So, download it and address the topic impactfully.
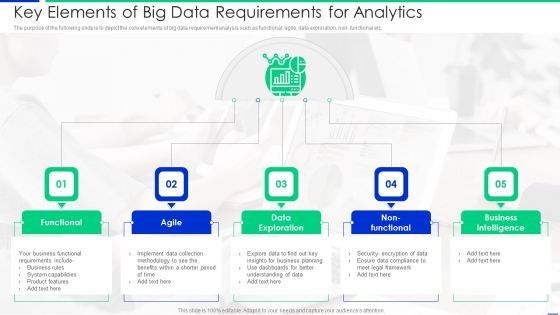
Key Elements Of Big Data Requirements For Analytics Mockup PDF
The purpose of the following slide is to depict the core elements of big data requirement analysis such as functional, agile, data exploration, non functional etc. Presenting key elements of big data requirements for analytics mockup pdf to dispense important information. This template comprises five stages. It also presents valuable insights into the topics including functional, data exploration, business intelligence. This is a completely customizable PowerPoint theme that can be put to use immediately. So, download it and address the topic impactfully.
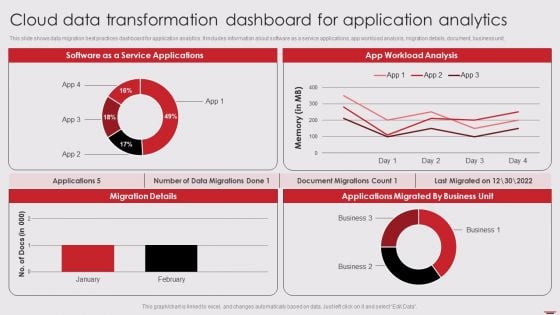
Cloud Data Transformation Dashboard For Application Analytics Information PDF
This slide shows data migration best practices dashboard for application analytics. It includes information about software as a service applications, app workload analysis, migration details, document, business unit. Pitch your topic with ease and precision using this Cloud Data Transformation Dashboard For Application Analytics Information PDF. This layout presents information on Software Service Applications, App Workload Analysis, Migration Details. It is also available for immediate download and adjustment. So, changes can be made in the color, design, graphics or any other component to create a unique layout.
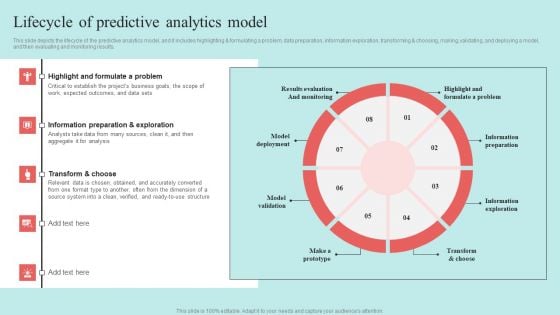
Predictive Data Model Lifecycle Of Predictive Analytics Model Diagrams PDF
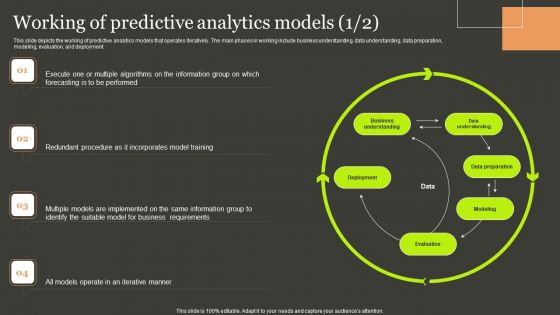
Predictive Analytics Methods Working Of Predictive Analytics Models Summary PDF
This slide depicts the working of predictive analytics models that operates iteratively. The main phases in working include business understanding, data understanding, data preparation, modeling, evaluation, and deployment. Find highly impressive Predictive Analytics Methods Working Of Predictive Analytics Models Summary PDF on Slidegeeks to deliver a meaningful presentation. You can save an ample amount of time using these presentation templates. No need to worry to prepare everything from scratch because Slidegeeks experts have already done a huge research and work for you. You need to download Predictive Analytics Methods Working Of Predictive Analytics Models Summary PDF for your upcoming presentation. All the presentation templates are 100 percent editable and you can change the color and personalize the content accordingly. Download now.
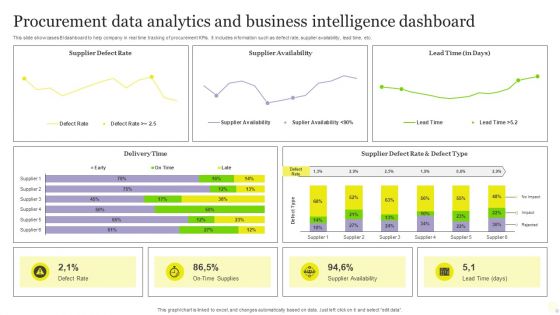
Procurement Data Analytics And Business Intelligence Dashboard Pictures PDF
This slide showcases BI dashboard to help company in real time tracking of procurement KPIs. It includes information such as defect rate, supplier availability, lead time, etc. Pitch your topic with ease and precision using this Procurement Data Analytics And Business Intelligence Dashboard Pictures PDF. This layout presents information on Procurement Data Analytics, Business Intelligence Dashboard. It is also available for immediate download and adjustment. So, changes can be made in the color, design, graphics or any other component to create a unique layout.
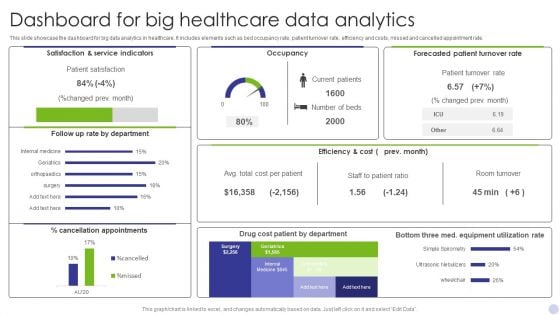
Dashboard For Big Healthcare Data Analytics Graphics PDF
This slide showcase the dashboard for big data analytics in healthcare. It includes elements such as bed occupancy rate, patient turnover rate, efficiency and costs, missed and cancelled appointment rate. Showcasing this set of slides titled Dashboard For Big Healthcare Data Analytics Graphics PDF. The topics addressed in these templates are Satisfaction Service Indicators, Occupancy, Forecasted Patient Turnover. All the content presented in this PPT design is completely editable. Download it and make adjustments in color, background, font etc. as per your unique business setting.
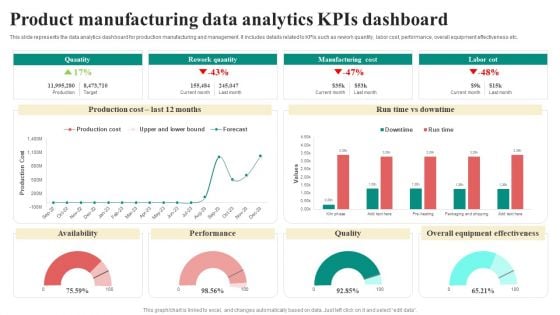
Product Manufacturing Data Analytics Kpis Dashboard Guidelines PDF
This slide represents the data analytics dashboard for production manufacturing and management. It includes details related to KPIs such as rework quantity, labor cost, performance, overall equipment effectiveness etc. Showcasing this set of slides titled Product Manufacturing Data Analytics Kpis Dashboard Guidelines PDF. The topics addressed in these templates are Quantity, Rework Quantity, Manufacturing Cost, Labor Cot. All the content presented in this PPT design is completely editable. Download it and make adjustments in color, background, font etc. as per your unique business setting.
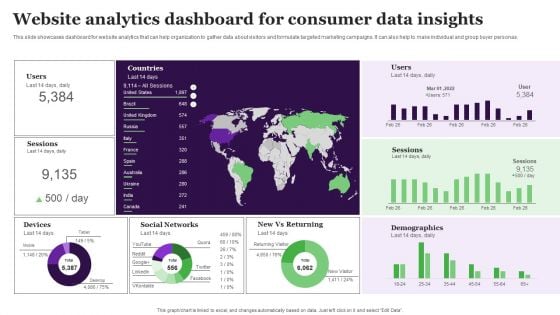
Website Analytics Dashboard For Consumer Data Insights Clipart PDF
This slide showcases dashboard for website analytics that can help organization to gather data about visitors and formulate targeted marketing campaigns. It can also help to make individual and group buyer personas. Want to ace your presentation in front of a live audience Our Website Analytics Dashboard For Consumer Data Insights Clipart PDF can help you do that by engaging all the users towards you.. Slidegeeks experts have put their efforts and expertise into creating these impeccable powerpoint presentations so that you can communicate your ideas clearly. Moreover, all the templates are customizable, and easy-to-edit and downloadable. Use these for both personal and commercial use.
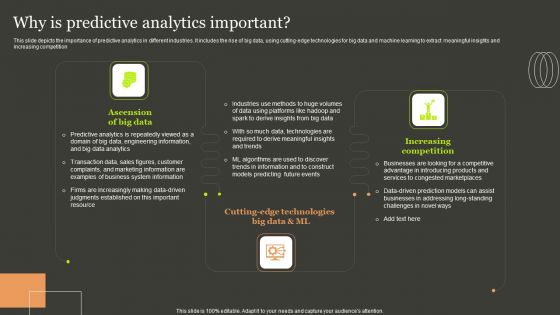
Predictive Analytics Methods Why Is Predictive Analytics Important Ideas PDF
This slide depicts the importance of predictive analytics in different industries. It includes the rise of big data, using cutting-edge technologies for big data and machine learning to extract meaningful insights and increasing competition. Whether you have daily or monthly meetings, a brilliant presentation is necessary. Predictive Analytics Methods Why Is Predictive Analytics Important Ideas PDF can be your best option for delivering a presentation. Represent everything in detail using Predictive Analytics Methods Why Is Predictive Analytics Important Ideas PDF and make yourself stand out in meetings. The template is versatile and follows a structure that will cater to your requirements. All the templates prepared by Slidegeeks are easy to download and edit. Our research experts have taken care of the corporate themes as well. So, give it a try and see the results.
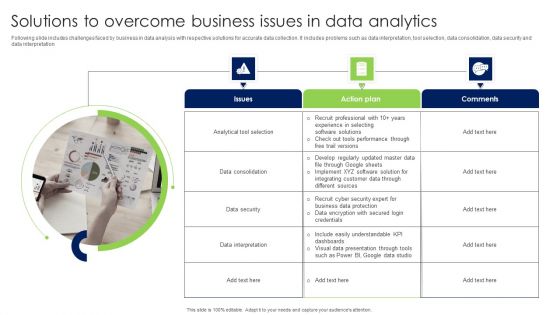
Solutions To Overcome Business Issues In Data Analytics Infographics PDF
Following slide includes challenges faced by business in data analysis with respective solutions for accurate data collection. It includes problems such as data interpretation, tool selection, data consolidation, data security and data interpretation Presenting Solutions To Overcome Business Issues In Data Analytics Infographics PDF to dispense important information. This template comprises Three stages. It also presents valuable insights into the topics including Issues, Action Plan, Comments. This is a completely customizable PowerPoint theme that can be put to use immediately. So, download it and address the topic impactfully.
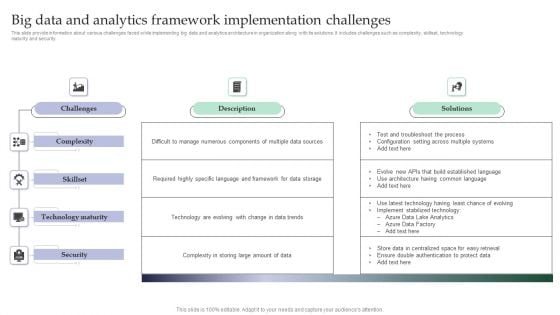
Big Data And Analytics Framework Implementation Challenges Themes PDF
This slide provide information about various challenges faced while implementing big data and analytics architecture in organization along with its solutions. It includes challenges such as complexity, skillset, technology maturity and security Pitch your topic with ease and precision using this Big Data And Analytics Framework Implementation Challenges Themes PDF. This layout presents information on Challenges, Description, Solutions . It is also available for immediate download and adjustment. So, changes can be made in the color, design, graphics or any other component to create a unique layout.
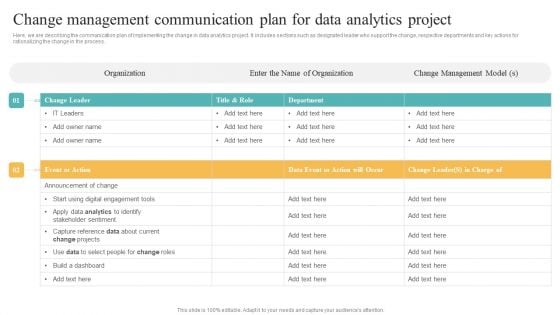
Change Management Communication Plan For Data Analytics Project Topics PDF
Here, we are describing the communication plan of implementing the change in data analytics project. It includes sections such as designated leader who support the change, respective departments and key actions for rationalizing the change in the process. If you are looking for a format to display your unique thoughts, then the professionally designed Change Management Communication Plan For Data Analytics Project Topics PDF is the one for you. You can use it as a Google Slides template or a PowerPoint template. Incorporate impressive visuals, symbols, images, and other charts. Modify or reorganize the text boxes as you desire. Experiment with shade schemes and font pairings. Alter, share or cooperate with other people on your work. Download Change Management Communication Plan For Data Analytics Project Topics PDF and find out how to give a successful presentation. Present a perfect display to your team and make your presentation unforgettable.
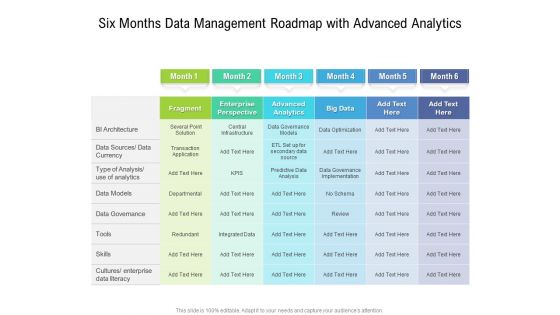
Six Months Data Management Roadmap With Advanced Analytics Information
We present our six months data management roadmap with advanced analytics information. This PowerPoint layout is easy-to-edit so you can change the font size, font type, color, and shape conveniently. In addition to this, the PowerPoint layout is Google Slides compatible, so you can share it with your audience and give them access to edit it. Therefore, download and save this well-researched six months data management roadmap with advanced analytics information in different formats like PDF, PNG, and JPG to smoothly execute your business plan.
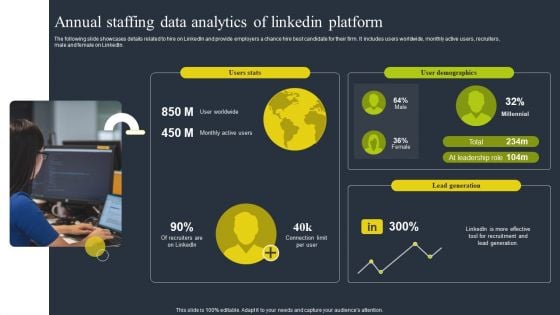
Annual Staffing Data Analytics Of Linkedin Platform Summary PDF
The following slide showcases details related to hire on LinkedIn and provide employers a chance hire best candidate for their firm. It includes users worldwide, monthly active users, recruiters, male and female on LinkedIn. Presenting Annual Staffing Data Analytics Of Linkedin Platform Summary PDF to dispense important information. This template comprises one stages. It also presents valuable insights into the topics including Annual Staffing Data Analytics, Linkedin Platform. This is a completely customizable PowerPoint theme that can be put to use immediately. So, download it and address the topic impactfully.
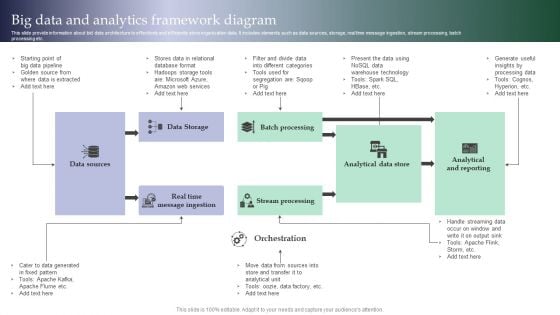
Big Data And Analytics Framework Diagram Introduction PDF
This slide provide information about bid data architecture to effectively and efficiently store organization data. It includes elements such as data sources, storage, real time message ingestion, stream processing, batch processing etc. Showcasing this set of slides titled Big Data And Analytics Framework Diagram Introduction PDF. The topics addressed in these templates are Data Sources, Data Storage, Batch Processing. All the content presented in this PPT design is completely editable. Download it and make adjustments in color, background, font etc. as per your unique business setting.
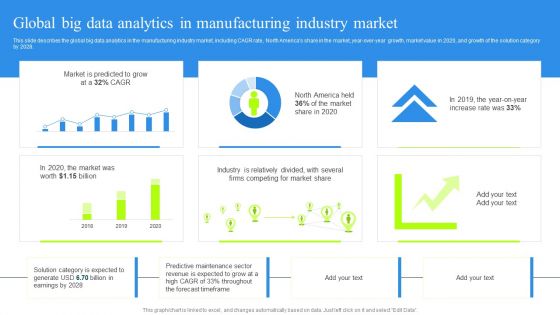
Global Big Data Analytics In Manufacturing Industry Market Pictures PDF
This slide describes the global big data analytics in the manufacturing industry market, including CAGR rate, North Americas share in the market, year-over-year growth, market value in 2020, and growth of the solution category by 2028. Find a pre-designed and impeccable Global Big Data Analytics In Manufacturing Industry Market Pictures PDF. The templates can ace your presentation without additional effort. You can download these easy-to-edit presentation templates to make your presentation stand out from others. So, what are you waiting for Download the template from Slidegeeks today and give a unique touch to your presentation.
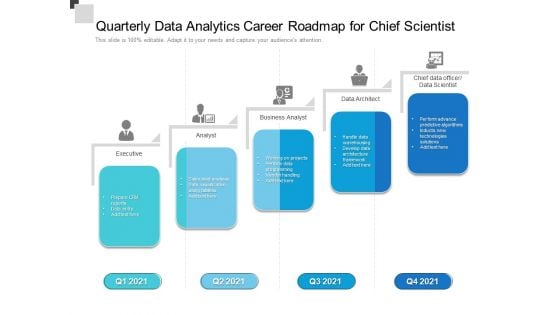
Quarterly Data Analytics Career Roadmap For Chief Scientist Infographics
We present our quarterly data analytics career roadmap for chief scientist infographics. This PowerPoint layout is easy-to-edit so you can change the font size, font type, color, and shape conveniently. In addition to this, the PowerPoint layout is Google Slides compatible, so you can share it with your audience and give them access to edit it. Therefore, download and save this well-researched quarterly data analytics career roadmap for chief scientist infographics in different formats like PDF, PNG, and JPG to smoothly execute your business plan.

Five Years Data Analytics Career Roadmap For Chief Scientist Microsoft
We present our five years data analytics career roadmap for chief scientist microsoft. This PowerPoint layout is easy-to-edit so you can change the font size, font type, color, and shape conveniently. In addition to this, the PowerPoint layout is Google Slides compatible, so you can share it with your audience and give them access to edit it. Therefore, download and save this well-researched five years data analytics career roadmap for chief scientist microsoft in different formats like PDF, PNG, and JPG to smoothly execute your business plan.
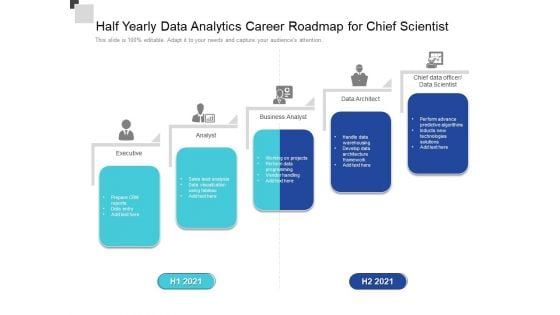
Half Yearly Data Analytics Career Roadmap For Chief Scientist Download
We present our half yearly data analytics career roadmap for chief scientist download. This PowerPoint layout is easy-to-edit so you can change the font size, font type, color, and shape conveniently. In addition to this, the PowerPoint layout is Google Slides compatible, so you can share it with your audience and give them access to edit it. Therefore, download and save this well-researched half yearly data analytics career roadmap for chief scientist download in different formats like PDF, PNG, and JPG to smoothly execute your business plan.
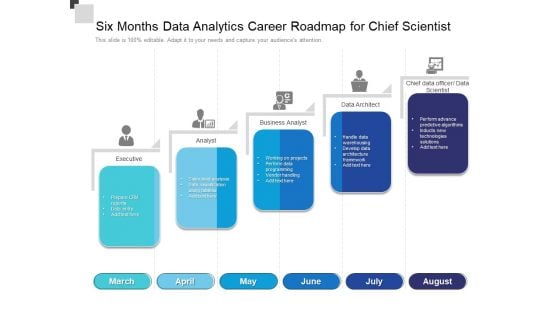
Six Months Data Analytics Career Roadmap For Chief Scientist Portrait
We present our six months data analytics career roadmap for chief scientist portrait. This PowerPoint layout is easy-to-edit so you can change the font size, font type, color, and shape conveniently. In addition to this, the PowerPoint layout is Google Slides compatible, so you can share it with your audience and give them access to edit it. Therefore, download and save this well-researched six months data analytics career roadmap for chief scientist portrait in different formats like PDF, PNG, and JPG to smoothly execute your business plan.
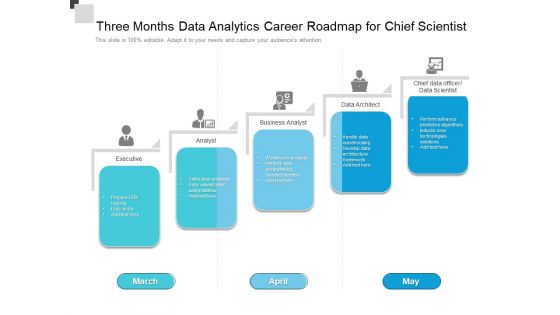
Three Months Data Analytics Career Roadmap For Chief Scientist Graphics
We present our three months data analytics career roadmap for chief scientist graphics. This PowerPoint layout is easy-to-edit so you can change the font size, font type, color, and shape conveniently. In addition to this, the PowerPoint layout is Google Slides compatible, so you can share it with your audience and give them access to edit it. Therefore, download and save this well-researched three months data analytics career roadmap for chief scientist graphics in different formats like PDF, PNG, and JPG to smoothly execute your business plan.
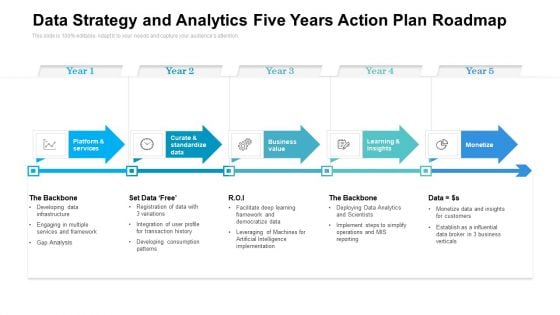
Data Strategy And Analytics Five Years Action Plan Roadmap Graphics
We present our data strategy and analytics five years action plan roadmap graphics. This PowerPoint layout is easy to edit so you can change the font size, font type, color, and shape conveniently. In addition to this, the PowerPoint layout is Google Slides compatible, so you can share it with your audience and give them access to edit it. Therefore, download and save this well researched data strategy and analytics five years action plan roadmap graphics in different formats like PDF, PNG, and JPG to smoothly execute your business plan.
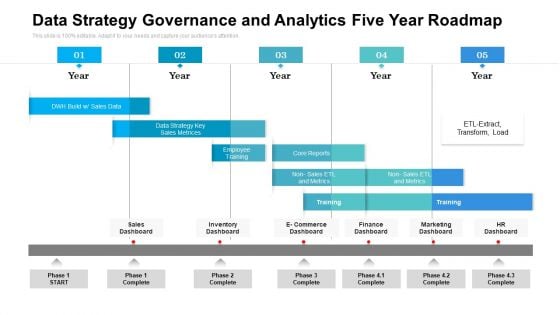
Data Strategy Governance And Analytics Five Year Roadmap Portrait
We present our data strategy governance and analytics five year roadmap portrait. This PowerPoint layout is easy to edit so you can change the font size, font type, color, and shape conveniently. In addition to this, the PowerPoint layout is Google Slides compatible, so you can share it with your audience and give them access to edit it. Therefore, download and save this well researched data strategy governance and analytics five year roadmap portrait in different formats like PDF, PNG, and JPG to smoothly execute your business plan.

Multistep Strategy Data Analytics Five Year Roadmap Demonstration
We present our multistep strategy data analytics five year roadmap demonstration. This PowerPoint layout is easy to edit so you can change the font size, font type, color, and shape conveniently. In addition to this, the PowerPoint layout is Google Slides compatible, so you can share it with your audience and give them access to edit it. Therefore, download and save this well researched multistep strategy data analytics five year roadmap demonstration in different formats like PDF, PNG, and JPG to smoothly execute your business plan.
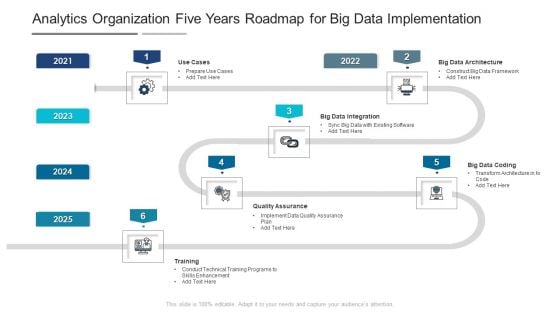
Analytics Organization Five Years Roadmap For Big Data Implementation Portrait
We present our analytics organization five years roadmap for big data implementation portrait. This PowerPoint layout is easy to edit so you can change the font size, font type, color, and shape conveniently. In addition to this, the PowerPoint layout is Google Slides compatible, so you can share it with your audience and give them access to edit it. Therefore, download and save this well researched analytics organization five years roadmap for big data implementation portrait in different formats like PDF, PNG, and JPG to smoothly execute your business plan.
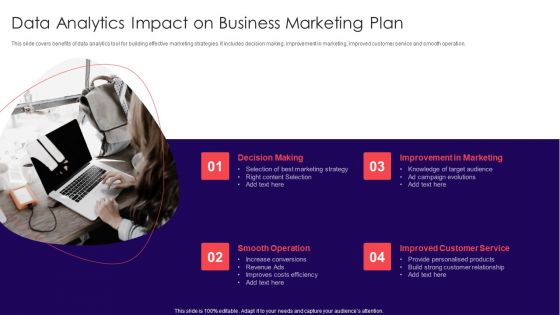
Data Analytics Impact On Business Marketing Plan Mockup PDF
This slide covers benefits of data analytics tool for building effective marketing strategies. It includes decision making, improvement in marketing, improved customer service and smooth operation. Presenting Data Analytics Impact On Business Marketing Plan Mockup PDF to dispense important information. This template comprises four stages. It also presents valuable insights into the topics including Decision Making, Improvement In Marketing, Improved Customer Service. This is a completely customizable PowerPoint theme that can be put to use immediately. So, download it and address the topic impactfully.
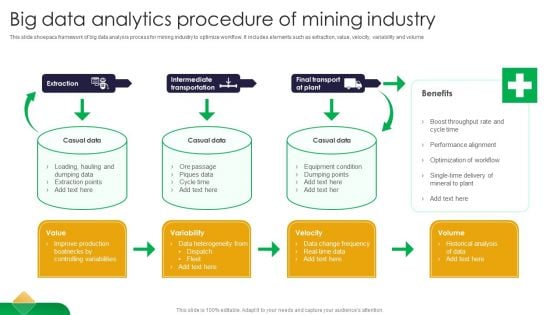
Big Data Analytics Procedure Of Mining Industry Download PDF
This slide shoepacs framework of big data analysis process for mining industry to optimize workflow. It includes elements such as extraction, value, velocity, variability and volume Presenting Big Data Analytics Procedure Of Mining Industry Download PDF to dispense important information. This template comprises three stages. It also presents valuable insights into the topics including Extraction, Casual Data, Industry. This is a completely customizable PowerPoint theme that can be put to use immediately. So, download it and address the topic impactfully.
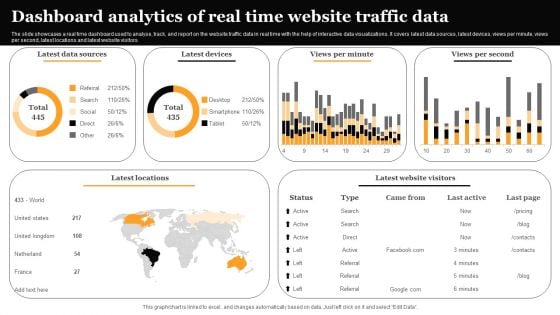
Dashboard Analytics Of Real Time Website Traffic Data Information PDF
The slide showcases a real time dashboard used to analyse, track, and report on the website traffic data in real time with the help of interactive data visualizations. It covers latest data sources, latest devices, views per minute, views per second, latest locations and latest website visitors. Showcasing this set of slides titled Dashboard Analytics Of Real Time Website Traffic Data Information PDF. The topics addressed in these templates are Latest Data Sources, Latest Devices, Views Per Second. All the content presented in this PPT design is completely editable. Download it and make adjustments in color, background, font etc. as per your unique business setting.
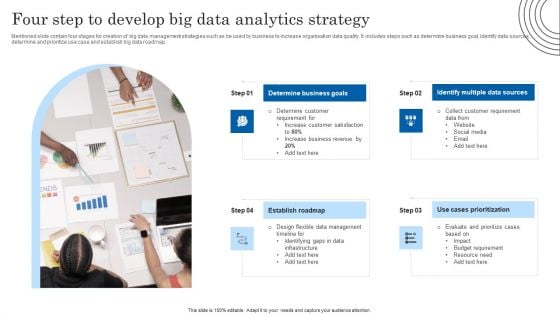
Four Step To Develop Big Data Analytics Strategy Designs PDF
Mentioned slide contain four stages for creation of big data management strategies such as be used by business to increase organisation data quality. It includes steps such as determine business goal, identify data sources, determine and prioritize use case and establish big data roadmap. Presenting Four Step To Develop Big Data Analytics Strategy Designs PDF to dispense important information. This template comprises four stages. It also presents valuable insights into the topics including Determine Business Goals, Multiple Data Sources, Cases Prioritization. This is a completely customizable PowerPoint theme that can be put to use immediately. So, download it and address the topic impactfully.
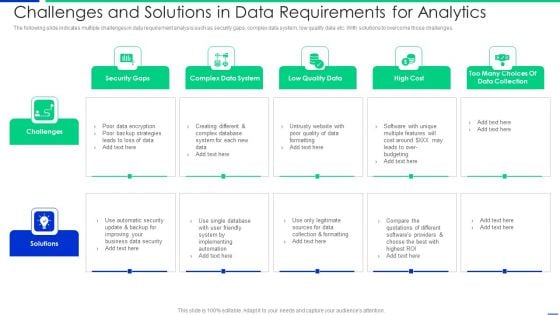
Challenges And Solutions In Data Requirements For Analytics Slides PDF
The following slide indicates multiple challenges in data requirement analysis such as security gaps, complex data system, low quality data etc. With solutions to overcome those challenges. Presenting challenges and solutions in data requirements for analytics slides pdf to dispense important information. This template comprises five stages. It also presents valuable insights into the topics including security gaps, complex data system, low quality data. This is a completely customizable PowerPoint theme that can be put to use immediately. So, download it and address the topic impactfully.
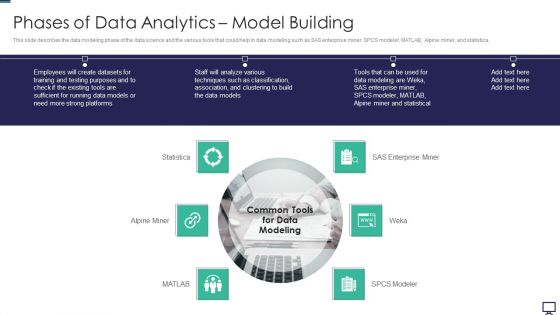
Phases Of Data Analytics Model Building Ppt Portfolio Background PDF
This slide describes the data modeling phase of the data science and the various tools that could help in data modeling such as SAS enterprise miner, SPCS modeler, MATLAB, Alpine miner, and statistica. Presenting phases of data analytics model building ppt portfolio background pdf to provide visual cues and insights. Share and navigate important information on six stages that need your due attention. This template can be used to pitch topics like techniques, analyze, enterprise. In addtion, this PPT design contains high resolution images, graphics, etc, that are easily editable and available for immediate download.
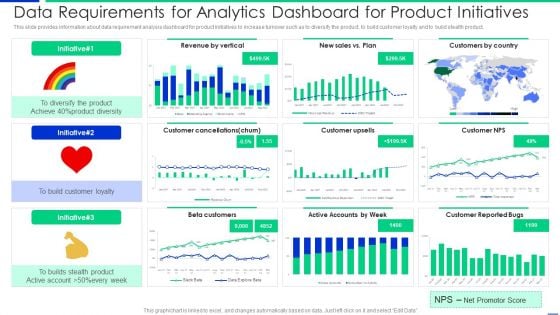
Data Requirements For Analytics Dashboard For Product Initiatives Clipart PDF
Showcasing this set of slides titled data requirements for analytics dashboard for product initiatives clipart pdf. The topics addressed in these templates are product, customer, revenue. All the content presented in this PPT design is completely editable. Download it and make adjustments in color, background, font etc. as per your unique business setting.
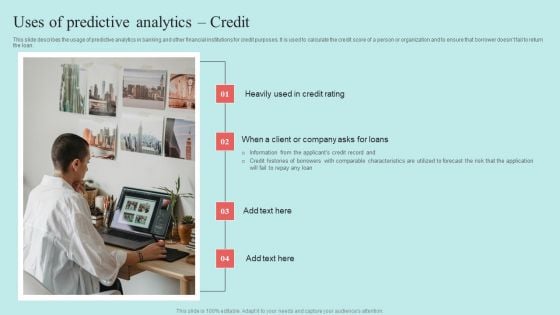
Predictive Data Model Uses Of Predictive Analytics Credit Information PDF
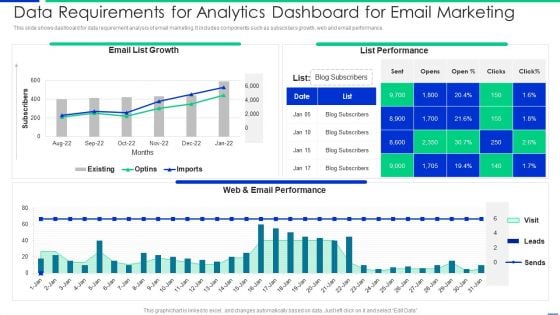
Data Requirements For Analytics Dashboard For Email Marketing Mockup PDF
This slide shows dashboard for data requirement analysis of email marketing. It includes components such as subscribers growth, web and email performance. Showcasing this set of slides titled data requirements for analytics dashboard for email marketing mockup pdf. The topics addressed in these templates are growth, performance. All the content presented in this PPT design is completely editable. Download it and make adjustments in color, background, font etc. as per your unique business setting.
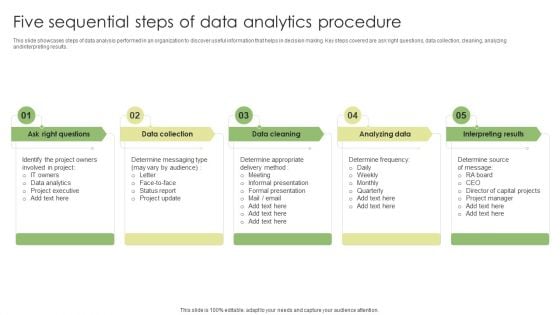
Five Sequential Steps Of Data Analytics Procedure Diagrams PDF
This slide showcases steps of data analysis performed in an organization to discover useful information that helps in decision making. Key steps covered are ask right questions, data collection, cleaning, analyzing and interpreting results. Persuade your audience using this Five Sequential Steps Of Data Analytics Procedure Diagrams PDF. This PPT design covers five stages, thus making it a great tool to use. It also caters to a variety of topics including Data Collection, Analyzing Data, Interpreting Results. Download this PPT design now to present a convincing pitch that not only emphasizes the topic but also showcases your presentation skills.
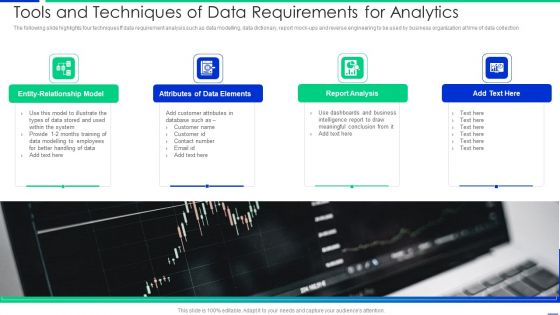
Tools And Techniques Of Data Requirements For Analytics Mockup PDF
The following slide highlights four techniques ff data requirement analysis such as data modelling, data dictionary, report mock-ups and reverse engineering to be used by business organization at time of data collection Presenting tools and techniques of data requirements for analytics mockup pdf to dispense important information. This template comprises four stages. It also presents valuable insights into the topics including system, customer, database. This is a completely customizable PowerPoint theme that can be put to use immediately. So, download it and address the topic impactfully.
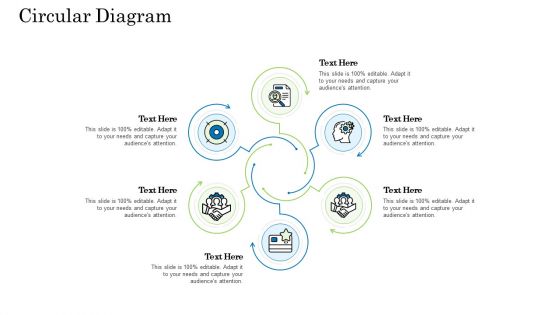
Customer Behavioral Data And Analytics Circular Diagram Download PDF
This is a customer behavioral data and analytics circular diagram download pdf template with various stages. Focus and dispense information on six stages using this creative set, that comes with editable features. It contains large content boxes to add your information on topics like circular diagram. You can also showcase facts, figures, and other relevant content using this PPT layout. Grab it now.
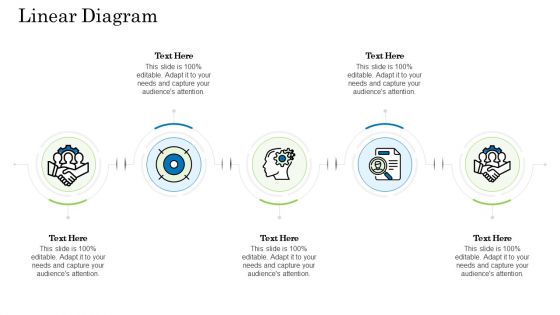
Customer Behavioral Data And Analytics Linear Diagram Microsoft PDF
This is a customer behavioral data and analytics linear diagram microsoft pdf template with various stages. Focus and dispense information on five stages using this creative set, that comes with editable features. It contains large content boxes to add your information on topics like linear diagram. You can also showcase facts, figures, and other relevant content using this PPT layout. Grab it now.
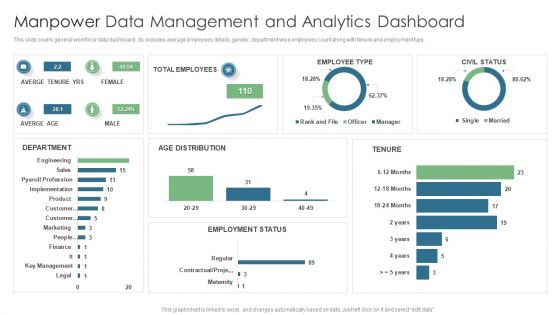
Manpower Data Management And Analytics Dashboard Topics PDF
This slide covers general workforce data dashboard . Its includes average employees details, gender, department wise employees count along with tenure and employment type. Pitch your topic with ease and precision using this Manpower Data Management And Analytics Dashboard Topics PDF. This layout presents information on Total Employees, Averge Tenure Yrs, Employee Type. It is also available for immediate download and adjustment. So, changes can be made in the color, design, graphics or any other component to create a unique layout.
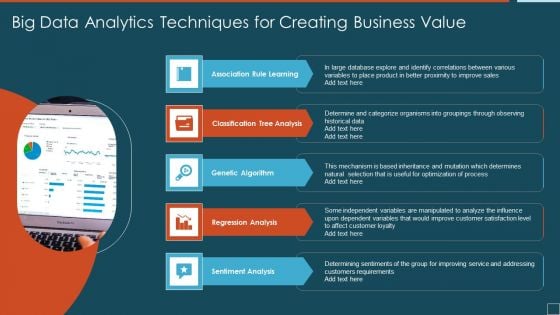
Big Data Analytics Techniques For Creating Business Value Sample PDF
Presenting big data analytics techniques for creating business value sample pdf to dispense important information. This template comprises five stages. It also presents valuable insights into the topics including association rule learning, classification tree analysis, genetic algorithm. This is a completely customizable PowerPoint theme that can be put to use immediately. So, download it and address the topic impactfully.
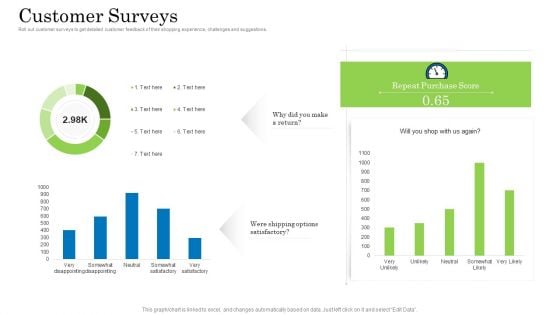
Customer Behavioral Data And Analytics Customer Surveys Information PDF
Roll out customer surveys to get detailed customer feedback of their shopping experience, challenges and suggestions. Deliver an awe inspiring pitch with this creative customer behavioral data and analytics customer surveys information pdf bundle. Topics like customer surveys can be discussed with this completely editable template. It is available for immediate download depending on the needs and requirements of the user.
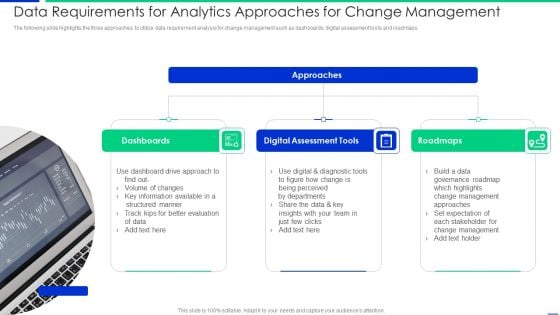
Data Requirements For Analytics Approaches For Change Management Topics PDF
The following slide highlights the three approaches to utilize data requirement analysis for change management such as dashboards, digital assessment tools and roadmaps. Presenting data requirements for analytics approaches for change management topics pdf to dispense important information. This template comprises three stages. It also presents valuable insights into the topics including dashboards, digital assessment tools, roadmaps. This is a completely customizable PowerPoint theme that can be put to use immediately. So, download it and address the topic impactfully.
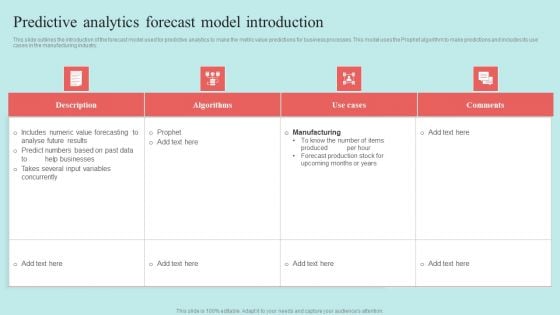
Predictive Data Model Predictive Analytics Forecast Model Introduction Themes PDF
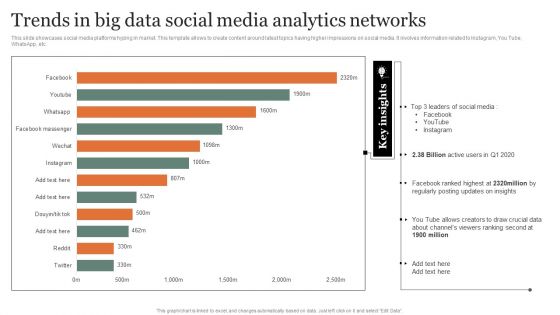
Trends In Big Data Social Media Analytics Networks Guidelines PDF
This slide showcases social media platforms hyping in market. This template allows to create content around latest topics having higher impressions on social media. It involves information related to Instagram, You Tube, WhatsApp, etc. Showcasing this set of slides titled Trends In Big Data Social Media Analytics Networks Guidelines PDF Topics. The topics addressed in these templates are Analytics Networks, Posting Updates, Ranking Second. All the content presented in this PPT design is completely editable. Download it and make adjustments in color, background, font etc. as per your unique business setting.
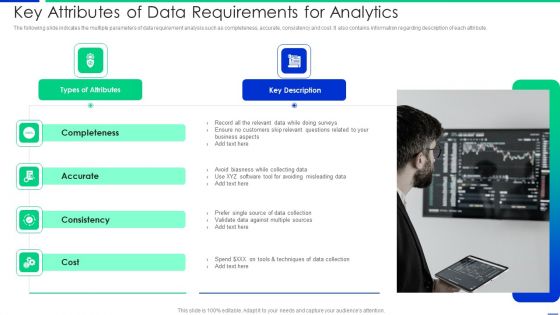
Key Attributes Of Data Requirements For Analytics Graphics PDF
The following slide indicates the multiple parameters of data requirement analysis such as completeness, accurate, consistency and cost. It also contains information regarding description of each attribute. Presenting key attributes of data requirements for analytics graphics pdf to dispense important information. This template comprises two stages. It also presents valuable insights into the topics including types of attributes, key description. This is a completely customizable PowerPoint theme that can be put to use immediately. So, download it and address the topic impactfully.
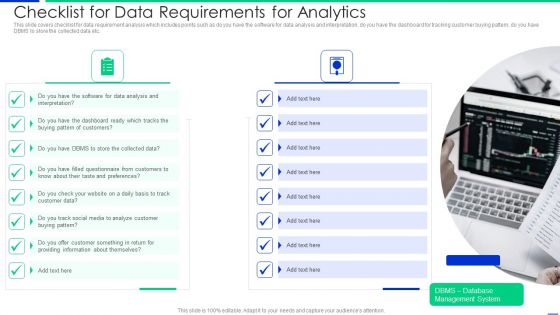
Checklist For Data Requirements For Analytics Information PDF
This slide covers checklist for data requirement analysis which includes points such as do you have the software for data analysis and interpretation, do you have the dashboard for tracking customer buying pattern, do you have DBMS to store the collected data etc. Presenting checklist for data requirements for analytics information pdf to dispense important information. This template comprises two stages. It also presents valuable insights into the topics including analysis, customers, dashboard. This is a completely customizable PowerPoint theme that can be put to use immediately. So, download it and address the topic impactfully.
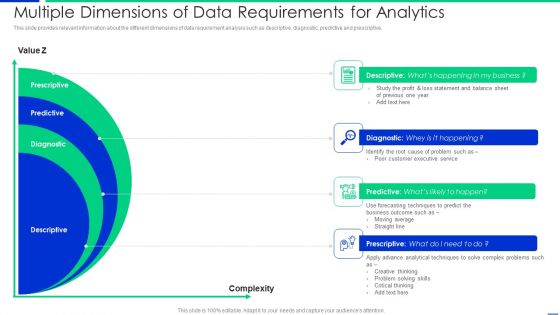
Multiple Dimensions Of Data Requirements For Analytics Slides PDF
This slide provides relevant information about the different dimensions of data requirement analysis such as descriptive, diagnostic, predictive and prescriptive. Presenting multiple dimensions of data requirements for analytics slides pdf to dispense important information. This template comprises four stages. It also presents valuable insights into the topics including average, business, techniques. This is a completely customizable PowerPoint theme that can be put to use immediately. So, download it and address the topic impactfully.
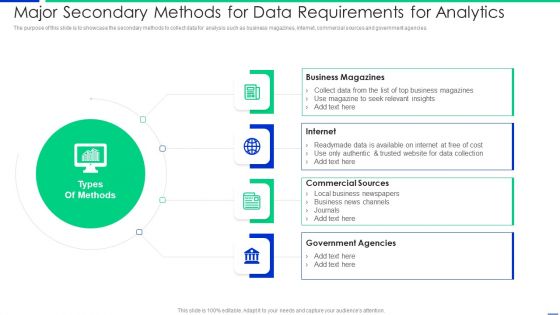
Major Secondary Methods For Data Requirements For Analytics Mockup PDF
The purpose of this slide is to showcase the secondary methods to collect data for analysis such as business magazines, internet, commercial sources and government agencies. Presenting major secondary methods for data requirements for analytics mockup pdf to dispense important information. This template comprises four stages. It also presents valuable insights into the topics including business magazines, internet, commercial sources. This is a completely customizable PowerPoint theme that can be put to use immediately. So, download it and address the topic impactfully.
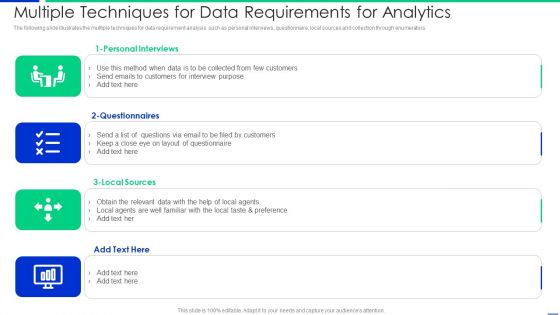
Multiple Techniques For Data Requirements For Analytics Elements PDF
The following slide illustrates the multiple techniques for data requirement analysis such as personal interviews, questionnaire, local sources and collection through enumerators. Presenting multiple techniques for data requirements for analytics elements pdf to dispense important information. This template comprises four stages. It also presents valuable insights into the topics including customers, email, sources. This is a completely customizable PowerPoint theme that can be put to use immediately. So, download it and address the topic impactfully.
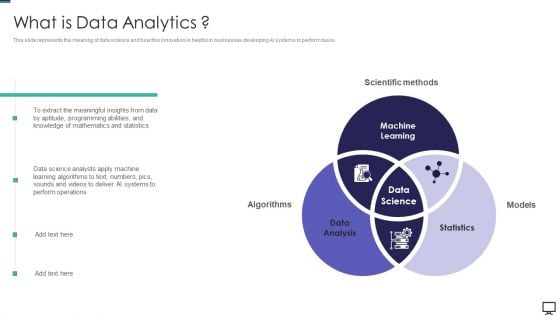
What Is Data Analytics Ppt Professional Slide PDF
This slide represents the meaning of data science and how this innovation is helpful in businesses developing AI systems to perform tasks. Presenting what is data analytics ppt professional slide pdf to provide visual cues and insights. Share and navigate important information on three stages that need your due attention. This template can be used to pitch topics like data analysis, statistics, machine learning. In addtion, this PPT design contains high resolution images, graphics, etc, that are easily editable and available for immediate download.
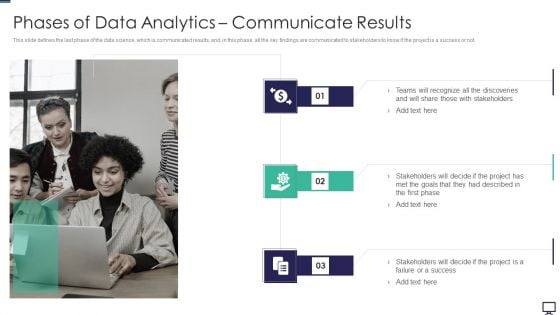
Phases Of Data Analytics Communicate Results Ppt Ideas Inspiration PDF
This slide defines the last phase of the data science, which is communicated results, and, in this phase, all the key findings are communicated to stakeholders to know if the project is a success or not. Presenting phases of data analytics communicate results ppt ideas inspiration pdf to provide visual cues and insights. Share and navigate important information on three stages that need your due attention. This template can be used to pitch topics like goals, project. In addtion, this PPT design contains high resolution images, graphics, etc, that are easily editable and available for immediate download.
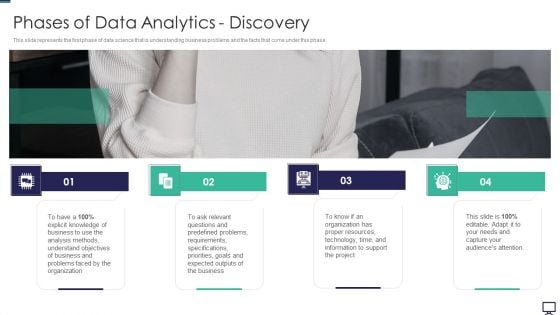
Phases Of Data Analytics Discovery Ppt Infographic Template Outfit PDF
This slide represents the first phase of data science that is understanding business problems and the facts that come under this phase. This is a phases of data analytics discovery ppt infographic template outfit pdf template with various stages. Focus and dispense information on four stages using this creative set, that comes with editable features. It contains large content boxes to add your information on topics like business, analysis, organization, requirements. You can also showcase facts, figures, and other relevant content using this PPT layout. Grab it now.
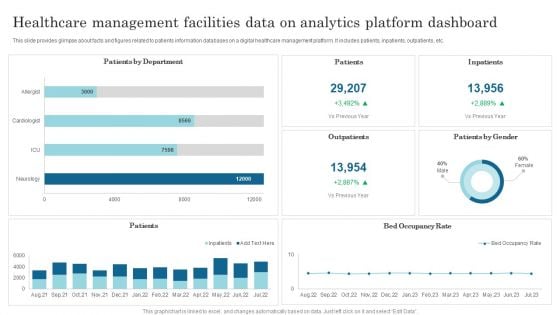
Healthcare Management Facilities Data On Analytics Platform Dashboard Slides PDF
This slide provides glimpse about facts and figures related to patients information databases on a digital healthcare management platform. It includes patients, inpatients, outpatients, etc. Showcasing this set of slides titled Healthcare Management Facilities Data On Analytics Platform Dashboard Slides PDF. The topics addressed in these templates are Patients By Department, Patients, Inpatients. All the content presented in this PPT design is completely editable. Download it and make adjustments in color, background, font etc. as per your unique business setting.
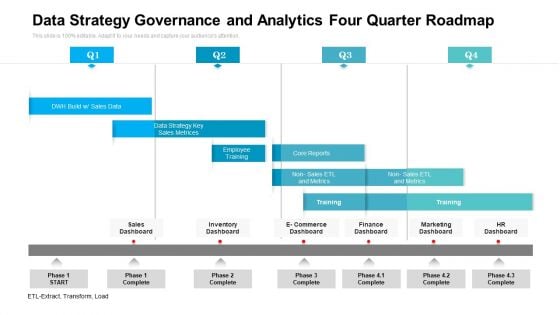
Data Strategy Governance And Analytics Four Quarter Roadmap Themes
Presenting our innovatively structured data strategy governance and analytics four quarter roadmap themes Template. Showcase your roadmap process in different formats like PDF, PNG, and JPG by clicking the download button below. This PPT design is available in both Standard Screen and Widescreen aspect ratios. It can also be easily personalized and presented with modified font size, font type, color, and shapes to measure your progress in a clear way.
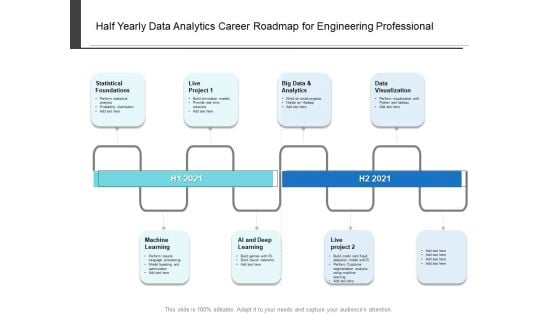
Half Yearly Data Analytics Career Roadmap For Engineering Professional Themes
Presenting our innovatively-structured half yearly data analytics career roadmap for engineering professional themes Template. Showcase your roadmap process in different formats like PDF, PNG, and JPG by clicking the download button below. This PPT design is available in both Standard Screen and Widescreen aspect ratios. It can also be easily personalized and presented with modified font size, font type, color, and shapes to measure your progress in a clear way.
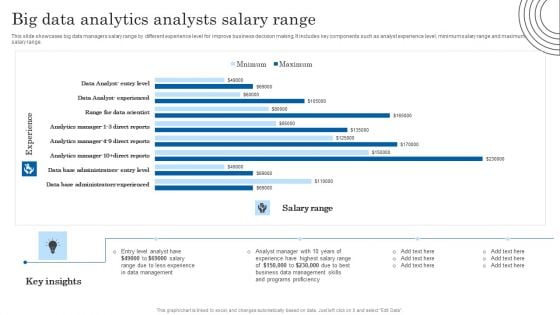
Big Data Analytics Analysts Salary Range Structure PDF
This slide showcases big data managers salary range by different experience level for improve business decision making. It includes key components such as analyst experience level, minimum salary range and maximum salary range. Pitch your topic with ease and precision using this Big Data Analytics Analysts Salary Range Structure PDF. This layout presents information on Analyst Manager, Data Management, Management Skills. It is also available for immediate download and adjustment. So, changes can be made in the color, design, graphics or any other component to create a unique layout.

Quarterly Data Analytics Career Roadmap For Engineering Professional Diagrams
Presenting our innovatively-structured quarterly data analytics career roadmap for engineering professional diagrams Template. Showcase your roadmap process in different formats like PDF, PNG, and JPG by clicking the download button below. This PPT design is available in both Standard Screen and Widescreen aspect ratios. It can also be easily personalized and presented with modified font size, font type, color, and shapes to measure your progress in a clear way.
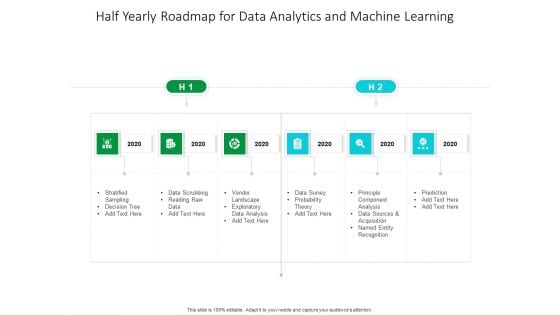
Half Yearly Roadmap For Data Analytics And Machine Learning Diagrams
Introducing our half yearly roadmap for data analytics and machine learning diagrams. This PPT presentation is Google Slides compatible, therefore, you can share it easily with the collaborators for measuring the progress. Also, the presentation is available in both standard screen and widescreen aspect ratios. So edit the template design by modifying the font size, font type, color, and shapes as per your requirements. As this PPT design is fully editable it can be presented in PDF, JPG and PNG formats.

 Home
Home