Data Chart

Quarterly Roadmap To Successfully Develop Cloud Migration Strategy Background PDF
This slide shows quarterly timeline to develop cloud migration strategy. It includes three stages which are planning, infrastructure and implementation. Showcasing this set of slides titled Quarterly Roadmap To Successfully Develop Cloud Migration Strategy Background PDF. The topics addressed in these templates are Readiness Questionnaire, Select Cloud Provider, Internal Collateral. All the content presented in this PPT design is completely editable. Download it and make adjustments in color, background, font etc. as per your unique business setting.
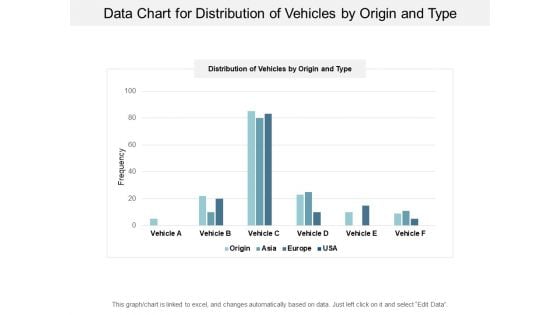
Data Chart For Distribution Of Vehicles By Origin And Type Ppt PowerPoint Presentation Infographics Topics
This is a data chart for distribution of vehicles by origin and type ppt powerpoint presentation infographics topics. This is a four stage process. The stages in this process are financial analysis, quantitative, statistical modelling.
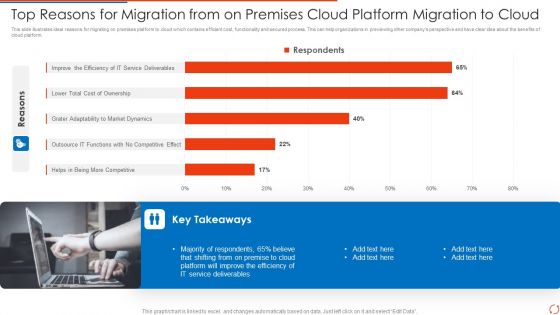
Top Reasons For Migration From On Premises Cloud Platform Migration To Cloud Introduction PDF Download PDF
This slide illustrates ideal reasons for migrating on premises platform to cloud which contains efficient cost, functionality and secured process. This can help organizations in previewing other companys perspective and have clear idea about the benefits of cloud platform.Showcasing this set of slides titled Top Reasons For Migration From On Premises Cloud Platform Migration To Cloud Introduction PDF Download PDF The topics addressed in these templates are Cost, Service Deliverables, Market. All the content presented in this PPT design is completely editable. Download it and make adjustments in color, background, font etc. as per your unique business setting.
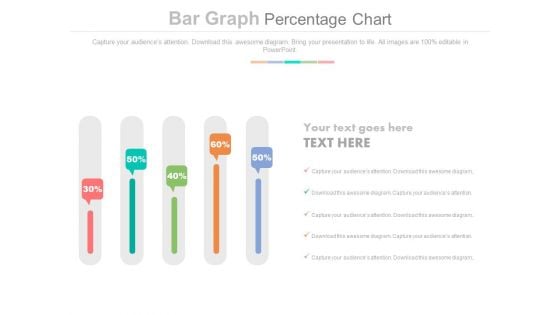
Sliders Percentage Data Chart Powerpoint Slides
This PowerPoint slide has been designed with slider chart and percentage data. This PPT diagram may be used to display business trends. This diagram slide can be used to make impressive presentations.
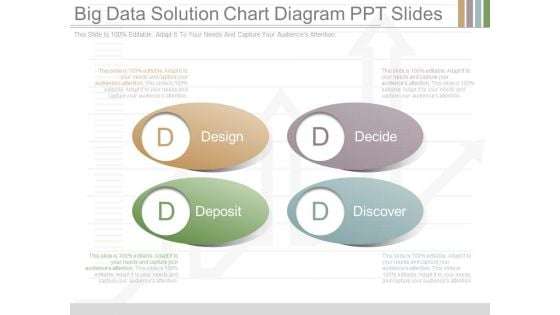
Big Data Solution Chart Diagram Ppt Slides
This is a big data solution chart diagram ppt slides. This is a four stage process. The stages in this process are design, decide, deposit, discover.

Market Research Data Collection Chart Presentation
This is a market research data collection chart presentation. This is a five stage process. The stages in this process are concept testing, customer satisfaction, pricing research, market segmentation, awareness usage.
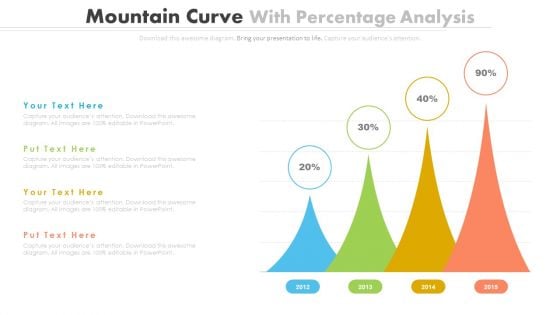
Percentage Data Growth Chart Powerpoint Slides
This PowerPoint template has been designed with percentage data growth chart. Download this PPT chart to depict financial ratio analysis. This PowerPoint slide is of great help in the business sector to make realistic presentations and provides effective way of presenting your newer thoughts.
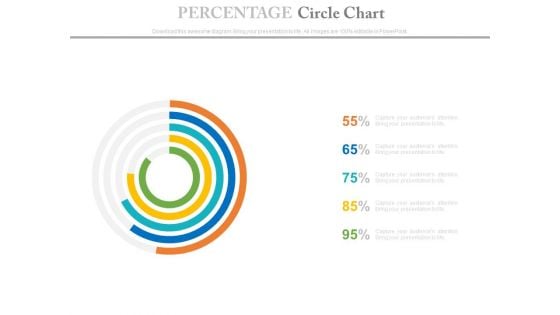
Percentage Data Circle Chart Powerpoint Slides
This PowerPoint template has been designed with circle chart. Download this PPT chart to depict financial ratio analysis. This PowerPoint slide is of great help in the business sector to make realistic presentations and provides effective way of presenting your newer thoughts.

Statistical Data Analysis Chart Of Collected Data Formats PDF
Presenting statistical data analysis chart of collected data formats pdf to dispense important information. This template comprises four stages. It also presents valuable insights into the topics including statistical data analysis chart of collected data. This is a completely customizable PowerPoint theme that can be put to use immediately. So, download it and address the topic impactfully.
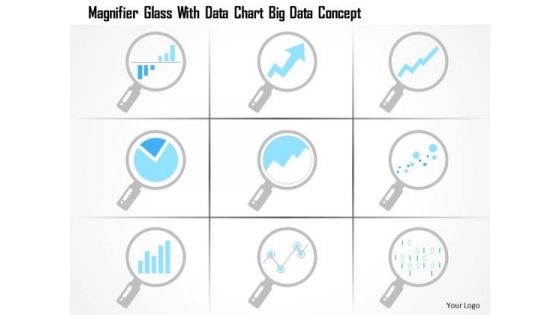
Business Diagram Magnifier Glass With Data Chart Big Data Concept Ppt Slide
This technology diagram has been designed with graphic of magnifier glass and big data chart. This diagram slide depicts the concept of data search. Use this diagram for your data search and focus related topics.
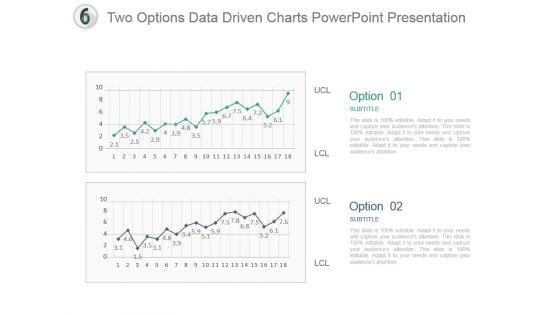
Two Options Data Driven Charts Powerpoint Presentation
This is a two options data driven charts powerpoint presentation. This is a two stage process. The stages in this process are business, success, strategy, process, marketing, management.
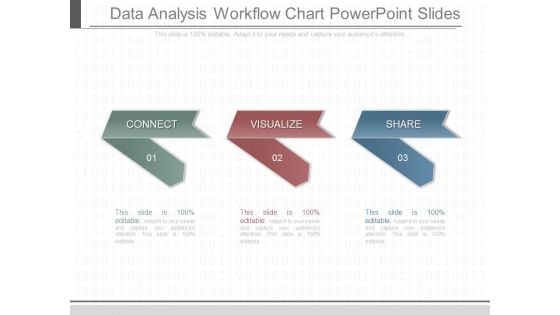
Data Analysis Workflow Chart Powerpoint Slides
This is a data analysis workflow chart powerpoint slides. This is a three stage process. The stages in this process are connect, visualize, share.
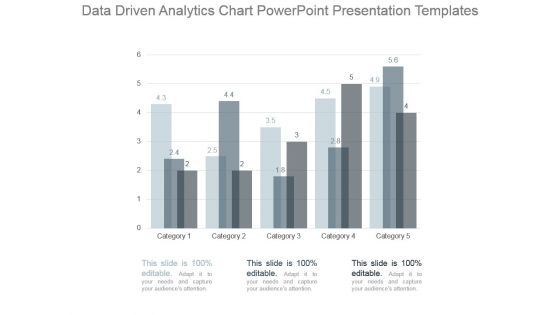
Data Driven Analytics Chart Powerpoint Presentation Templates
This is a data driven analytics chart powerpoint presentation templates. This is a five stage process. The stages in this process are category.
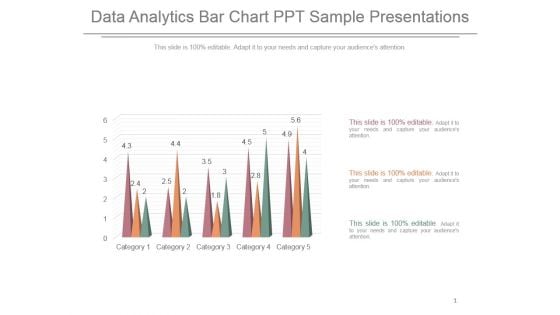
Data Analytics Bar Chart Ppt Sample Presentations
This is a data analytics bar chart ppt sample presentations. This is a five stage process. The stages in this process are category.
Data Maturity Assessment Chart Icon Demonstration PDF
Persuade your audience using this Data Maturity Assessment Chart Icon Demonstration PDF. This PPT design covers three stages, thus making it a great tool to use. It also caters to a variety of topics including Data Maturity, Assessment Chart Icon. Download this PPT design now to present a convincing pitch that not only emphasizes the topic but also showcases your presentation skills.
Business Statistics Data Chart Vector Icon Ppt PowerPoint Presentation File Graphics Design PDF
Presenting this set of slides with name business statistics data chart vector icon ppt powerpoint presentation file graphics design pdf. The topics discussed in these slide is business statistics data chart vector icon. This is a completely editable PowerPoint presentation and is available for immediate download. Download now and impress your audience.
Smart Phone With Data Chart On Screen Vector Icon Ppt PowerPoint Presentation Themes PDF
Presenting smart phone with data chart on screen vector icon ppt powerpoint presentation themes pdf to dispense important information. This template comprises four stages. It also presents valuable insights into the topics including smart phone with data chart on screen vector icon. This is a completely customizable PowerPoint theme that can be put to use immediately. So, download it and address the topic impactfully.
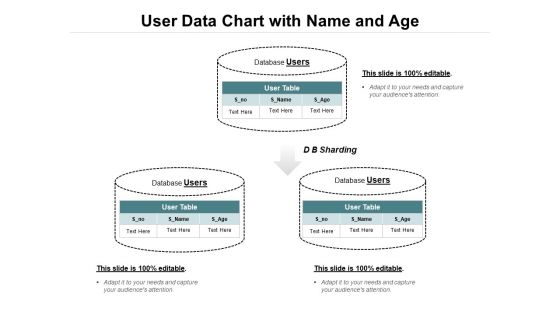
User Data Chart With Name And Age Ppt PowerPoint Presentation Summary Structure PDF
Presenting this set of slides with name user data chart with name and age ppt powerpoint presentation summary structure pdf. The topics discussed in these slide is user data chart with name and age. This is a completely editable PowerPoint presentation and is available for immediate download. Download now and impress your audience.
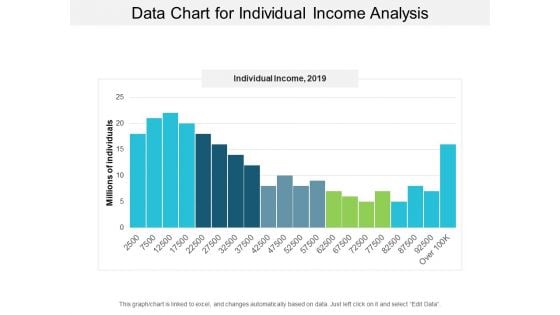
Data Chart For Individual Income Analysis Ppt PowerPoint Presentation Layouts Visual Aids
This is a data chart for individual income analysis ppt powerpoint presentation layouts visual aids. This is a five stage process. The stages in this process are financial analysis, quantitative, statistical modelling.
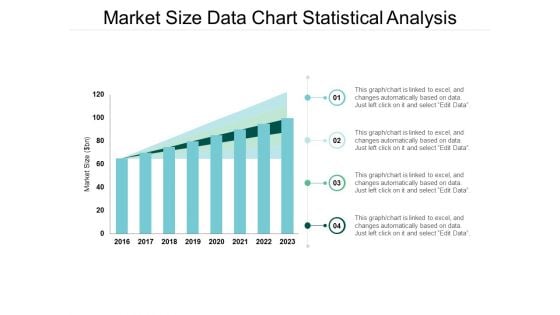
Market Size Data Chart Statistical Analysis Ppt Powerpoint Presentation Model Format
This is a market size data chart statistical analysis ppt powerpoint presentation model format. The topics discussed in this diagram are market growth, market opportunity, market profitability. This is a completely editable PowerPoint presentation, and is available for immediate download.
Market Performance Analysis Data Chart With Arrow Ppt PowerPoint Presentation Inspiration Graphics
This is a market performance analysis data chart with arrow ppt powerpoint presentation inspiration graphics. This is a four stage process. The stages in this process are marketing analytics, marketing performance, marketing discovery.
Data Chart With Up And Down Arrow Vector Icon Ppt PowerPoint Presentation Layouts Pictures PDF
Presenting data chart with up and down arrow vector icon ppt powerpoint presentation layouts pictures pdf to dispense important information. This template comprises three stages. It also presents valuable insights into the topics including data chart with up and down arrow vector icon. This is a completely customizable PowerPoint theme that can be put to use immediately. So, download it and address the topic impactfully.
Statistical Data Chart On Screen Monitor Ppt PowerPoint Presentation Outline Summary
Presenting this set of slides with name statistical data chart on screen monitor ppt powerpoint presentation outline summary. This is a one stage process. The stages in this process are data icon, status icon, status symbol icon. This is a completely editable PowerPoint presentation and is available for immediate download. Download now and impress your audience.
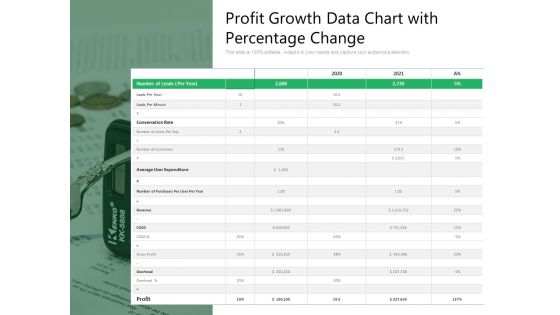
Profit Growth Data Chart With Percentage Change Ppt PowerPoint Presentation Summary Background PDF
Showcasing this set of slides titled profit growth data chart with percentage change ppt powerpoint presentation summary background pdf. The topics addressed in these templates are conversation rate, average user expenditure, profit. All the content presented in this PPT design is completely editable. Download it and make adjustments in color, background, font etc. as per your unique business setting.

Product Data Chart With Salesperson Details Ppt PowerPoint Presentation Styles Outline PDF
Presenting this set of slides with name product data chart with salesperson details ppt powerpoint presentation styles outline pdf. The topics discussed in these slides are sales person, parent table, product id, sales. This is a completely editable PowerPoint presentation and is available for immediate download. Download now and impress your audience.
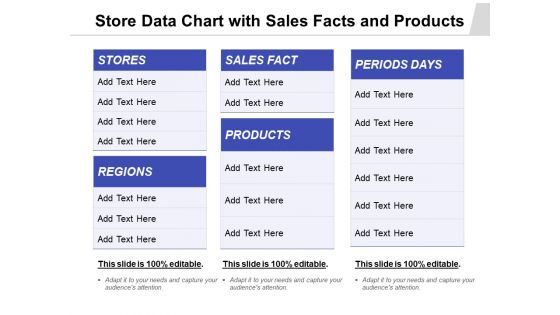
Store Data Chart With Sales Facts And Products Ppt PowerPoint Presentation Pictures Shapes PDF
Presenting this set of slides with name store data chart with sales facts and products ppt powerpoint presentation pictures shapes pdf. The topics discussed in these slides are stores, sales fact, periods days, regions, products. This is a completely editable PowerPoint presentation and is available for immediate download. Download now and impress your audience.
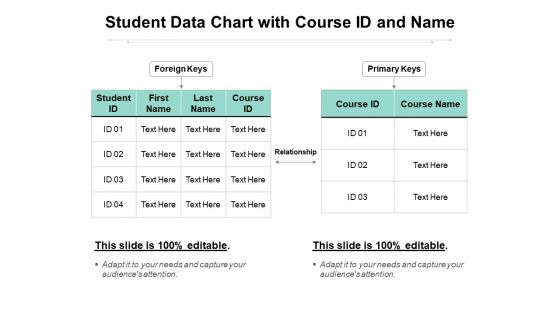
Student Data Chart With Course ID And Name Ppt PowerPoint Presentation Styles Example PDF
Presenting this set of slides with name student data chart with course id and name ppt powerpoint presentation styles example pdf. The topics discussed in these slides are foreign keys, primary keys, relationship. This is a completely editable PowerPoint presentation and is available for immediate download. Download now and impress your audience.
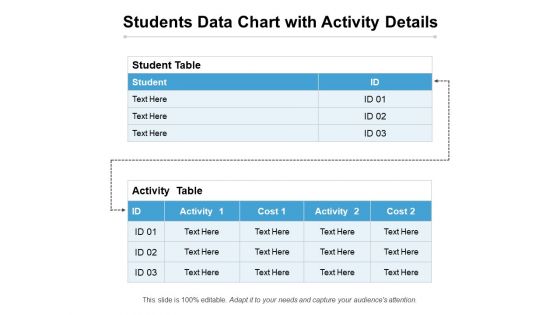
Students Data Chart With Activity Details Ppt PowerPoint Presentation Ideas Infographic Template PDF
Presenting this set of slides with name students data chart with activity details ppt powerpoint presentation ideas infographic template pdf. The topics discussed in these slides are student table, activity table. This is a completely editable PowerPoint presentation and is available for immediate download. Download now and impress your audience.
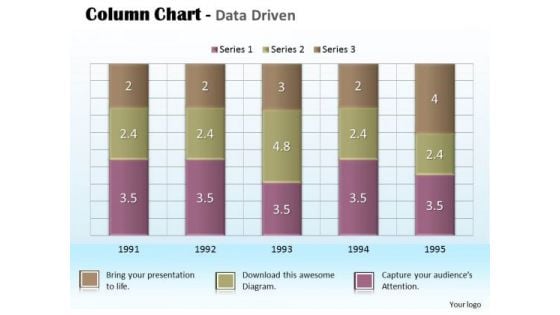
Business Data Analysis Chart For Project PowerPoint Templates
Document Your Views On Our business data analysis chart for project Powerpoint Templates. They Will Create A Strong Impression.

Business Data Analysis Chart For Case Studies PowerPoint Templates
Get Out Of The Dock With Our business data analysis chart for case studies Powerpoint Templates. Your Mind Will Be Set Free.
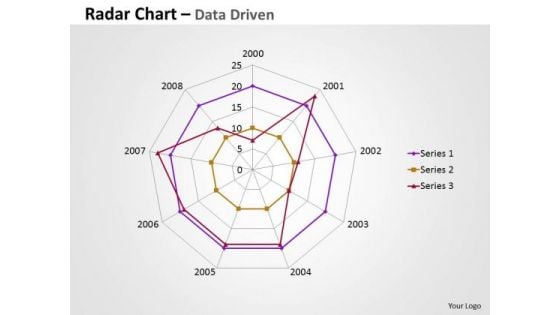
Business Data Analysis Chart Comparing Multiple Entities PowerPoint Templates
Analyze Ailments On Our business data analysis chart comparing multiple entities Powerpoint Templates. Bring Out The Thinking Doctor In You. Dock Your Thoughts With Our Financial Analysis . They Will Launch Them Into Orbit.
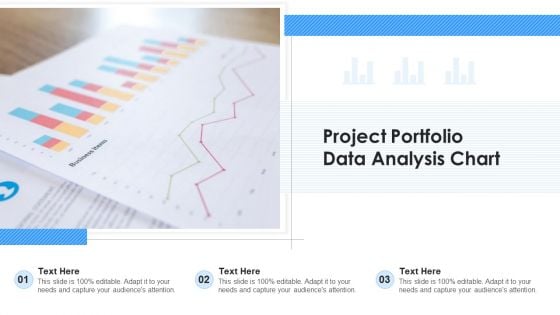
Project Portfolio Data Analysis Chart Ppt Ideas Gallery PDF
Presenting project portfolio data analysis chart ppt ideas gallery pdf to dispense important information. This template comprises three stages. It also presents valuable insights into the topics including project portfolio data analysis chart. This is a completely customizable PowerPoint theme that can be put to use immediately. So, download it and address the topic impactfully.
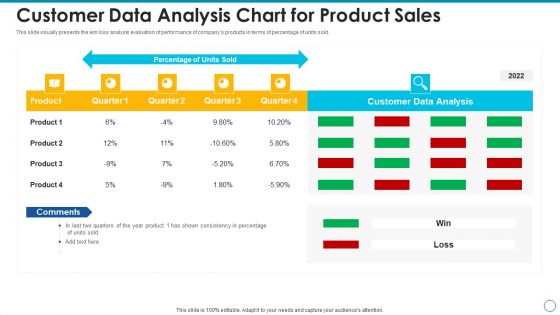
Customer Data Analysis Chart For Product Sales Inspiration PDF
Showcasing this set of slides titled customer data analysis chart for product sales inspiration pdf. The topics addressed in these templates are customer data analysis chart for product sales. All the content presented in this PPT design is completely editable. Download it and make adjustments in color, background, font etc. as per your unique business setting.
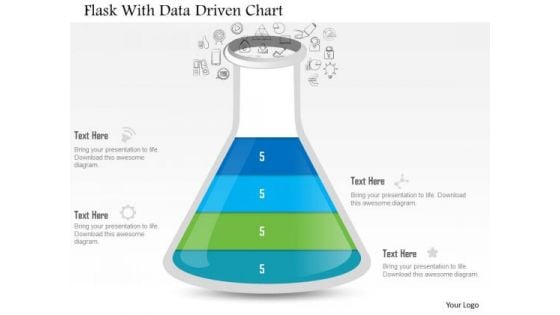
Business Diagram Flask With Data Driven Chart PowerPoint Slide
This data driven diagram has been designed with flask graphics. Download this diagram to give your presentations more effective look. It helps in clearly conveying your message to clients and audience.
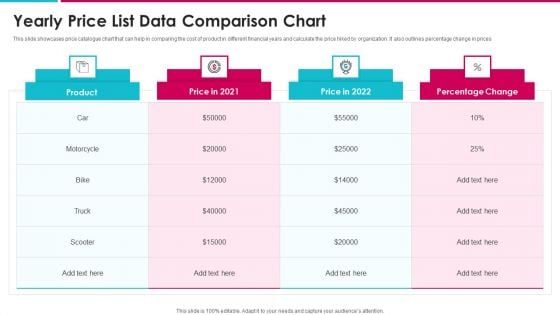
Yearly Price List Data Comparison Chart Structure PDF
This slide showcases price catalogue chart that can help in comparing the cost of product in different financial years and calculate the price hiked by organization. It also outlines percentage change in prices Showcasing this set of slides titled yearly price list data comparison chart structure pdf. The topics addressed in these templates are yearly price list data comparison chart. All the content presented in this PPT design is completely editable. Download it and make adjustments in color, background, font etc. as per your unique business setting.
Data Flow Chart Vector Icon Ppt PowerPoint Presentation File Samples
Presenting this set of slides with name data flow chart vector icon ppt powerpoint presentation file samples. This is a one stage process. The stages in this process are data icon, status icon, status symbol icon. This is a completely editable PowerPoint presentation and is available for immediate download. Download now and impress your audience.
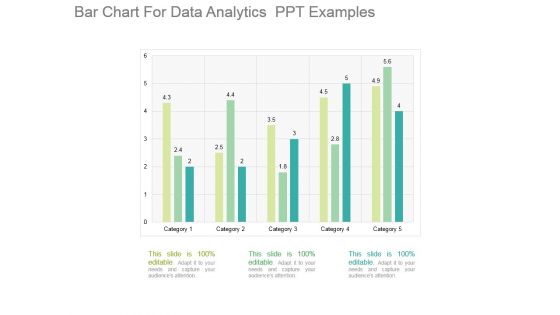
Bar Chart For Data Analytics Ppt Examples
This is a bar chart for data analytics ppt examples. This is a five stage process. The stages in this process are category.
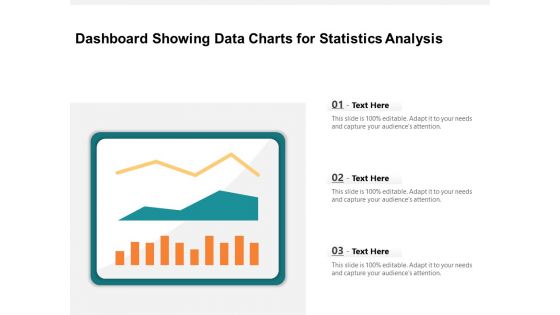
Dashboard Showing Data Charts For Statistics Analysis Ppt PowerPoint Presentation Infographic Template Grid PDF
Pitch your topic with ease and precision using this dashboard showing data charts for statistics analysis ppt powerpoint presentation infographic template grid pdf. This layout presents information on dashboard showing data charts for statistics analysis. It is also available for immediate download and adjustment. So, changes can be made in the color, design, graphics or any other component to create a unique layout.
Web Analytics Icons Computer Screen With Data Charts Ppt PowerPoint Presentation Ideas Outline
This is a web analytics icons computer screen with data charts ppt powerpoint presentation ideas outline. This is a four stage process. The stages in this process are digital analytics, digital dashboard, marketing.

Business Analysis Data Charts And Reports Ppt Powerpoint Presentation Ideas Portrait
This is a business analysis data charts and reports ppt powerpoint presentation ideas portrait. This is a three stage process. The stages in this process are business metrics, business kpi, business dashboard.
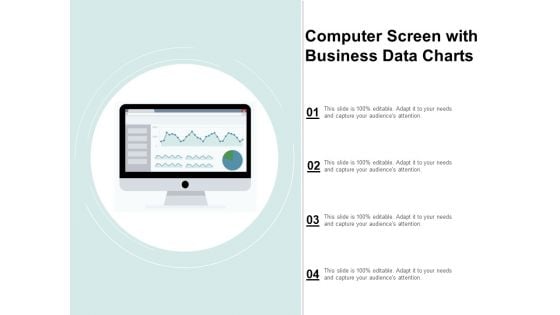
Computer Screen With Business Data Charts Ppt Powerpoint Presentation Show Vector
This is a computer screen with business data charts ppt powerpoint presentation show vector. This is a four stage process. The stages in this process are business metrics, business kpi, business dashboard.
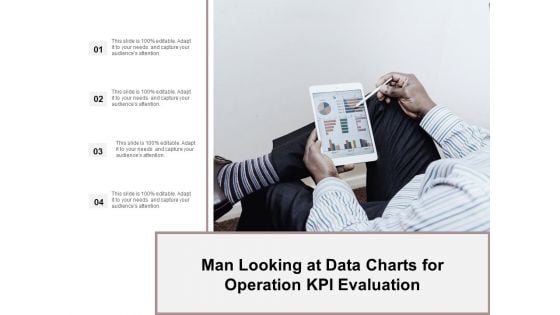
Man Looking At Data Charts For Operation Kpi Evaluation Ppt Powerpoint Presentation Ideas Demonstration
This is a man looking at data charts for operation kpi evaluation ppt powerpoint presentation ideas demonstration. This is a four stage process. The stages in this process are business metrics, business kpi, business dashboard.
Finance Team With Data Charts Vector Icon Ppt PowerPoint Presentation Summary Microsoft PDF
Persuade your audience using this finance team with data charts vector icon ppt powerpoint presentation summary microsoft pdf. This PPT design covers three stages, thus making it a great tool to use. It also caters to a variety of topics including finance team with data charts vector icon. Download this PPT design now to present a convincing pitch that not only emphasizes the topic but also showcases your presentation skills.
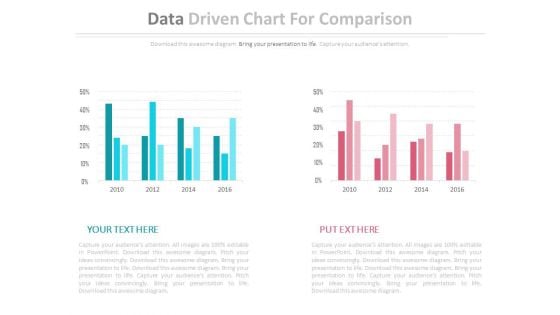
Two Data Driven Comparison Charts Powerpoint Slides
This PowerPoint template contains diagram of two data driven charts. You may use this PPT slide to depict strategic analysis for business. The color coding of this template is specifically designed to highlight you points.
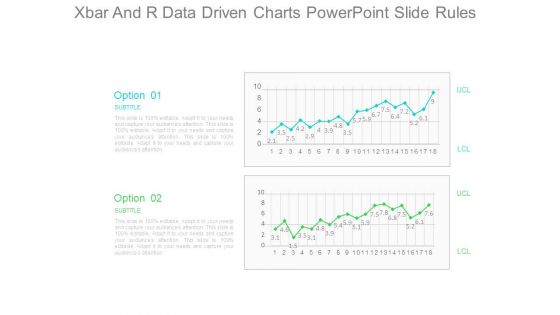
Xbar And R Data Driven Charts Powerpoint Slide Rules
This is a xbar and r data driven charts powerpoint slide rules. This is a two stage process. The stages in this process are option, subtitle, lcl, ucl.
Order Fulfilment And Replenishment Data Flow Charts Icon Background PDF
Showcasing this set of slides titled Order Fulfilment And Replenishment Data Flow Charts Icon Background PDF. The topics addressed in these templates are Order, Fulfilment And Replenishment, Data Flow Charts, Icon. All the content presented in this PPT design is completely editable. Download it and make adjustments in color, background, font etc. as per your unique business setting.
Data Flow Charts For Social Media Application Icon Graphics PDF
Persuade your audience using this Data Flow Charts For Social Media Application Icon Graphics PDF. This PPT design covers three stages, thus making it a great tool to use. It also caters to a variety of topics including Data Flow Charts, Social Media Application, Icon. Download this PPT design now to present a convincing pitch that not only emphasizes the topic but also showcases your presentation skills.

Customer Relationship Management System Data Flow Charts Structure PDF
Presenting Customer Relationship Management System Data Flow Charts Structure PDF to dispense important information. This template comprises five stages. It also presents valuable insights into the topics including CRM Database, Payment Module, CRM Master Module. This is a completely customizable PowerPoint theme that can be put to use immediately. So, download it and address the topic impactfully.
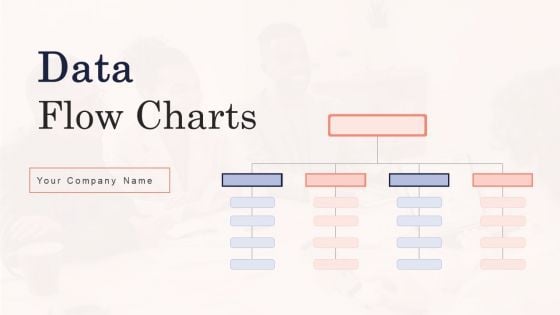
Data Flow Charts Ppt PowerPoint Presentation Complete Deck With Slides
This Data Flow Charts Ppt PowerPoint Presentation Complete Deck With Slides acts as backup support for your ideas, vision, thoughts, etc. Use it to present a thorough understanding of the topic. This PPT slideshow can be utilized for both in-house and outside presentations depending upon your needs and business demands. Entailing twenty slides with a consistent design and theme, this template will make a solid use case. As it is intuitively designed, it suits every business vertical and industry. All you have to do is make a few tweaks in the content or any other component to design unique presentations. The biggest advantage of this complete deck is that it can be personalized multiple times once downloaded. The color, design, shapes, and other elements are free to modify to add personal touches. You can also insert your logo design in this PPT layout. Therefore a well-thought and crafted presentation can be delivered with ease and precision by downloading this Data Flow Charts Ppt PowerPoint Presentation Complete Deck With Slides PPT slideshow.
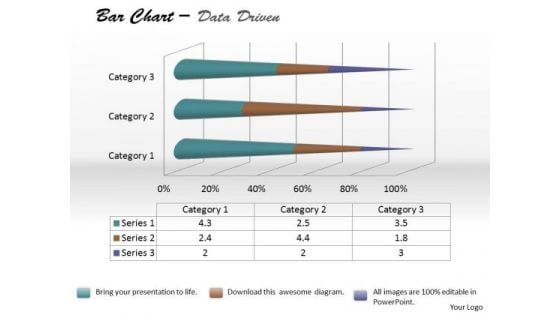
Data Analysis Bar Chart For Foreign Trade PowerPoint Templates
Be The Doer With Our data analysis bar chart for foreign trade Powerpoint Templates. Put Your Thoughts Into Practice.
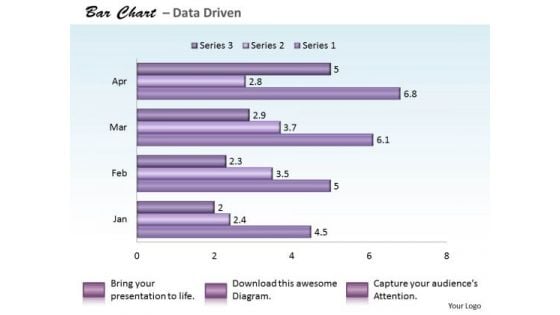
Quantitative Data Analysis Bar Chart For PowerPoint Templates
Reduce The Drag With Our quantitative data analysis bar chart for Powerpoint Templates . Give More Lift To Your Thoughts.
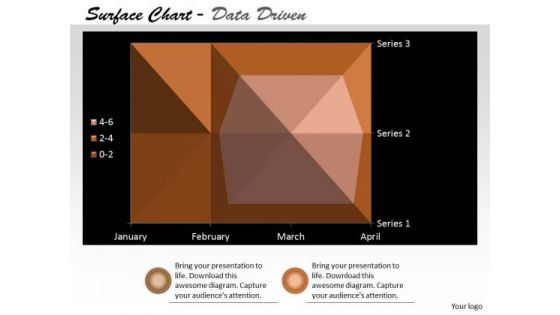
Multivariate Data Analysis Surface Chart Plots Trends PowerPoint Templates
Our multivariate data analysis surface chart plots trends Powerpoint Templates Heighten Concentration. Your Audience Will Be On The Edge.
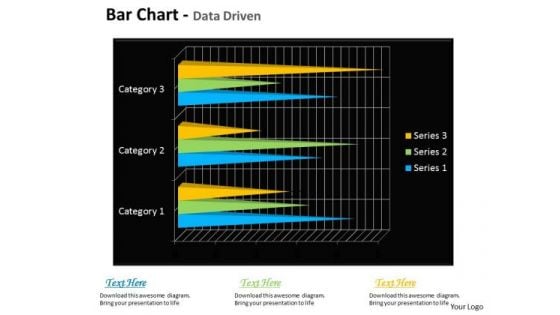
Quantitative Data Analysis Bar Chart For Financial Markets PowerPoint Templates
Draft It Out On Our quantitative data analysis bar chart for financial markets Powerpoint Templates . Give The Final Touches With Your Ideas.
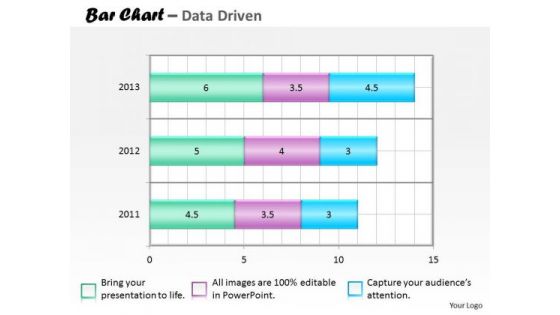
Financial Data Analysis Bar Chart For Collection Of PowerPoint Templates
Our financial data analysis bar chart for collection of Powerpoint Templates Team Are A Dogged Lot. They Keep At It Till They Get It Right.

Microsoft Excel Data Analysis Bar Chart To Handle PowerPoint Templates
Our microsoft excel data analysis bar chart to handle Powerpoint Templates And Your Ideas Make A Great Doubles Pair. Play The Net With Assured Hands.
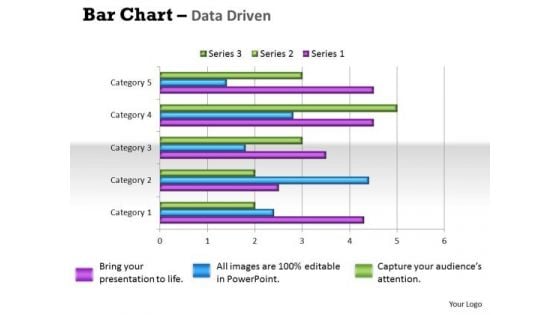
Quantitative Data Analysis Bar Chart For Different Categories PowerPoint Templates
Make Some Dough With Our quantitative data analysis bar chart for different categories Powerpoint Templates . Your Assets Will Rise Significantly.
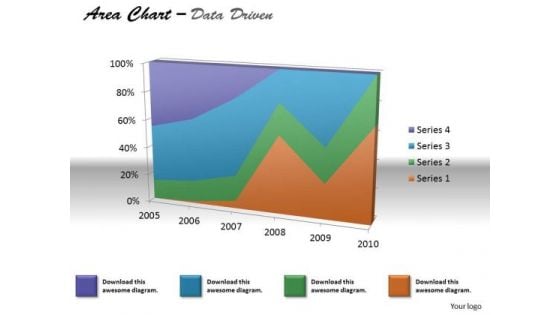
Financial Data Analysis Area Chart For Various Values PowerPoint Templates
Document The Process On Our financial data analysis area chart for various values Powerpoint Templates . Make A Record Of Every Detail.
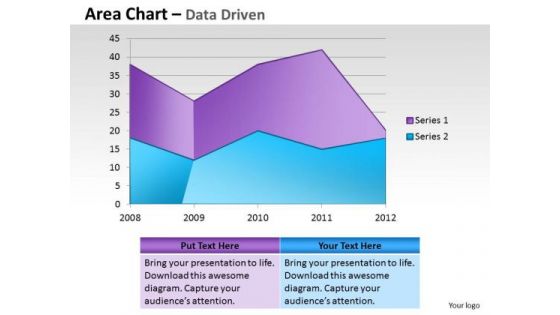
Financial Data Analysis Area Chart For Showing Trends PowerPoint Templates
Document Your Views On Our financial data analysis area chart for showing trends Powerpoint Templates . They Will Create A Strong Impression.
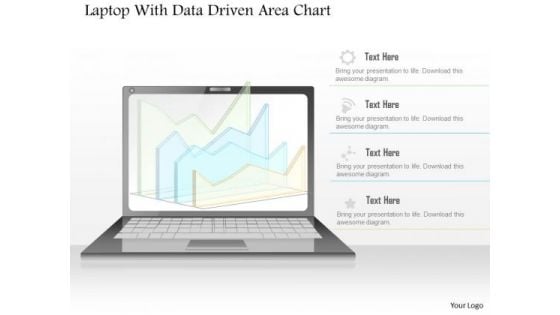
Business Diagram Laptop With Data Driven Area Chart PowerPoint Slide
This diagram has been designed with laptop and data driven area chart. Download this diagram to give your presentations more effective look. It helps in clearly conveying your message to clients and audience.
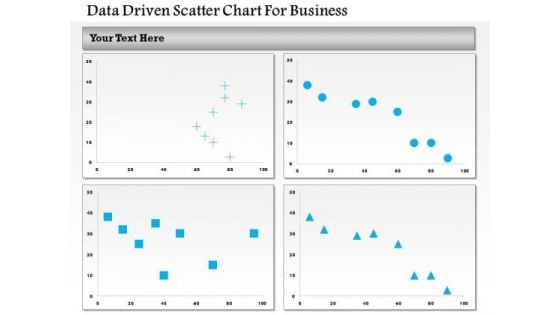
Business Diagram Data Driven Scatter Chart For Business PowerPoint Slide
This business diagram has been designed with four comparative charts. This slide suitable for data representation. You can also use this slide to present business analysis and reports. Use this diagram to present your views in a wonderful manner.

 Home
Home