Data Interpretation
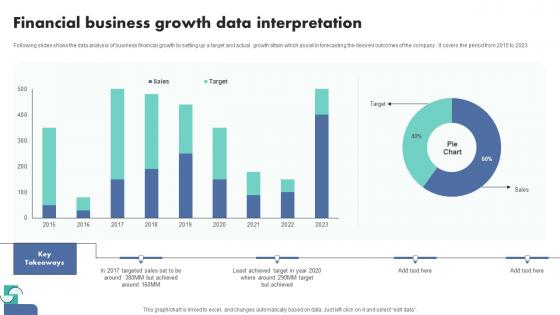
Financial Business Growth Data Interpretation Themes Pdf
Following slides shows the data analysis of business financial growth by setting up a target and actual growth attain which assist in forecasting the desired outcomes of the company . It covers the period from 2015 to 2023.Pitch your topic with ease and precision using this Financial Business Growth Data Interpretation Themes Pdf This layout presents information on Financial Business, Growth Data Interpretation It is also available for immediate download and adjustment. So, changes can be made in the color, design, graphics or any other component to create a unique layout. Following slides shows the data analysis of business financial growth by setting up a target and actual growth attain which assist in forecasting the desired outcomes of the company . It covers the period from 2015 to 2023.
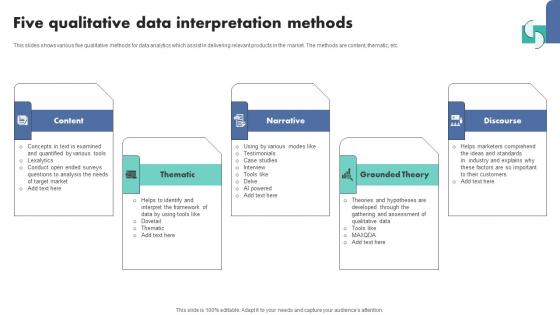
Five Qualitative Data Interpretation Methods Diagrams Pdf
This slides shows various five qualitative methods for data analytics which assist in delivering relevant products in the market. The methods are content, thematic, etc.Showcasing this set of slides titled Five Qualitative Data Interpretation Methods Diagrams Pdf The topics addressed in these templates are Concepts Text, Examined, Theories Hypotheses All the content presented in this PPT design is completely editable. Download it and make adjustments in color, background, font etc. as per your unique business setting. This slides shows various five qualitative methods for data analytics which assist in delivering relevant products in the market. The methods are content, thematic, etc.
Data Interpretation And Analysis Playbook Icons Slide For Data Interpretation And Analysis Playbook Designs PDF
Presenting our innovatively structured data interpretation and analysis playbook icons slide for data interpretation and analysis playbook designs pdf set of slides. The slides contain a hundred percent editable icons. You can replace these icons without any inconvenience. Therefore, pick this set of slides and create a striking presentation.
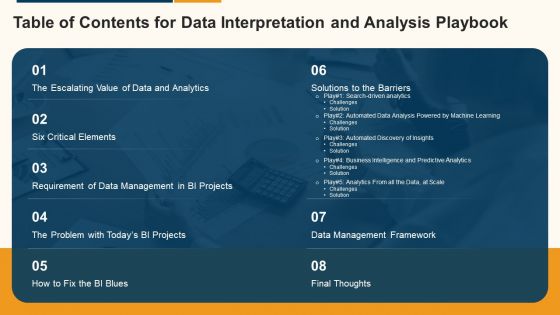
Data Interpretation And Analysis Playbook Table Of Contents For Data Interpretation And Analysis Playbook Rules PDF
Deliver an awe inspiring pitch with this creative data interpretation and analysis playbook table of contents for data interpretation and analysis playbook rules pdf bundle. Topics like six critical elements, data management framework, solutions to the barriers, data management in bi projects, final thoughts can be discussed with this completely editable template. It is available for immediate download depending on the needs and requirements of the user.
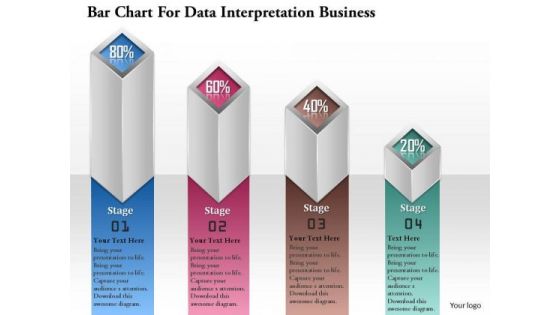
Consulting Slides Bar Chart For Data Interpretation Business Presentation
This pre-designed and appealing bar chart for PowerPoint offer an optimized possibility to illustrate your business strategy. You can use this diagram for data interpretation. This diagram is editable and can be easily adjusted.
Data Interpretation Icon For Financial Sector Mockup Pdf
Showcasing this set of slides titled Data Interpretation Icon For Financial Sector Mockup Pdf The topics addressed in these templates are Data Interpretation Icon, Measure Business Growth All the content presented in this PPT design is completely editable. Download it and make adjustments in color, background, font etc. as per your unique business setting. Our Data Interpretation Icon For Financial Sector Mockup Pdf are topically designed to provide an attractive backdrop to any subject. Use them to look like a presentation pro.
Digital Marketing Data Interpretation And Evaluation Icon Clipart PDF
Presenting Digital Marketing Data Interpretation And Evaluation Icon Clipart PDF to dispense important information. This template comprises four stages. It also presents valuable insights into the topics including Digital Marketing, Data Interpretation, Evaluation Icon. This is a completely customizable PowerPoint theme that can be put to use immediately. So, download it and address the topic impactfully.
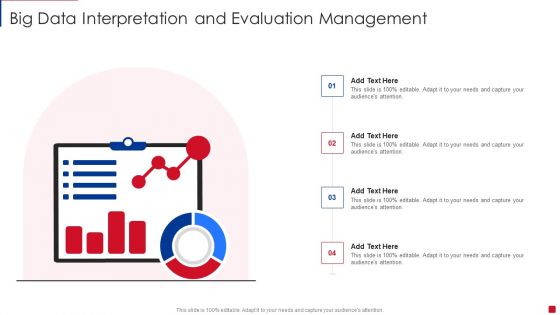
Big Data Interpretation And Evaluation Management Demonstration PDF
Presenting Big Data Interpretation And Evaluation Management Demonstration PDF to dispense important information. This template comprises four stages. It also presents valuable insights into the topics including Evaluation Management, Big Data Interpretation. This is a completely customizable PowerPoint theme that can be put to use immediately. So, download it and address the topic impactfully.
Data Interpretation Percentage Analysis Ppt Powerpoint Presentation Summary Icon
This is a data interpretation percentage analysis ppt powerpoint presentation summary icon. This is a six stage process. The stages in this process are data presentation, content presentation, information presentation.
Data Interpretation Icon To Measure Business Growth Background Pdf
This slide depicts the project management streamline of data analytics on daily basis by setting different target days.Pitch your topic with ease and precision using this Data Interpretation Icon To Measure Business Growth Background Pdf This layout presents information on Data Interpretation, Project Management, Gantt Chart It is also available for immediate download and adjustment. So, changes can be made in the color, design, graphics or any other component to create a unique layout. This slide depicts the project management streamline of data analytics on daily basis by setting different target days.

Data Interpretation Expertise Ppt PowerPoint Presentation Complete Deck With Slides
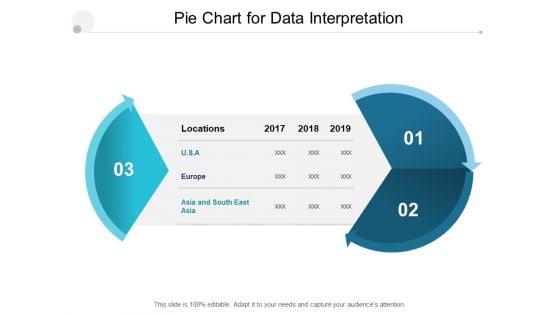
Pie Chart For Data Interpretation Ppt PowerPoint Presentation Portfolio Guide
Presenting this set of slides with name pie chart for data interpretation ppt powerpoint presentation portfolio guide. The topics discussed in these slides are pie chart, finance, donut chart. This is a completely editable PowerPoint presentation and is available for immediate download. Download now and impress your audience.
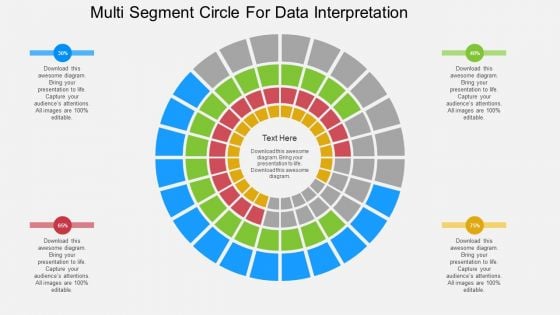
Multi Segment Circle For Data Interpretation Powerpoint Template
This PowerPoint template has been designed with circular web diagram. This diagram is useful to display outline of a business plan. Visual effect helps in maintaining the flow of the discussion and provides more clarity to the subject.
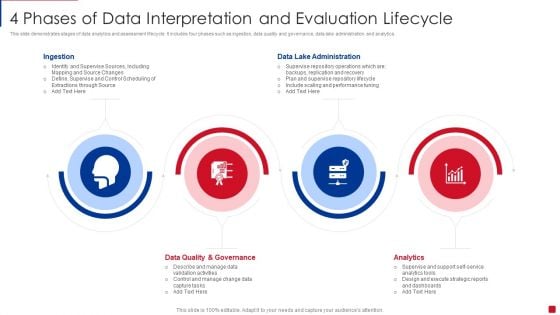
4 Phases Of Data Interpretation And Evaluation Lifecycle Guidelines PDF
This slide demonstrates stages of data analytics and assessment lifecycle. It includes four phases such as ingestion, data quality and governance, data lake administration and analytics. Presenting 4 Phases Of Data Interpretation And Evaluation Lifecycle Guidelines PDF to dispense important information. This template comprises four stages. It also presents valuable insights into the topics including Ingestion, Data Quality And Governance, Analytics. This is a completely customizable PowerPoint theme that can be put to use immediately. So, download it and address the topic impactfully.

Data Interpretation And Evaluation Readiness Form Of Company Summary PDF
This slide represents the survey results of assessment of data and analytics skills conducted by an organization. It includes five questions along with their confidence levels. Showcasing this set of slides titled Data Interpretation And Evaluation Readiness Form Of Company Summary PDF. The topics addressed in these templates are Individual Analyze, Capabilities, Analytics Tools. All the content presented in this PPT design is completely editable. Download it and make adjustments in color, background, font etc. as per your unique business setting.

Data Interpretation Ppt Powerpoint Presentation Complete Deck With Slides
Improve your presentation delivery using this Data Interpretation Ppt Powerpoint Presentation Complete Deck With Slides. Support your business vision and objectives using this well-structured PPT deck. This template offers a great starting point for delivering beautifully designed presentations on the topic of your choice. Comprising fourteen this professionally designed template is all you need to host discussion and meetings with collaborators. Each slide is self-explanatory and equipped with high-quality graphics that can be adjusted to your needs. Therefore, you will face no difficulty in portraying your desired content using this PPT slideshow. This PowerPoint slideshow contains every important element that you need for a great pitch. It is not only editable but also available for immediate download and utilization. The color, font size, background, shapes everything can be modified to create your unique presentation layout. Therefore, download it now. Our Data Interpretation Ppt Powerpoint Presentation Complete Deck With Slides are topically designed to provide an attractive backdrop to any subject. Use them to look like a presentation pro.
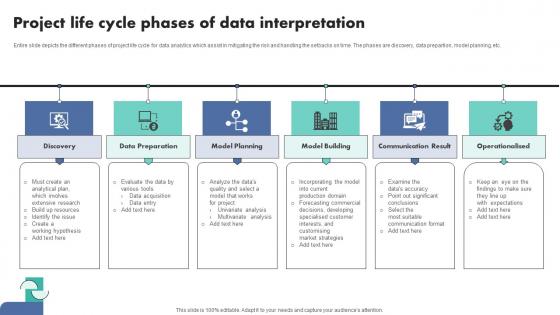
Project Life Cycle Phases Of Data Interpretation Demonstration Pdf
Entire slide depicts the different phases of project life cycle for data analytics which assist in mitigating the risk and handling the setbacks on time. The phases are discovery, data prepartion, model planning, etc.Pitch your topic with ease and precision using this Project Life Cycle Phases Of Data Interpretation Demonstration Pdf This layout presents information on Data Preparation, Model Planning, Model Building It is also available for immediate download and adjustment. So, changes can be made in the color, design, graphics or any other component to create a unique layout. Entire slide depicts the different phases of project life cycle for data analytics which assist in mitigating the risk and handling the setbacks on time. The phases are discovery, data prepartion, model planning, etc.
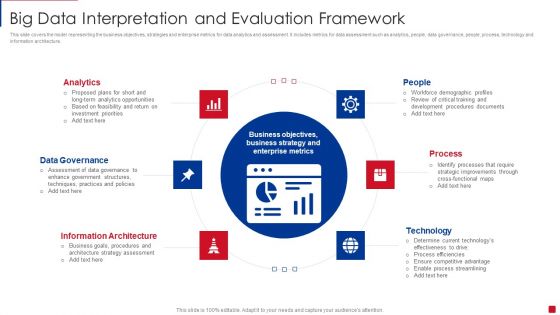
Big Data Interpretation And Evaluation Framework Portrait PDF
This slide covers the model representing the business objectives, strategies and enterprise metrics for data analytics and assessment. It includes metrics for data assessment such as analytics, people, data governance, people, process, technology and information architecture. Persuade your audience using this Big Data Interpretation And Evaluation Framework Portrait PDF. This PPT design covers six stages, thus making it a great tool to use. It also caters to a variety of topics including Data Governance, Information Architecture, Technology. Download this PPT design now to present a convincing pitch that not only emphasizes the topic but also showcases your presentation skills.
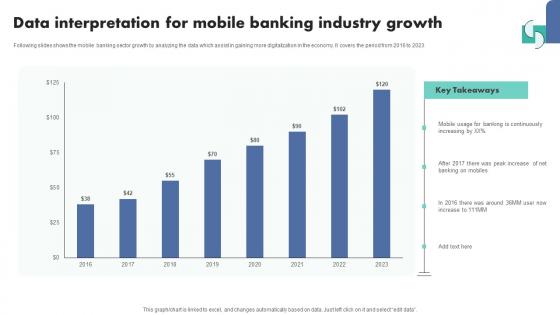
Data Interpretation For Mobile Banking Industry Growth Template Pdf
Following slides shows the mobile banking sector growth by analyzing the data which assist in gaining more digitalization in the economy. It covers the period from 2016 to 2023.Pitch your topic with ease and precision using this Data Interpretation For Mobile Banking Industry Growth Template Pdf This layout presents information on Banking Continuously, Banking Mobiles, Key Takeaways It is also available for immediate download and adjustment. So, changes can be made in the color, design, graphics or any other component to create a unique layout. Following slides shows the mobile banking sector growth by analyzing the data which assist in gaining more digitalization in the economy. It covers the period from 2016 to 2023.
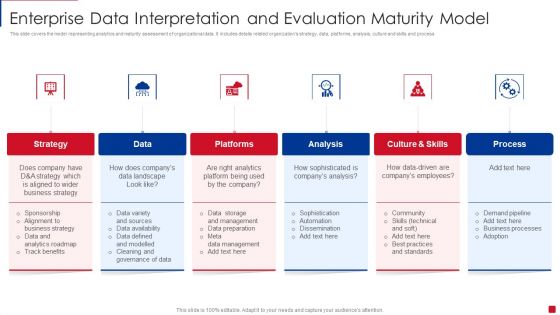
Enterprise Data Interpretation And Evaluation Maturity Model Slides PDF
This slide covers the model representing analytics and maturity assessment of organizational data. It includes details related organizations strategy, data, platforms, analysis, culture and skills and process Persuade your audience using this Enterprise Data Interpretation And Evaluation Maturity Model Slides PDF. This PPT design covers six stages, thus making it a great tool to use. It also caters to a variety of topics including Platforms, Analysis, Culture And Skills. Download this PPT design now to present a convincing pitch that not only emphasizes the topic but also showcases your presentation skills.

Big Data Interpretation Evaluation In Risk Management Lifecycle Designs PDF
This slide demonstrates the four phases of big data analytics assessment in risk management lifecycle. It includes four phases such as risk assessment and measurement, front office and risk operations, risk control, monitoring, reporting and governance. Persuade your audience using this Big Data Interpretation Evaluation In Risk Management Lifecycle Designs PDF. This PPT design covers four stages, thus making it a great tool to use. It also caters to a variety of topics including Risk Assessment And Measurement, Risk Control And Monitoring , Risk Reporting And Governance. Download this PPT design now to present a convincing pitch that not only emphasizes the topic but also showcases your presentation skills.
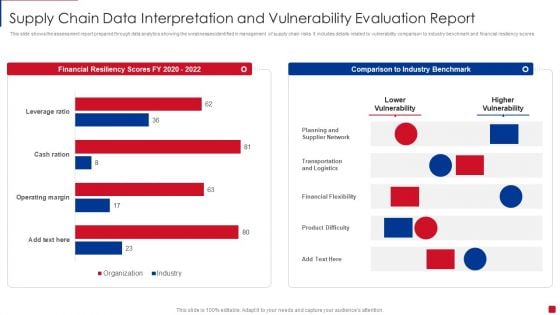
Supply Chain Data Interpretation And Vulnerability Evaluation Report Pictures PDF
This slide shows the assessment report prepared through data analytics showing the weaknesses identified in management of supply chain risks. It includes details related to vulnerability comparison to industry benchmark and financial resiliency scores Showcasing this set of slides titled Supply Chain Data Interpretation And Vulnerability Evaluation Report Pictures PDF. The topics addressed in these templates are Planning And Supplier Network, Transportation And Logistics, Financial Flexibility. All the content presented in this PPT design is completely editable. Download it and make adjustments in color, background, font etc. as per your unique business setting.
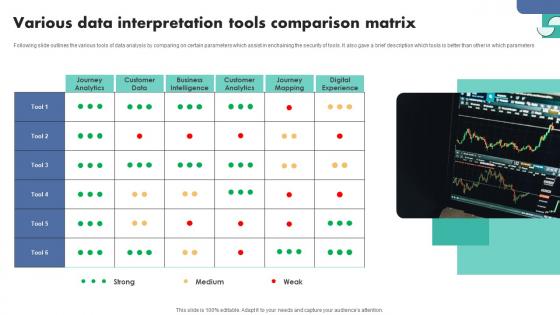
Various Data Interpretation Tools Comparison Matrix Ideas Pdf
Following slide outlines the various tools of data analysis by comparing on certain parameters which assist in enchaining the security of tools. It also gave a brief description which tools is better than other in which parameters.Showcasing this set of slides titled Various Data Interpretation Tools Comparison Matrix Ideas Pdf The topics addressed in these templates are Customer Data, Business Intelligence, Customer Analytics All the content presented in this PPT design is completely editable. Download it and make adjustments in color, background, font etc. as per your unique business setting. Following slide outlines the various tools of data analysis by comparing on certain parameters which assist in enchaining the security of tools. It also gave a brief description which tools is better than other in which parameters.
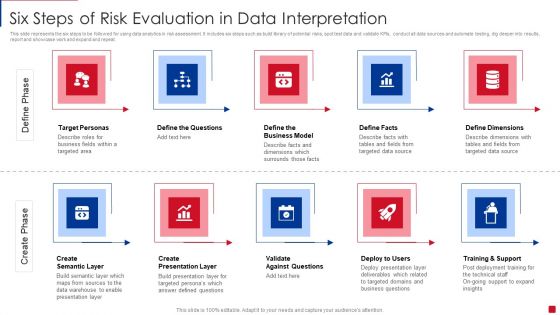
Six Steps Of Risk Evaluation In Data Interpretation Introduction PDF
This slide represents the six steps to be followed for using data analytics in risk assessment. It includes six steps such as build library of potential risks, spot test data and validate KPIs, conduct all data sources and automate testing, dig deeper into results, report and showcase work and expand and repeat. Persuade your audience using this Six Steps Of Risk Evaluation In Data Interpretation Introduction PDF. This PPT design covers six stages, thus making it a great tool to use. It also caters to a variety of topics including Expand And Repeat, Report Showcase Work, Potential Risks. Download this PPT design now to present a convincing pitch that not only emphasizes the topic but also showcases your presentation skills.
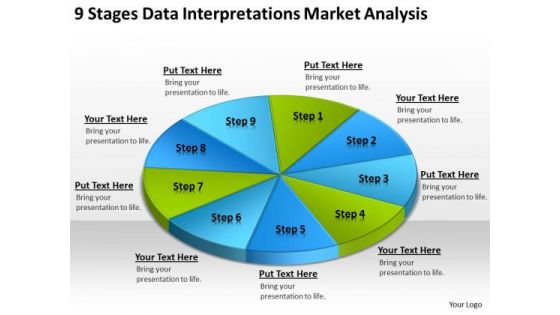
Data Interpretations Market Analysis Templates For Business Plan PowerPoint
We present our data interpretations market analysis templates for business plan PowerPoint.Present our Circle Charts PowerPoint Templates because Our PowerPoint Templates and Slides come in all colours, shades and hues. They help highlight every nuance of your views. Use our Business PowerPoint Templates because Our PowerPoint Templates and Slides will let you Hit the right notes. Watch your audience start singing to your tune. Download our Shapes PowerPoint Templates because Our PowerPoint Templates and Slides will fulfill your every need. Use them and effectively satisfy the desires of your audience. Present our Signs PowerPoint Templates because Our PowerPoint Templates and Slides will provide you a launch platform. Give a lift off to your ideas and send them into orbit. Use our Metaphors-Visual Concepts PowerPoint Templates because You have a driving passion to excel in your field. Our PowerPoint Templates and Slides will prove ideal vehicles for your ideas.Use these PowerPoint slides for presentations relating to business, chart, circle, circular, diagram, economy, finance, framework, graph, isolated, percentage, pie chart, results, scheme, statistics, stats, strategy, success. The prominent colors used in the PowerPoint template are Blue, Green, Blue light. Affiliate our Data Interpretations Market Analysis Templates For Business Plan PowerPoint to your thoughts. They will develop an affinity for them.
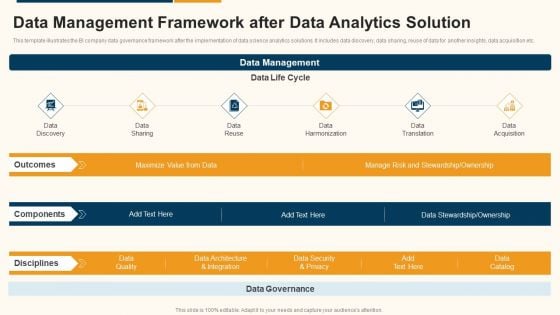
Data Interpretation And Analysis Playbook Data Management Framework After Data Analytics Solution Structure PDF
This template illustrates the BI company data governance framework after the implementation of data science analytics solutions. It includes data discovery, data sharing, reuse of data for another insights, data acquisition etc. This is a data interpretation and analysis playbook data management framework after data analytics solution structure pdf template with various stages. Focus and dispense information on six stages using this creative set, that comes with editable features. It contains large content boxes to add your information on topics like data discovery, data sharing, data reuse, data harmonization, data translation, data acquisition. You can also showcase facts, figures, and other relevant content using this PPT layout. Grab it now.
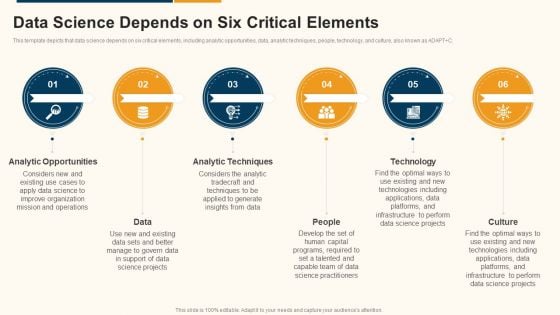
Data Interpretation And Analysis Playbook Data Science Depends On Six Critical Elements Diagrams PDF
This template depicts that data science depends on six critical elements, including analytic opportunities, data, analytic techniques, people, technology, and culture, also known as ADAPT pluse C. Presenting data interpretation and analysis playbook data science depends on six critical elements diagrams pdf to provide visual cues and insights. Share and navigate important information on six stages that need your due attention. This template can be used to pitch topics like analytic opportunities, data, analytic techniques, people, technology, culture. In addtion, this PPT design contains high resolution images, graphics, etc, that are easily editable and available for immediate download.
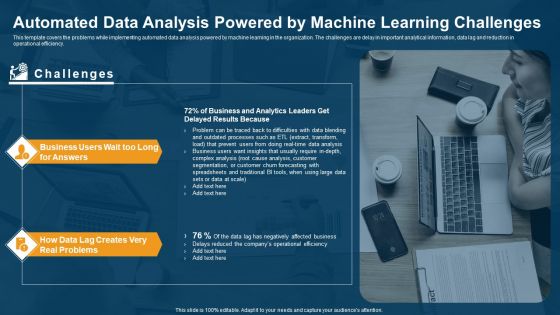
Data Interpretation And Analysis Playbook Automated Data Analysis Powered By Machine Learning Challenges Summary PDF
This template covers the problems while implementing automated data analysis powered by machine learning in the organization. The challenges are delay in important analytical information, data lag and reduction in operational efficiency. Presenting data interpretation and analysis playbook automated data analysis powered by machine learning challenges summary pdf to provide visual cues and insights. Share and navigate important information on two stages that need your due attention. This template can be used to pitch topics like operational, efficiency, business, analysis. In addtion, this PPT design contains high resolution images, graphics, etc, that are easily editable and available for immediate download.
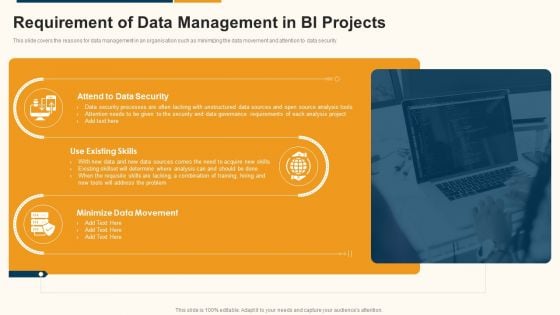
Data Interpretation And Analysis Playbook Requirement Of Data Management In BI Projects Topics PDF
This slide covers the reasons for data management in an organisation such as minimizing the data movement and attention to data security. This is a data interpretation and analysis playbook requirement of data management in bi projects topics pdf template with various stages. Focus and dispense information on three stages using this creative set, that comes with editable features. It contains large content boxes to add your information on topics like attend to data security, use existing skills, minimize data movement. You can also showcase facts, figures, and other relevant content using this PPT layout. Grab it now.
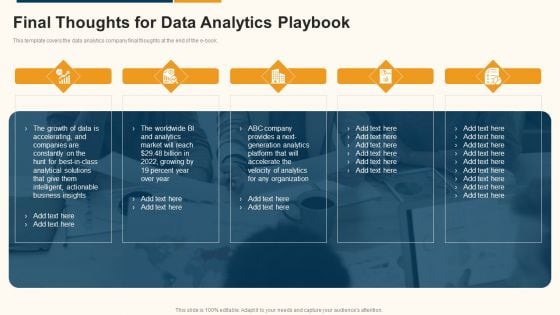
Data Interpretation And Analysis Playbook Final Thoughts For Data Analytics Playbook Graphics PDF
This template covers the data analytics company final thoughts at the end of the e-book. This is a data interpretation and analysis playbook final thoughts for data analytics playbook graphics pdf template with various stages. Focus and dispense information on five stages using this creative set, that comes with editable features. It contains large content boxes to add your information on topics like business, analytics, growth, organization. You can also showcase facts, figures, and other relevant content using this PPT layout. Grab it now.
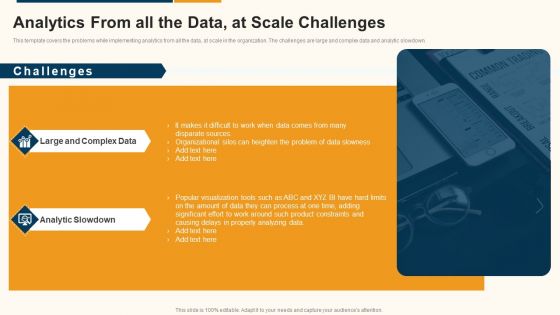
Data Interpretation And Analysis Playbook Analytics From All The Data At Scale Challenges Structure PDF
This template covers the problems while implementing analytics from all the data, at scale in the organization. The challenges are large and complex data and analytic slowdown. This is a data interpretation and analysis playbook analytics from all the data at scale challenges structure pdf template with various stages. Focus and dispense information on two stages using this creative set, that comes with editable features. It contains large content boxes to add your information on topics like large and complex data, analytic slowdown. You can also showcase facts, figures, and other relevant content using this PPT layout. Grab it now.

Data Interpretation And Analysis Playbook The Escalating Value Of Data And Analytics Template PDF
This template covers the facts about bigdata, business intelligence and data analytics. It also depicts that enterprise data and analytics solutions will drive growth and revenue, when optimized for different businesses. Presenting data interpretation and analysis playbook the escalating value of data and analytics template pdf to provide visual cues and insights. Share and navigate important information on seven stages that need your due attention. This template can be used to pitch topics like telecommunications, manufacturing, business, analytics, service. In addtion, this PPT design contains high resolution images, graphics, etc, that are easily editable and available for immediate download.
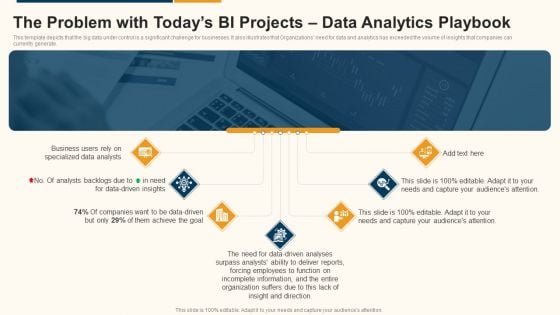
Data Interpretation And Analysis Playbook The Problem With Todays Bi Projects Data Analytics Playbook Introduction PDF
This template depicts that the big data under control is a significant challenge for businesses. It also illustrates that Organizations need for data and analytics has exceeded the volume of insights that companies can currently generate. This is a data interpretation and analysis playbook the problem with todays bi projects data analytics playbook introduction pdf template with various stages. Focus and dispense information on seven stages using this creative set, that comes with editable features. It contains large content boxes to add your information on topics like organization, analysts, business, data driven. You can also showcase facts, figures, and other relevant content using this PPT layout. Grab it now.
Eight Stages Of Pie Chart Data Interpretation Detailed Business Plan PowerPoint Templates
We present our eight stages of pie chart data interpretation detailed business plan PowerPoint templates.Download and present our Competition PowerPoint Templates because You can Stir your ideas in the cauldron of our PowerPoint Templates and Slides. Cast a magic spell on your audience. Download and present our Marketing PowerPoint Templates because You should Kick up a storm with our PowerPoint Templates and Slides. The heads of your listeners will swirl with your ideas. Download and present our Arrows PowerPoint Templates because Your ideas provide food for thought. Our PowerPoint Templates and Slides will help you create a dish to tickle the most discerning palate. Present our Circle Charts PowerPoint Templates because You can Stir your ideas in the cauldron of our PowerPoint Templates and Slides. Cast a magic spell on your audience. Download our Business PowerPoint Templates because You can Score a slam dunk with our PowerPoint Templates and Slides. Watch your audience hang onto your every word.Use these PowerPoint slides for presentations relating to chart, graph, pie, 3d, diagram, graphic, icon, control, business, data, profit, market, sales, display, corporate, concept, render, success, presentation, finance, report, marketing, accounting, management, piece, strategy, money, growth, company, competition, progress, account, sheet, part, information, investment, improvement, banking, index, financial, reflect, results, performance, exchange. The prominent colors used in the PowerPoint template are Blue, Black, Gray. Exult in the comfort of our Eight Stages Of Pie Chart Data Interpretation Detailed Business Plan PowerPoint Templates. Experience the convenience they deliver.

Mba Models And Frameworks Eight Stages Of Pie Chart Data Interpretation 8 Stages Consulting Diagram
Be The Doer With Our MBA Models And Frameworks Eight Stages Of Pie Chart Data Interpretation 8 Stages Consulting Diagram Powerpoint Templates. Put Your Thoughts Into Practice.
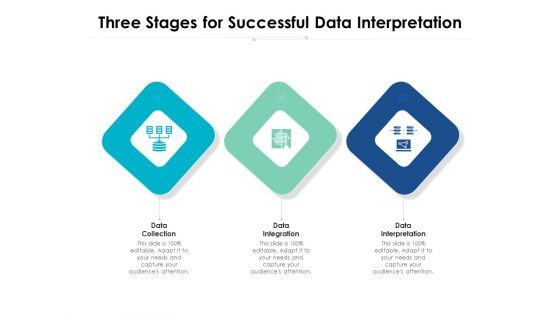
Three Stages For Successful Data Interpretation Ppt PowerPoint Presentation Outline Microsoft PDF
Presenting three stages for successful data interpretation ppt powerpoint presentation outline microsoft pdf to dispense important information. This template comprises three stages. It also presents valuable insights into the topics including data collection, data integration, data interpretation. This is a completely customizable PowerPoint theme that can be put to use immediately. So, download it and address the topic impactfully.

Cog Wheel Circle Graph Gear Internet Marketing Data Interpretation Ppt PowerPoint Presentation Complete Deck
Presenting this set of slides with name cog wheel circle graph gear internet marketing data interpretation ppt powerpoint presentation complete deck. The topics discussed in these slides are gear, internet marketing, data interpretation, data management, marketing expenditures. This is a completely editable PowerPoint presentation and is available for immediate download. Download now and impress your audience.
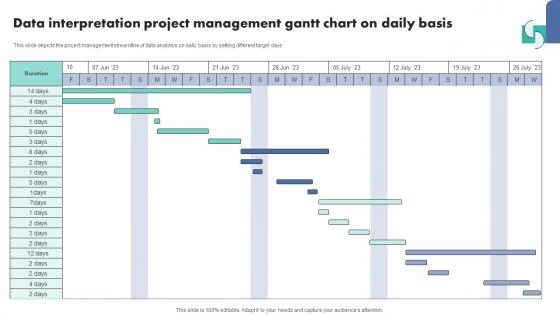
Data Interpretation Project Management Gantt Chart On Daily Basis Template Pdf
Showcasing this set of slides titled Data Interpretation Project Management Gantt Chart On Daily Basis Template Pdf The topics addressed in these templates are Data Interpretation Icon, Measure Business Growth All the content presented in this PPT design is completely editable. Download it and make adjustments in color, background, font etc. as per your unique business setting. Our Data Interpretation Project Management Gantt Chart On Daily Basis Template Pdf are topically designed to provide an attractive backdrop to any subject. Use them to look like a presentation pro.

Data Interpretation Implementation Review And Evaluation Ppt PowerPoint Presentation Infographics Example
This is a data interpretation implementation review and evaluation ppt powerpoint presentation infographics example. This is a four stage process. The stages in this process are data analysis, data review, data evaluation.
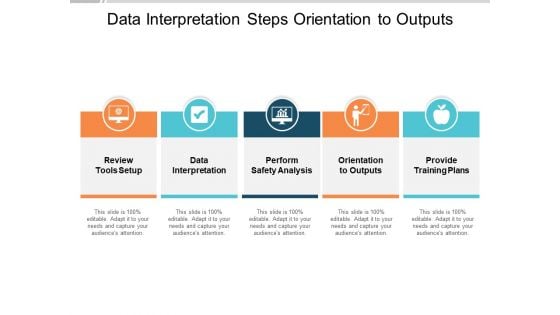
Data Interpretation Steps Orientation To Outputs Ppt PowerPoint Presentation Slides Maker
This is a data interpretation implementation review and evaluation ppt powerpoint presentation infographics example. This is a five stage process. The stages in this process are data analysis, data review, data evaluation.
Data Interpretation With Tick Mark Simplify Vector Icon Ppt PowerPoint Presentation Gallery Format Ideas PDF
Pitch your topic with ease and precision using this data interpretation with tick mark simplify vector icon ppt powerpoint presentation gallery format ideas pdf. This layout presents information on data interpretation with tick mark simplify vector icon. It is also available for immediate download and adjustment. So, changes can be made in the color, design, graphics or any other component to create a unique layout.
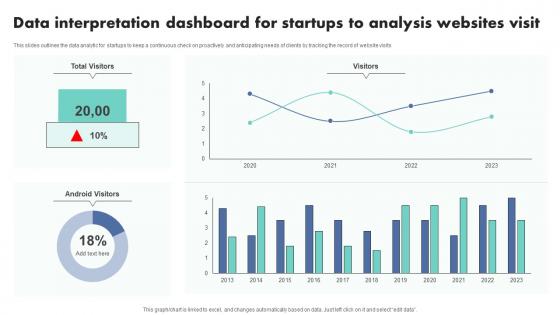
Data Interpretation Dashboard For Startups To Analysis Websites Visit Themes Pdf
This slides outlines the data analytic for startups to keep a continuous check on proactively and anticipating needs of clients by tracking the record of website visits.Showcasing this set of slides titled Data Interpretation Dashboard For Startups To Analysis Websites Visit Themes Pdf The topics addressed in these templates are Data Interpretation, Dashboard Startups, Analysis Websites Visit All the content presented in this PPT design is completely editable. Download it and make adjustments in color, background, font etc. as per your unique business setting. This slides outlines the data analytic for startups to keep a continuous check on proactively and anticipating needs of clients by tracking the record of website visits.

Data Interpretation Implementation Review And Evaluation Ppt PowerPoint Presentation Pictures Vector
Presenting this set of slides with name data interpretation implementation review and evaluation ppt powerpoint presentation pictures vector. This is a four stage process. The stages in this process are Data analysis, Data Review, Data Evaluation. This is a completely editable PowerPoint presentation and is available for immediate download. Download now and impress your audience.
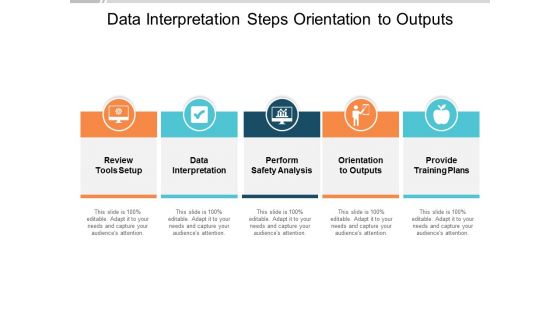
Data Interpretation Steps Orientation To Outputs Ppt PowerPoint Presentation Outline Graphics
Presenting this set of slides with name data interpretation steps orientation to outputs ppt powerpoint presentation outline graphics. This is a five stage process. The stages in this process are Data analysis, Data Review, Data Evaluation. This is a completely editable PowerPoint presentation and is available for immediate download. Download now and impress your audience.

Data Interpretation And Analysis Playbook Purpose Of This Playbook Formats PDF
Presenting data interpretation and analysis playbook purpose of this playbook formats pdf to provide visual cues and insights. Share and navigate important information on four stages that need your due attention. This template can be used to pitch topics like purpose of this playbook. In addtion, this PPT design contains high resolution images, graphics, etc, that are easily editable and available for immediate download.
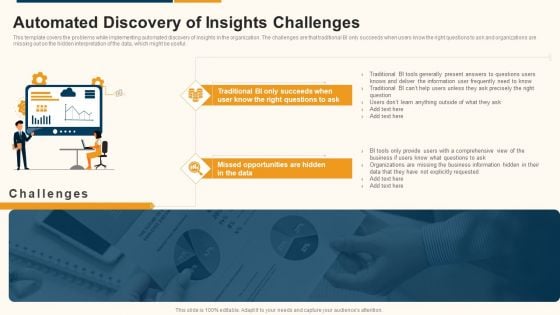
Data Interpretation And Analysis Playbook Automated Discovery Of Insights Challenges Clipart PDF
This template covers the problems while implementing automated discovery of insights in the organization. The challenges are that traditional BI only succeeds when users know the right questions to ask and organizations are missing out on the hidden interpretation of the data, which might be useful. This is a data interpretation and analysis playbook automated discovery of insights challenges clipart pdf template with various stages. Focus and dispense information on two stages using this creative set, that comes with editable features. It contains large content boxes to add your information on topics like opportunities, organizations, business. You can also showcase facts, figures, and other relevant content using this PPT layout. Grab it now.

Technology And Skills Matrix For Data Interpretation And Evaluation Lifecycle Phases Slides PDF
This slide covers the matrix representing technology and skills required for each phase of data analytics and assessment infrastructure lifecycle. It includes four phases of analytics infrastructure lifecycle such as ingestion, data quality and governance, data lake administration and analytics. Presenting Technology And Skills Matrix For Data Interpretation And Evaluation Lifecycle Phases Slides PDF to dispense important information. This template comprises four stages. It also presents valuable insights into the topics including Ingestion, Data Lake Administration, Data Quality And Governance. This is a completely customizable PowerPoint theme that can be put to use immediately. So, download it and address the topic impactfully.
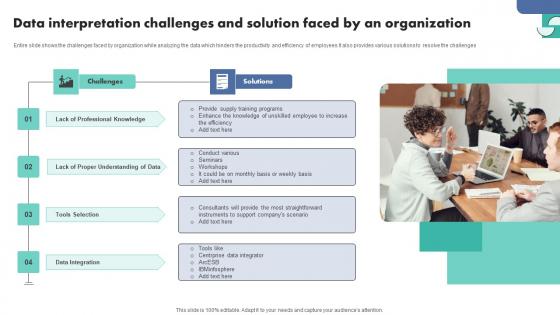
Data Interpretation Challenges And Solution Faced By An Organization Infographics Pdf
Entire slide shows the challenges faced by organization while analyzing the data which hinders the productivity and efficiency of employees It also provides various solutions to resolve the challenges.Pitch your topic with ease and precision using this Data Interpretation Challenges And Solution Faced By An Organization Infographics Pdf This layout presents information on Professional Knowledge, Proper Understanding Data, Tools Selection It is also available for immediate download and adjustment. So, changes can be made in the color, design, graphics or any other component to create a unique layout. Entire slide shows the challenges faced by organization while analyzing the data which hinders the productivity and efficiency of employees It also provides various solutions to resolve the challenges.

Ways For Data Interpretation To Increase Profit In Financial Services Sample Pdf
Entire slide shows the different ways of data analysis to generate maximum of profit in financial sector which assist in gaining personalize customer services to retain the cilents. It includes boosting levers, identify new sources, etc.Pitch your topic with ease and precision using this Ways For Data Interpretation To Increase Profit In Financial Services Sample Pdf This layout presents information on Boosting Traditional, Sources Growth, Analytics Capabilities It is also available for immediate download and adjustment. So, changes can be made in the color, design, graphics or any other component to create a unique layout. Entire slide shows the different ways of data analysis to generate maximum of profit in financial sector which assist in gaining personalize customer services to retain the cilents. It includes boosting levers, identify new sources, etc.
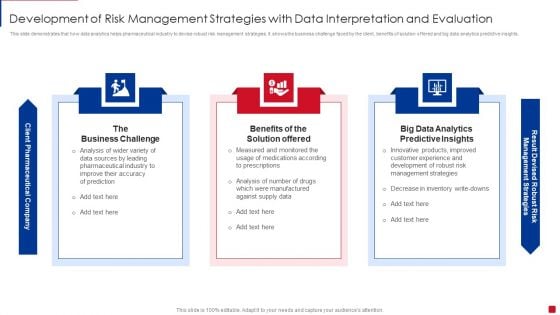
Development Of Risk Management Strategies With Data Interpretation And Evaluation Summary PDF
This slide demonstrates that how data analytics helps pharmaceutical industry to devise robust risk management strategies. It shows the business challenge faced by the client, benefits of solution offered and big data analytics predictive insights. Persuade your audience using this Development Of Risk Management Strategies With Data Interpretation And Evaluation Summary PDF. This PPT design covers three stages, thus making it a great tool to use. It also caters to a variety of topics including Business Challenge, Benefits Solution Offered, Big Data Analytics. Download this PPT design now to present a convincing pitch that not only emphasizes the topic but also showcases your presentation skills.
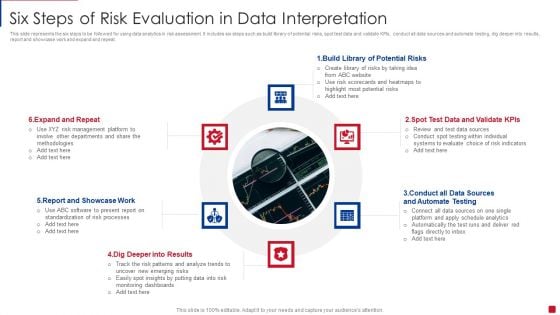
Six Steps Of Risk Evaluation In Data Interpretation Sources Brochure PDF
This slide represents the six steps to be followed for using data analytics in risk assessment. It includes six steps such as build library of potential risks, spot test data and validate KPIs, conduct all data sources and automate testing, dig deeper into results, report and showcase work and expand and repeat. Presenting Six Steps Of Risk Evaluation In Data Interpretation Sources Brochure PDF to dispense important information. This template comprises ten stages. It also presents valuable insights into the topics including Target Personas, Define The Questions, Define The Business Model. This is a completely customizable PowerPoint theme that can be put to use immediately. So, download it and address the topic impactfully.
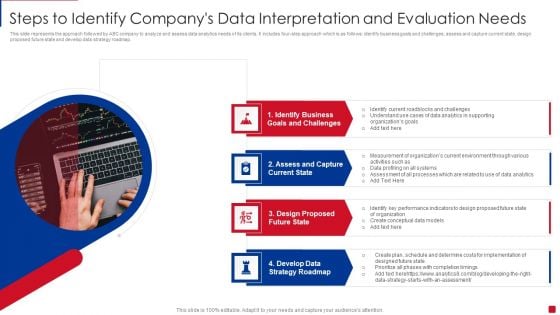
Steps To Identify Companys Data Interpretation And Evaluation Needs Portrait PDF
This slide represents the approach followed by ABC company to analyze and assess data analytics needs of its clients. It includes four step approach which is as follows identify business goals and challenges, assess and capture current state, design proposed future state and develop data strategy roadmap Presenting Steps To Identify Companys Data Interpretation And Evaluation Needs Portrait PDF to dispense important information. This template comprises four stages. It also presents valuable insights into the topics including Assess Current State, Business Goals Challenges, Design Future State. This is a completely customizable PowerPoint theme that can be put to use immediately. So, download it and address the topic impactfully.

Data Interpretation And Analysis Playbook Business Intelligence And Predictive Analytics Challenges Template PDF
This template covers the problems while implementing BI and predictive analytics in the organization. The challenges are undefined KPIs and metrics, and unable to hire right data science talent. Presenting data interpretation and analysis playbook business intelligence and predictive analytics challenges template pdf to provide visual cues and insights. Share and navigate important information on two stages that need your due attention. This template can be used to pitch topics like security vulnerabilities, operationalizing, perform analysis, deployed. In addtion, this PPT design contains high resolution images, graphics, etc, that are easily editable and available for immediate download.
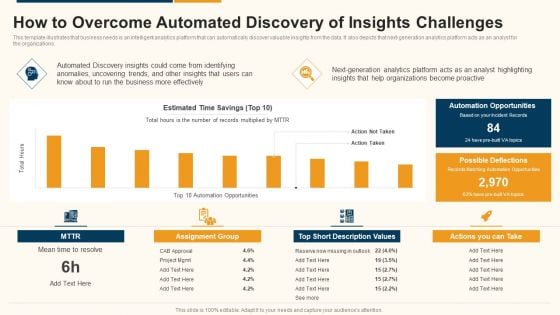
Data Interpretation And Analysis Playbook How To Overcome Automated Discovery Of Insights Challenges Rules PDF
This template illustrates that business needs is an intelligent analytics platform that can automatically discover valuable insights from the data. It also depicts that next-generation analytics platform acts as an analyst for the organizations. Deliver an awe inspiring pitch with this creative data interpretation and analysis playbook how to overcome automated discovery of insights challenges rules pdf bundle. Topics like opportunities, organizations, analytics, business can be discussed with this completely editable template. It is available for immediate download depending on the needs and requirements of the user.
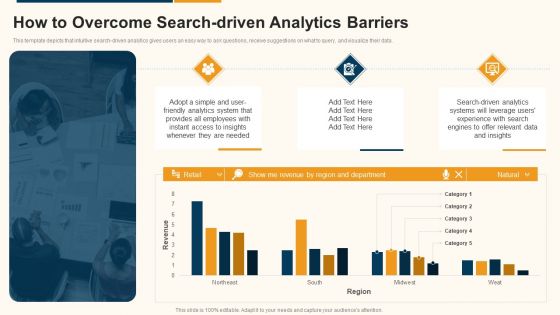
Data Interpretation And Analysis Playbook How To Overcome Search Driven Analytics Barriers Summary PDF
This template depicts that intuitive search-driven analytics gives users an easy way to ask questions, receive suggestions on what to query, and visualize their data. Deliver and pitch your topic in the best possible manner with this data interpretation and analysis playbook how to overcome search driven analytics barriers summary pdf. Use them to share invaluable insights on how to overcome search driven analytics barriers and impress your audience. This template can be altered and modified as per your expectations. So, grab it now.
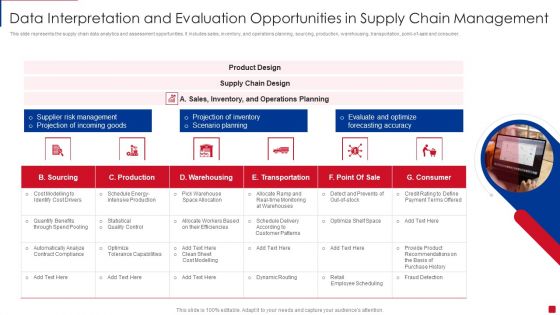
Data Interpretation And Evaluation Opportunities In Supply Chain Management Structure PDF
This slide represents the supply chain data analytics and assessment opportunities. It includes sales, inventory, and operations planning, sourcing, production, warehousing, transportation, point of sale and consumer. Presenting Data Interpretation And Evaluation Opportunities In Supply Chain Management Structure PDF to dispense important information. This template comprises six stages. It also presents valuable insights into the topics including Supplier Risk Management, Projection Of Incoming Goods, Projection Of Inventory. This is a completely customizable PowerPoint theme that can be put to use immediately. So, download it and address the topic impactfully.
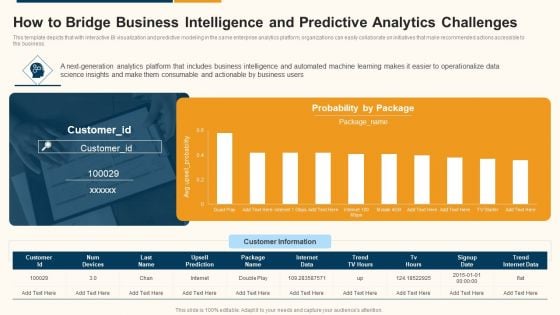
Data Interpretation And Analysis Playbook How To Bridge Business Intelligence And Predictive Analytics Challenges Designs PDF
This template depicts that with interactive BI visualization and predictive modeling in the same enterprise analytics platform, organizations can easily collaborate on initiatives that make recommended actions accessible to the business. Deliver an awe inspiring pitch with this creative data interpretation and analysis playbook how to bridge business intelligence and predictive analytics challenges designs pdf bundle. Topics like how to bridge business intelligence and predictive analytics challenges can be discussed with this completely editable template. It is available for immediate download depending on the needs and requirements of the user.
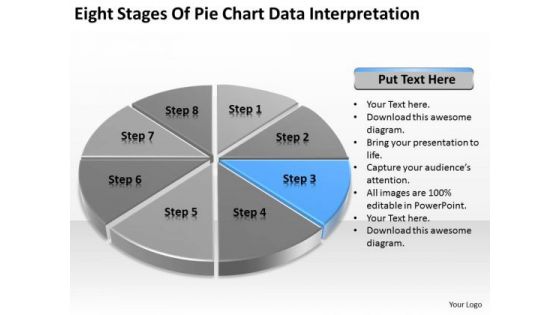
Eight Stages Of Pie Chart Data Interpretation Business Plan PowerPoint Slides
We present our eight stages of pie chart data interpretation business plan PowerPoint Slides.Use our Competition PowerPoint Templates because Our PowerPoint Templates and Slides will let you Clearly mark the path for others to follow. Download and present our Marketing PowerPoint Templates because Our PowerPoint Templates and Slides will weave a web of your great ideas. They are gauranteed to attract even the most critical of your colleagues. Present our Arrows PowerPoint Templates because Our PowerPoint Templates and Slides will let you Hit the target. Go the full distance with ease and elan. Use our Circle Charts PowerPoint Templates because You have gained great respect for your brilliant ideas. Use our PowerPoint Templates and Slides to strengthen and enhance your reputation. Download our Business PowerPoint Templates because You are an avid believer in ethical practices. Highlight the benefits that accrue with our PowerPoint Templates and Slides.Use these PowerPoint slides for presentations relating to chart, graph, pie, 3d, diagram, graphic, icon, control, business, data, profit, market, sales, display, corporate, concept, render, success, presentation, finance, report, marketing, accounting, management, piece, strategy, money, growth, company, competition, progress, account, sheet, part, information, investment, improvement, banking, index, financial, reflect, results, performance, exchange. The prominent colors used in the PowerPoint template are Blue, Black, Gray. Great presentations happen with our Eight Stages Of Pie Chart Data Interpretation Business Plan PowerPoint Slides. Try us out and see what a difference our templates make.
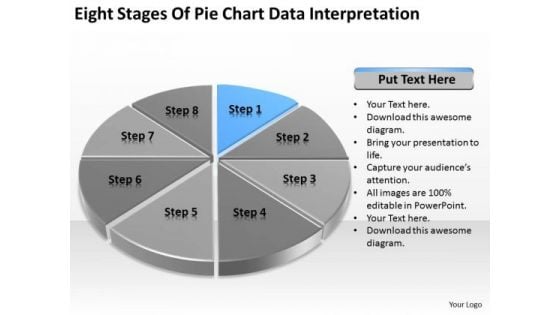
Eight Stages Of Pie Chart Data Interpretation Business Plan PowerPoint Templates
We present our eight stages of pie chart data interpretation business plan PowerPoint templates.Download and present our Competition PowerPoint Templates because Our PowerPoint Templates and Slides will embellish your thoughts. See them provide the desired motivation to your team. Download and present our Marketing PowerPoint Templates because You should Press the right buttons with our PowerPoint Templates and Slides. They will take your ideas down the perfect channel. Download our Arrows PowerPoint Templates because Your ideas provide food for thought. Our PowerPoint Templates and Slides will help you create a dish to tickle the most discerning palate. Use our Circle Charts PowerPoint Templates because You can Raise a toast with our PowerPoint Templates and Slides. Spread good cheer amongst your audience. Download and present our Business PowerPoint Templates because Our PowerPoint Templates and Slides will let your ideas bloom. Create a bed of roses for your audience.Use these PowerPoint slides for presentations relating to chart, graph, pie, 3d, diagram, graphic, icon, control, business, data, profit, market, sales, display, corporate, concept, render, success, presentation, finance, report, marketing, accounting, management, piece, strategy, money, growth, company, competition, progress, account, sheet, part, information, investment, improvement, banking, index, financial, reflect, results, performance, exchange. The prominent colors used in the PowerPoint template are Blue, Black, Gray. Our Eight Stages Of Pie Chart Data Interpretation Business Plan PowerPoint Templates capture the attention of your audience. With our money back guarantee you have nothing to lose.
Data Interpretation Statistical Diagram PowerPoint Templates Ppt Backgrounds For Slides 0313
We present our Data Interpretation Statistical Diagram PowerPoint Templates PPT Backgrounds For Slides 0313.Download and present our Pie Charts PowerPoint Templates because You can Connect the dots. Fan expectations as the whole picture emerges. Download our Business PowerPoint Templates because They will Put your wonderful verbal artistry on display. Our PowerPoint Templates and Slides will provide you the necessary glam and glitter. Use our Future PowerPoint Templates because Timeline crunches are a fact of life. Meet all deadlines using our PowerPoint Templates and Slides. Present our Marketing PowerPoint Templates because Our PowerPoint Templates and Slides offer you the needful to organise your thoughts. Use them to list out your views in a logical sequence. Download and present our Success PowerPoint Templates because Our PowerPoint Templates and Slides will let your team Walk through your plans. See their energy levels rise as you show them the way.Use these PowerPoint slides for presentations relating to Business statistics, pie charts, business, future, marketing, success. The prominent colors used in the PowerPoint template are Blue, Blue light, Red. Breathe deep and easy with our Data Interpretation Statistical Diagram PowerPoint Templates Ppt Backgrounds For Slides 0313. They remove any constriction you experience.

 Home
Home