Data Visualization
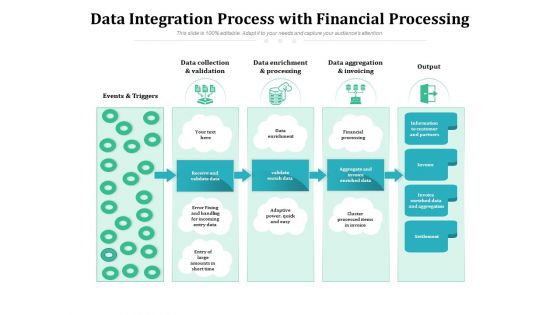
Data Integration Process With Financial Processing Ppt PowerPoint Presentation Gallery Visuals PDF
Presenting this set of slides with name data integration process with financial processing ppt powerpoint presentation gallery visuals pdf. The topics discussed in these slides are validation, processing, invoicing. This is a completely editable PowerPoint presentation and is available for immediate download. Download now and impress your audience.

Data Management Model With Technology Infrastructure Ppt PowerPoint Presentation Model Visuals PDF
Presenting this set of slides with name data management model with technology infrastructure ppt powerpoint presentation model visuals pdf. This is a six stage process. The stages in this process are strategy, policies, processes, rules and standards, communication, announcements, structure, personnel, organization, technology, infrastructure, monitoring, optimization. This is a completely editable PowerPoint presentation and is available for immediate download. Download now and impress your audience.
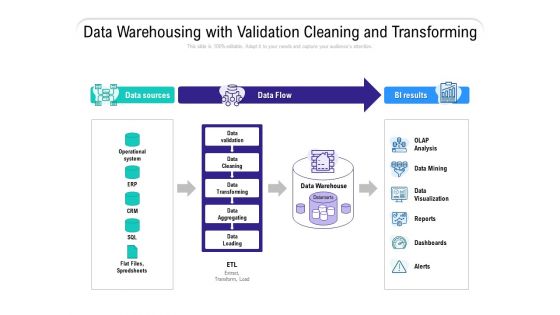
Data Warehousing With Validation Cleaning And Transforming Ppt PowerPoint Presentation Professional Visuals
Presenting this set of slides with name data warehousing with validation cleaning and transforming ppt powerpoint presentation professional visuals. This is a three stage process. The stages in this process are data sources, data flow, bi results, operational system, erp, crm, sql, flat files, spredsheets, olap analysis, data mining, data visualization, reports, dashboards, alerts. This is a completely editable PowerPoint presentation and is available for immediate download. Download now and impress your audience.
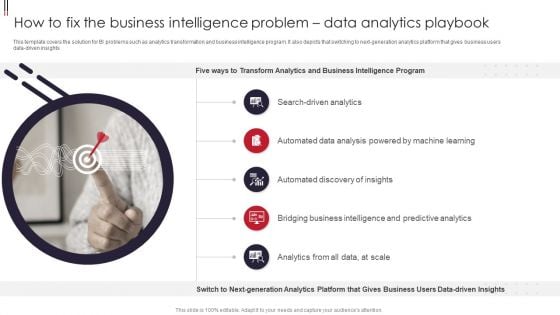
Information Visualizations Playbook How To Fix The Business Intelligence Problem Data Analytics Playbook Guidelines PDF
This template covers the solution for BI problems such as analytics transformation and business intelligence program. It also depicts that switching to next generation analytics platform that gives business users data driven insights. This is a Information Visualizations Playbook How To Fix The Business Intelligence Problem Data Analytics Playbook Guidelines PDF template with various stages. Focus and dispense information on five stages using this creative set, that comes with editable features. It contains large content boxes to add your information on topics like Search Driven Analytics, Bridging Business Intelligence, Predictive Analytics. You can also showcase facts, figures, and other relevant content using this PPT layout. Grab it now.
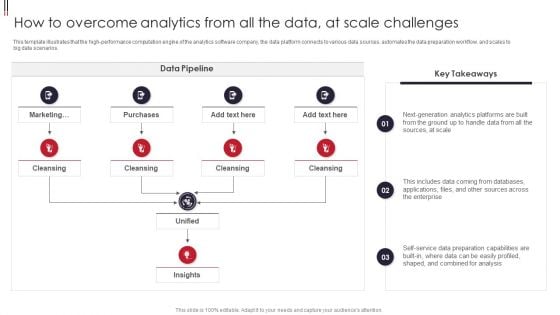
Information Visualizations Playbook How To Overcome Analytics From All The Data At Scale Challenges Mockup PDF
This template illustrates that the high performance computation engine of the analytics software company, the data platform connects to various data sources, automates the data preparation workflow, and scales to big data scenarios. Deliver an awe inspiring pitch with this creative Information Visualizations Playbook How To Overcome Analytics From All The Data At Scale Challenges Mockup PDF bundle. Topics like Purchases, Marketing, Data Pipeline can be discussed with this completely editable template. It is available for immediate download depending on the needs and requirements of the user.
Data Transfer And Storage Folders Vector Icon Ppt PowerPoint Presentation Gallery Visuals PDF
Presenting data transfer and storage folders vector icon ppt powerpoint presentation gallery visuals pdf to dispense important information. This template comprises three stages. It also presents valuable insights into the topics including data transfer and storage folders vector icon. This is a completely customizable PowerPoint theme that can be put to use immediately. So, download it and address the topic impactfully.
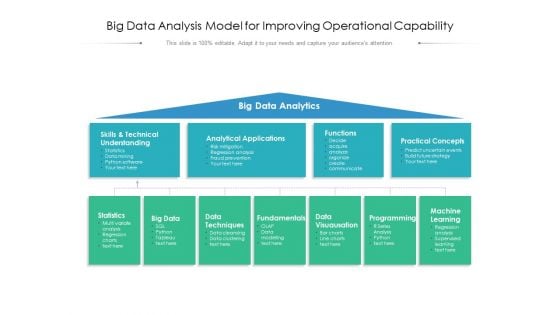
Big Data Analysis Model For Improving Operational Capability Ppt PowerPoint Presentation Infographics Visuals PDF
Presenting this set of slides with name big data analysis model for improving operational capability ppt powerpoint presentation infographics visuals pdf. This is a one stage process. The stages in this process are big data analytics, skills and technical understanding, analytical applications, functions, practical concepts, statistics, big data, data techniques, fundamentals, data visuausation, programming, machine learning. This is a completely editable PowerPoint presentation and is available for immediate download. Download now and impress your audience.
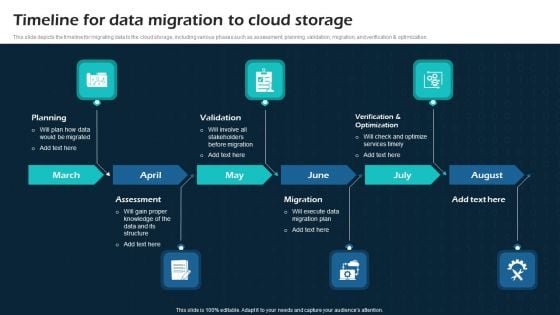
Timeline For Data Migration To Cloud Storage Virtual Cloud Network IT Ppt Visual Aids Example 2015 PDF
This slide depicts the timeline for migrating data to the cloud storage, including various phases such as assessment, planning, validation, migration, and verification and optimization. Presenting this PowerPoint presentation, titled Timeline For Data Migration To Cloud Storage Virtual Cloud Network IT Ppt Visual Aids Example 2015 PDF, with topics curated by our researchers after extensive research. This editable presentation is available for immediate download and provides attractive features when used. Download now and captivate your audience. Presenting this Timeline For Data Migration To Cloud Storage Virtual Cloud Network IT Ppt Visual Aids Example 2015 PDF. Our researchers have carefully researched and created these slides with all aspects taken into consideration. This is a completely customizable Timeline For Data Migration To Cloud Storage Virtual Cloud Network IT Ppt Visual Aids Example 2015 PDF that is available for immediate downloading. Download now and make an impact on your audience. Highlight the attractive features available with our PPTs.
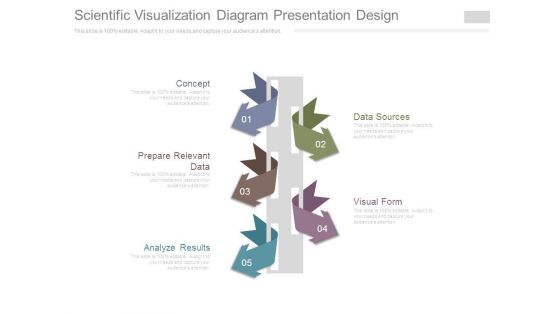
Scientific Visualization Diagram Presentation Design
This is a scientific visualization diagram presentation design. This is a five stage process. The stages in this process are concept, prepare relevant data, analyze results, data sources, visual form.
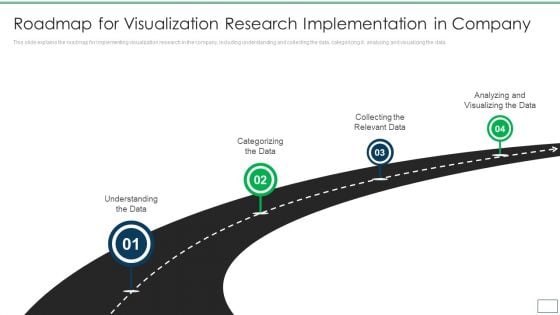
Departments Of Visualization Research Roadmap For Visualization Research Summary PDF
This slide explains the roadmap for implementing visualization research in the company, including understanding and collecting the data, categorizing it, analyzing and visualizing the data. This is a Departments Of Visualization Research Roadmap For Visualization Research Summary PDF template with various stages. Focus and dispense information on four stages using this creative set, that comes with editable features. It contains large content boxes to add your information on topics like Understanding The Data, Categorizing The Data, Collecting The Relevant Data You can also showcase facts, figures, and other relevant content using this PPT layout. Grab it now.
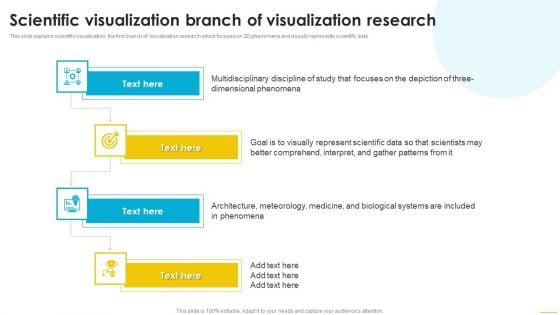
Scientific Visualization Branch Of Visualization Research Demonstration PDF
This slide explains scientific visualization, the first branch of visualization research which focuses on 3D phenomena and visually represents scientific data. Do you have an important presentation coming up Are you looking for something that will make your presentation stand out from the rest Look no further than Scientific Visualization Branch Of Visualization Research Demonstration PDF. With our professional designs, you can trust that your presentation will pop and make delivering it a smooth process. And with Slidegeeks, you can trust that your presentation will be unique and memorable. So why wait Grab Scientific Visualization Branch Of Visualization Research Demonstration PDF today and make your presentation stand out from the rest.
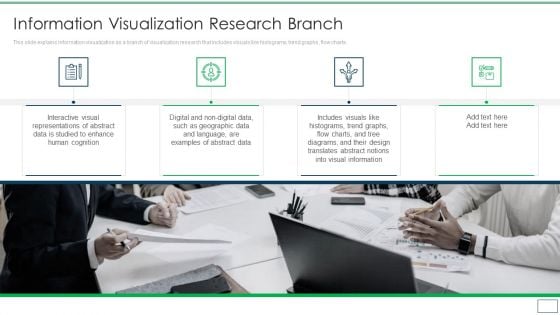
Departments Of Visualization Research Information Visualization Research Branch Clipart PDF
This slide explains information visualization as a branch of visualization research that includes visuals like histograms, trend graphs, flow charts.Presenting Departments Of Visualization Research Information Visualization Research Branch Clipart PDF to provide visual cues and insights. Share and navigate important information on four stages that need your due attention. This template can be used to pitch topics like Interactive Visual, Representations Of Abstract, Information In addtion, this PPT design contains high resolution images, graphics, etc, that are easily editable and available for immediate download.
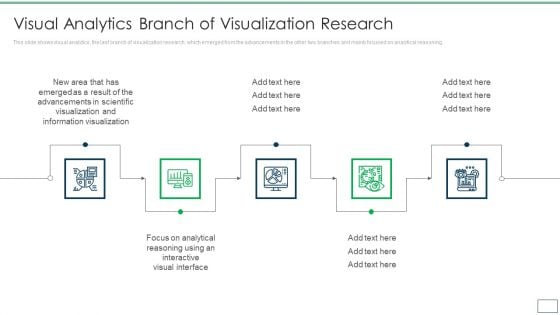
Departments Of Visualization Research Visual Analytics Branch Of Visualization Research Information PDF
This slide shows visual analytics, the last branch of visualization research, which emerged from the advancements in the other two branches and mainly focused on analytical reasoning.Presenting Departments Of Visualization Research Visual Analytics Branch Of Visualization Research Information PDF to provide visual cues and insights. Share and navigate important information on five stages that need your due attention. This template can be used to pitch topics like Information Visualization, Advancements In Scientific, Interactive Visual Interface In addtion, this PPT design contains high resolution images, graphics, etc, that are easily editable and available for immediate download.
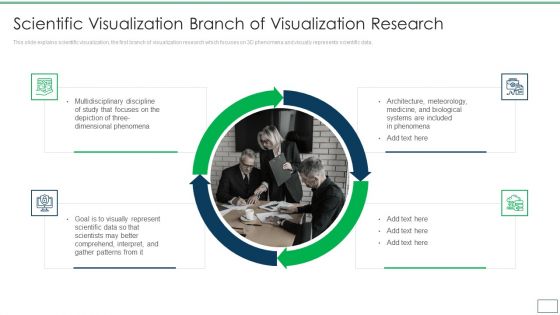
Departments Of Visualization Research Scientific Visualization Branch Of Visualization Research Brochure PDF
This slide explains scientific visualization, the first branch of visualization research which focuses on 3D phenomena and visually represents scientific data.This is a Departments Of Visualization Research Scientific Visualization Branch Of Visualization Research Brochure PDF template with various stages. Focus and dispense information on four stages using this creative set, that comes with editable features. It contains large content boxes to add your information on topics like Architecture Meteorology, Medicine And Biological, Scientists May Better You can also showcase facts, figures, and other relevant content using this PPT layout. Grab it now.
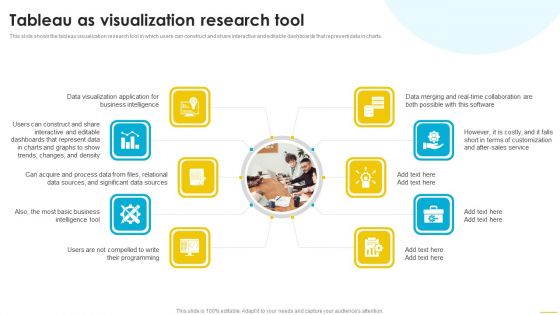
Tableau As Visualization Research Tool Inspiration PDF
This slide shows the tableau visualization research tool in which users can construct and share interactive and editable dashboards that represent data in charts. Find highly impressive Tableau As Visualization Research Tool Inspiration PDF on Slidegeeks to deliver a meaningful presentation. You can save an ample amount of time using these presentation templates. No need to worry to prepare everything from scratch because Slidegeeks experts have already done a huge research and work for you. You need to download Tableau As Visualization Research Tool Inspiration PDF for your upcoming presentation. All the presentation templates are 100 percent editable and you can change the color and personalize the content accordingly. Download now.
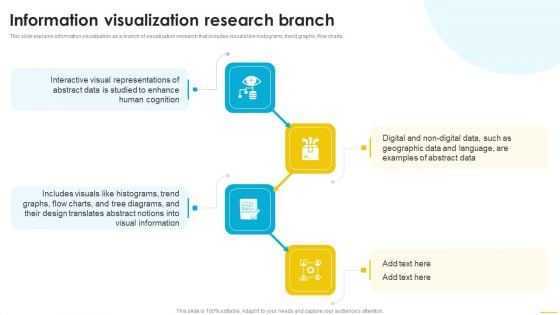
Information Visualization Research Branch Template PDF
This slide explains information visualization as a branch of visualization research that includes visuals like histograms, trend graphs, flow charts. Slidegeeks is here to make your presentations a breeze with Information Visualization Research Branch Template PDF With our easy to use and customizable templates, you can focus on delivering your ideas rather than worrying about formatting. With a variety of designs to choose from, you are sure to find one that suits your needs. And with animations and unique photos, illustrations, and fonts, you can make your presentation pop. So whether you are giving a sales pitch or presenting to the board, make sure to check out Slidegeeks first.
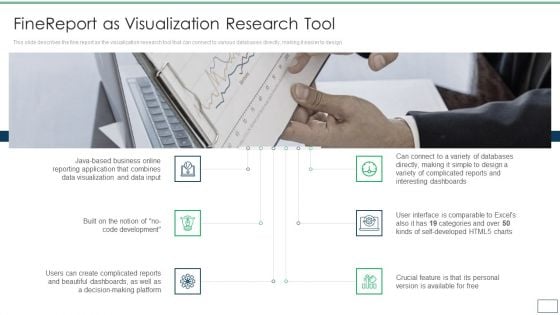
Departments Of Visualization Research Finereport As Visualization Research Tool Elements PDF
This slide describes the fine report as the visualization research tool that can connect to various databases directly, making it easier to design.Presenting Departments Of Visualization Research Finereport As Visualization Research Tool Elements PDF to provide visual cues and insights. Share and navigate important information on six stages that need your due attention. This template can be used to pitch topics like Reporting Application, Visualization And Data, Complicated Reports In addtion, this PPT design contains high resolution images, graphics, etc, that are easily editable and available for immediate download.
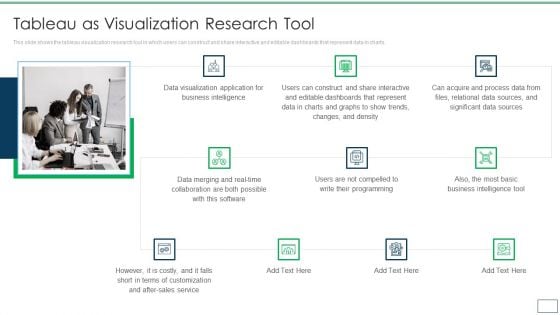
Departments Of Visualization Research Tableau As Visualization Research Tool Demonstration PDF
This slide shows the tableau visualization research tool in which users can construct and share interactive and editable dashboards that represent data in charts.Presenting Departments Of Visualization Research Tableau As Visualization Research Tool Demonstration PDF to provide visual cues and insights. Share and navigate important information on ten stages that need your due attention. This template can be used to pitch topics like Business Intelligence, Dashboards That Represent, Business Intelligence In addtion, this PPT design contains high resolution images, graphics, etc, that are easily editable and available for immediate download.
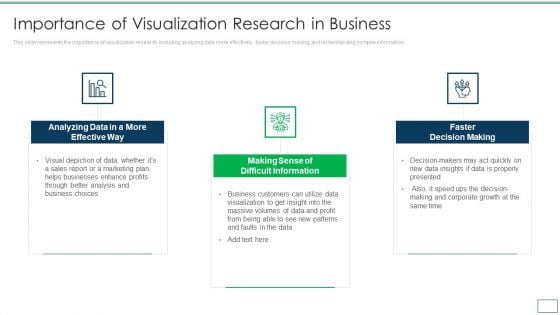
Departments Of Visualization Research Importance Of Visualization Research In Business Designs PDF
This slide represents the importance of visualization research, including analyzing data more effectively, faster decision making, and understanding complex information.This is a Departments Of Visualization Research Importance Of Visualization Research In Business Designs PDF template with various stages. Focus and dispense information on three stages using this creative set, that comes with editable features. It contains large content boxes to add your information on topics like Analyzing Data In A More Effective, Making Sense Of Difficult Information, Faster Decision Making You can also showcase facts, figures, and other relevant content using this PPT layout. Grab it now.
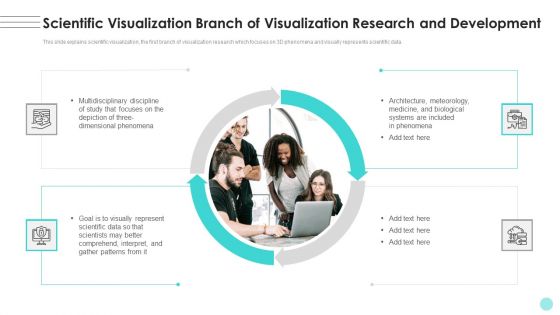
Branches For Visualization Research And Development Scientific Visualization Branch Of Clipart PDF
This slide explains scientific visualization, the first branch of visualization research which focuses on 3D phenomena and visually represents scientific data. Make sure to capture your audiences attention in your business displays with our gratis customizable Branches For Visualization Research And Development Scientific Visualization Branch Of Clipart PDF. These are great for business strategies, office conferences, capital raising or task suggestions. If you desire to acquire more customers for your tech business and ensure they stay satisfied, create your own sales presentation with these plain slides.
Departments Of Visualization 30 60 90 Days Plan For Visualization Research Icons PDF
This slide shows the 30 60 90 days plan for visualization research, such as knowing and sorting the data, analyzing the information, and different tools required. Presenting Departments Of Visualization 30 60 90 Days Plan For Visualization Research Icons PDF to provide visual cues and insights. Share and navigate important information on three stages that need your due attention. This template can be used to pitch topics like Obtaining The Necessary Information, Sorting The Information, Analyzing The Information In addtion, this PPT design contains high resolution images, graphics, etc, that are easily editable and available for immediate download.
Information Visualization Vector Icon Ppt PowerPoint Presentation Ideas Microsoft
Presenting this set of slides with name information visualization vector icon ppt powerpoint presentation ideas microsoft. This is a three stage process. The stages in this process are data visualization icon, research analysis, business focus. This is a completely editable PowerPoint presentation and is available for immediate download. Download now and impress your audience.
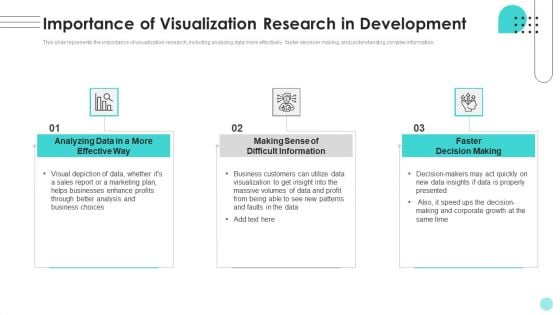
Branches For Visualization Research And Development Importance Of Visualization Research Mockup PDF
This slide represents the importance of visualization research, including analyzing data more effectively, faster decision making, and understanding complex information. Find highly impressive Branches For Visualization Research And Development Importance Of Visualization Research Mockup PDF on Slidegeeks to deliver a meaningful presentation. You can save an ample amount of time using these presentation templates. No need to worry to prepare everything from scratch because Slidegeeks experts have already done a huge research and work for you. You need to download Branches For Visualization Research And Development Importance Of Visualization Research Mockup PDF for your upcoming presentation. All the presentation templates are 100 percent editable and you can change the color and personalize the content accordingly. Download now.
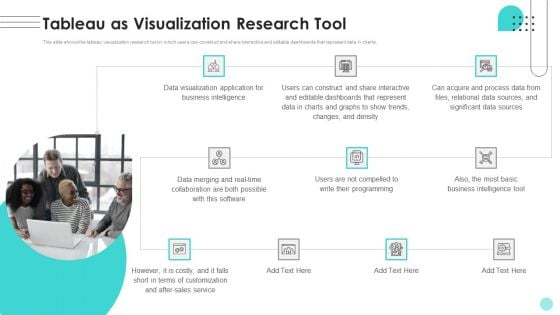
Branches For Visualization Research And Development Tableau As Visualization Research Introduction PDF
This slide shows the tableau visualization research tool in which users can construct and share interactive and editable dashboards that represent data in charts. This modern and well-arranged Branches For Visualization Research And Development Tableau As Visualization Research Introduction PDF provides lots of creative possibilities. It is very simple to customize and edit with the Powerpoint Software. Just drag and drop your pictures into the shapes. All facets of this template can be edited with Powerpoint, no extra software is necessary. Add your own material, put your images in the places assigned for them, adjust the colors, and then you can show your slides to the world, with an animated slide included.
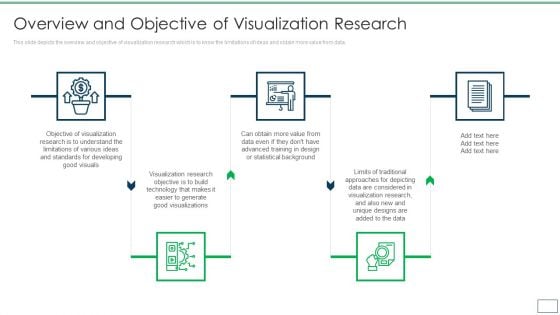
Departments Of Visualization Research Overview And Objective Of Visualization Research Summary PDF
Presenting Departments Of Visualization Research Overview And Objective Of Visualization Research summary PDF to provide visual cues and insights. Share and navigate important information on five stages that need your due attention.This template can be used to pitch topics like Visualization Research, Generate Good Visualization, Advanced Training In addtion, this PPT design contains high resolution images, graphics, etc, that are easily editable and available for immediate download.
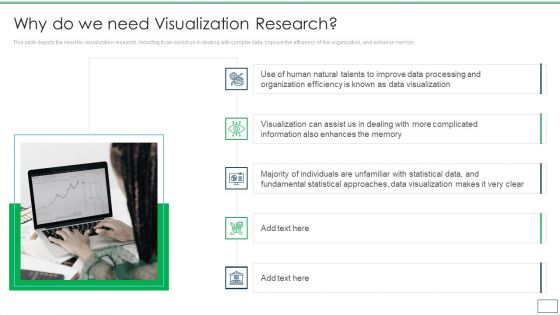
Departments Of Visualization Research Why Do We Need Visualization Research Infographics PDF
This slide depicts the need for visualization research, including it can assist us in dealing with complex data, improve the efficiency of the organization, and enhance memory.This is a Departments Of Visualization Research Why Do We Need Visualization Research Infographics PDF template with various stages. Focus and dispense information on five stages using this creative set, that comes with editable features. It contains large content boxes to add your information on topics like Organization Efficiency, Information Also Enhances, Visualization Can Assist You can also showcase facts, figures, and other relevant content using this PPT layout. Grab it now.
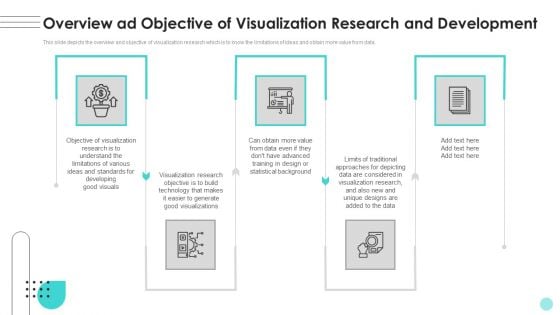
Branches For Visualization Research And Development Overview Ad Objective Of Visualization Brochure PDF
This slide depicts the overview and objective of visualization research which is to know the limitations of ideas and obtain more value from data. Are you in need of a template that can accommodate all of your creative concepts This one is crafted professionally and can be altered to fit any style. Use it with Google Slides or PowerPoint. Include striking photographs, symbols, depictions, and other visuals. Fill, move around, or remove text boxes as desired. Test out color palettes and font mixtures. Edit and save your work, or work with colleagues. Download Branches For Visualization Research And Development Overview Ad Objective Of Visualization Brochure PDF and observe how to make your presentation outstanding. Give an impeccable presentation to your group and make your presentation unforgettable.
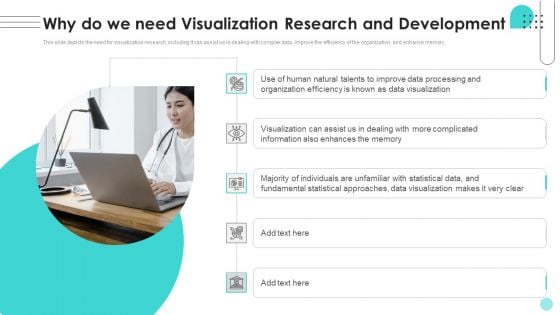
Branches For Visualization Research And Development Why Do We Need Visualization Formats PDF
This slide depicts the need for visualization research, including it can assist us in dealing with complex data, improve the efficiency of the organization, and enhance memory. Welcome to our selection of the Branches For Visualization Research And Development Why Do We Need Visualization Formats PDF. These are designed to help you showcase your creativity and bring your sphere to life. Planning and Innovation are essential for any business that is just starting out. This collection contains the designs that you need for your everyday presentations. All of our PowerPoints are 100 percent editable, so you can customize them to suit your needs. This multi-purpose template can be used in various situations. Grab these presentation templates today.

Roadmap For Visualization Research Implementation In Company Background PDF
This slide explains the roadmap for implementing visualization research in the company, including understanding and collecting the data, categorizing it, analyzing and visualizing the data. This Roadmap For Visualization Research Implementation In Company Background PDF is perfect for any presentation, be it in front of clients or colleagues. It is a versatile and stylish solution for organizing your meetings. The product features a modern design for your presentation meetings. The adjustable and customizable slides provide unlimited possibilities for acing up your presentation. Slidegeeks has done all the homework before launching the product for you. So, do not wait, grab the presentation templates today.
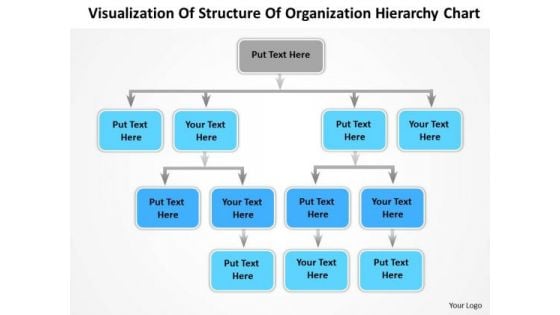
Timeline Visualization Of Structure Of Organization Hierarchy Chart
Timeline crunches are a fact of life. Meet all deadlines using our Timeline Visualization Of Structure Of Organization Hierarchy Chart. Connect the dots using our Timeline Visualization Of Structure Of Organization Hierarchy Chart. Fan expectations as the whole picture emerges.
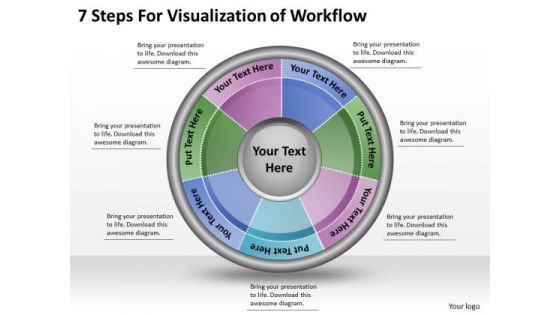
Timeline Ppt Template 7 Steps For Visualization Of Workflow
Get The Domestics Right With Our Timeline Ppt Template 7 Steps For Visualization Of Workflow Powerpoint Templates. Create The Base For Thoughts To Grow.
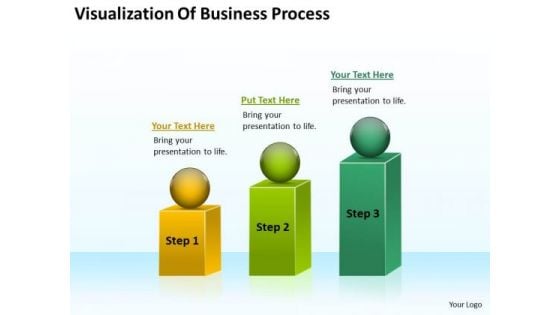
Visualization Of Business Process Ppt Plan PowerPoint Templates
We present our visualization of business process ppt plan PowerPoint templates.Present our Process and Flows PowerPoint Templates because Our PowerPoint Templates and Slides will Embellish your thoughts. They will help you illustrate the brilliance of your ideas. Download and present our Spheres PowerPoint Templates because It will Raise the bar of your Thoughts. They are programmed to take you to the next level. Use our Flow Charts PowerPoint Templates because Our PowerPoint Templates and Slides are conceived by a dedicated team. Use them and give form to your wondrous ideas. Use our Shapes PowerPoint Templates because Our PowerPoint Templates and Slides has conjured up a web of all you need with the help of our great team. Use them to string together your glistening ideas. Download and present our Marketing PowerPoint Templates because Our PowerPoint Templates and Slides will let you Leave a lasting impression to your audiences. They possess an inherent longstanding recall factor.Use these PowerPoint slides for presentations relating to Diagram, chart, market, statistics, square, grow, infograph, bar, corporate, business, vector, success, presentation, growing, circle, finance,analyst, goal, report, marketing, different, accounting, management, graph, illustration, geometric, sphere, design, growth, infographic, progress, profit,information, increase, aim, analyze, financial, rising, measure, block. The prominent colors used in the PowerPoint template are Green, Green lime, Yellow. Make an exhibition characteristic of you. Display your effectiveness on our Visualization Of Business Process Ppt Plan PowerPoint Templates.
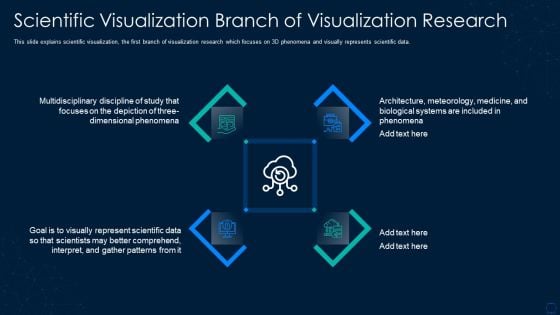
Graphical Representation Of Research IT Scientific Visualization Branch Information PDF
This slide explains scientific visualization, the first branch of visualization research which focuses on 3D phenomena and visually represents scientific data. This is a graphical representation of research it scientific visualization branch information pdf template with various stages. Focus and dispense information on four stages using this creative set, that comes with editable features. It contains large content boxes to add your information on topics like scientific visualization branch of visualization research. You can also showcase facts, figures, and other relevant content using this PPT layout. Grab it now.

Importance Of Visualization Research In Business Portrait PDF
This slide represents the importance of visualization research, including analyzing data more effectively, faster decision making, and understanding complex information. Coming up with a presentation necessitates that the majority of the effort goes into the content and the message you intend to convey. The visuals of a PowerPoint presentation can only be effective if it supplements and supports the story that is being told. Keeping this in mind our experts created Importance Of Visualization Research In Business Portrait PDF to reduce the time that goes into designing the presentation. This way, you can concentrate on the message while our designers take care of providing you with the right template for the situation.
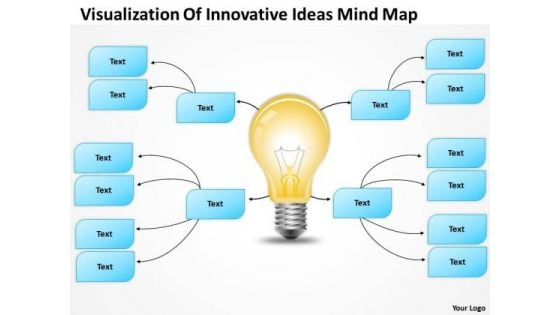
PowerPoint Org Chart Visualization Of Innovative Ideas Mind Map Templates
We present our powerpoint org chart visualization of innovative ideas mind map templates.Use our Technology PowerPoint Templates because These PowerPoint Templates and Slides will give the updraft to your ideas. See them soar to great heights with ease. Download our Marketing PowerPoint Templates because Our PowerPoint Templates and Slides are a sure bet. Gauranteed to win against all odds. Use our Arrows PowerPoint Templates because Our PowerPoint Templates and Slides will effectively help you save your valuable time. They are readymade to fit into any presentation structure. Use our Light Bulbs PowerPoint Templates because Our PowerPoint Templates and Slides are effectively colour coded to prioritise your plans They automatically highlight the sequence of events you desire. Present our Business PowerPoint Templates because Our PowerPoint Templates and Slides will definately Enhance the stature of your presentation. Adorn the beauty of your thoughts with their colourful backgrounds.Use these PowerPoint slides for presentations relating to Chart, flow, organization, flowchart, diagram, sitemap, process, box, arrow, graph, business, graphical, data, design, important, rectangle, corporate, plan, president, concept, hierarchy, glossy, teamwork, tier, chain, supervisor, relation, steps, glassy, connection, ladder, administration, group, connect, organize, connectivity, site-map, office, financial, structure, officer, glass. The prominent colors used in the PowerPoint template are Yellow, Gray, White. Maintain the continuity of your thoughts. Our PowerPoint Org Chart Visualization Of Innovative Ideas Mind Map Templates will be the fillers.
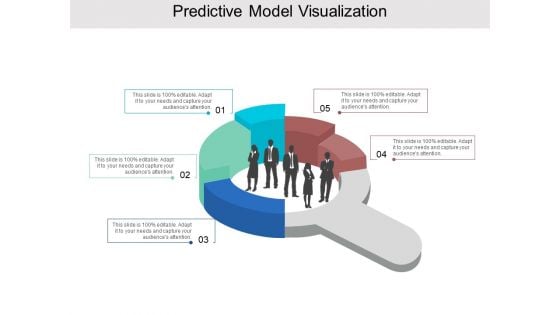
Predictive Model Visualization Ppt PowerPoint Presentation Pictures Graphics Example
This is a predictive model visualization ppt powerpoint presentation pictures graphics example. This is a five stage process. The stages in this process are predictive model, predictive framework, predictive structure.
Spatial Visualization In Powerpoint And Google Slides Cpb
Presenting our innovatively designed set of slides titled Spatial Visualization In Powerpoint And Google Slides Cpb. This completely editable PowerPoint graphic exhibits Spatial Visualization that will help you convey the message impactfully. It can be accessed with Google Slides and is available in both standard screen and widescreen aspect ratios. Apart from this, you can download this well structured PowerPoint template design in different formats like PDF, JPG, and PNG. So, click the download button now to gain full access to this PPT design. Our Spatial Visualization In Powerpoint And Google Slides Cpb are topically designed to provide an attractive backdrop to any subject. Use them to look like a presentation pro.
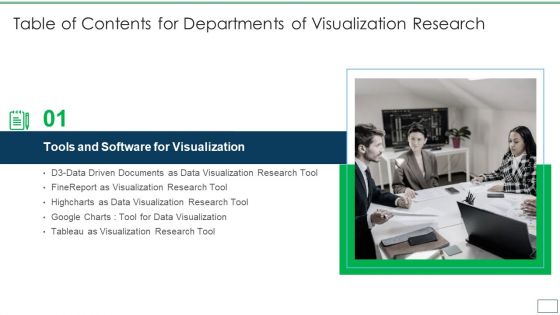
Table Of Contents For Departments Of Visualization Research Information PDF
Presenting Table Of Contents For Departments Of Visualization Research Information PDF to provide visual cues and insights. Share and navigate important information on one stage that need your due attention. This template can be used to pitch topics like Tools And Software, Visualization , Tableau As Visualization In addtion, this PPT design contains high resolution images, graphics, etc, that are easily editable and available for immediate download.

Table Of Contents Departments Of Visualization Research Sample PDF
This is a Table Of Contents Departments Of Visualization Research Sample PDF template with various stages. Focus and dispense information on six stages using this creative set, that comes with editable features. It contains large content boxes to add your information on topics like Current Scenario Of The Company, Need For Visualization, About Visualization Research You can also showcase facts, figures, and other relevant content using this PPT layout. Grab it now.
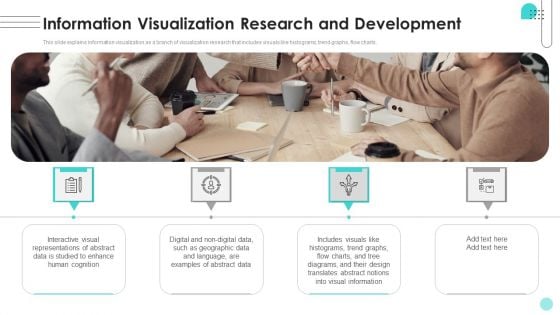
Information Visualization Research And Development Ppt Infographics Gallery PDF
This slide explains information visualization as a branch of visualization research that includes visuals like histograms, trend graphs, flow charts. Here you can discover an assortment of the finest PowerPoint and Google Slides templates. With these templates, you can create presentations for a variety of purposes while simultaneously providing your audience with an eye-catching visual experience. Download Information Visualization Research And Development Ppt Infographics Gallery PDF to deliver an impeccable presentation. These templates will make your job of preparing presentations much quicker, yet still, maintain a high level of quality. Slidegeeks has experienced researchers who prepare these templates and write high-quality content for you. Later on, you can personalize the content by editing the Information Visualization Research And Development Ppt Infographics Gallery PDF.

Agenda For Departments Of Visualization Research Download PDF
This is a Agenda For Departments Of Visualization Research Download PDF template with various stages. Focus and dispense information on four stages using this creative set, that comes with editable features. It contains large content boxes to add your information on topics like Agenda You can also showcase facts, figures, and other relevant content using this PPT layout. Grab it now.
Agenda For Visualization Research And Development Ppt Icon Slides PDF
Slidegeeks has constructed Agenda For Visualization Research And Development Ppt Icon Slides PDF after conducting extensive research and examination. These presentation templates are constantly being generated and modified based on user preferences and critiques from editors. Here, you will find the most attractive templates for a range of purposes while taking into account ratings and remarks from users regarding the content. This is an excellent jumping-off point to explore our content and will give new users an insight into our top-notch PowerPoint Templates.
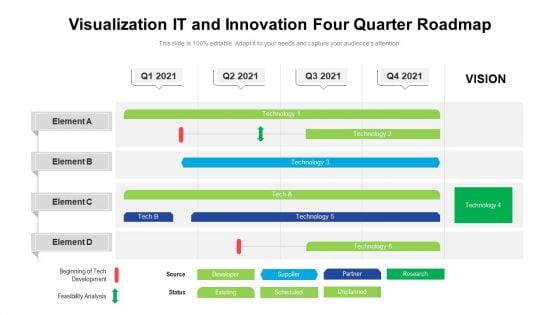
Visualization IT And Innovation Four Quarter Roadmap Microsoft
Presenting our innovatively structured visualization it and innovation four quarter roadmap microsoft Template. Showcase your roadmap process in different formats like PDF, PNG, and JPG by clicking the download button below. This PPT design is available in both Standard Screen and Widescreen aspect ratios. It can also be easily personalized and presented with modified font size, font type, color, and shapes to measure your progress in a clear way.
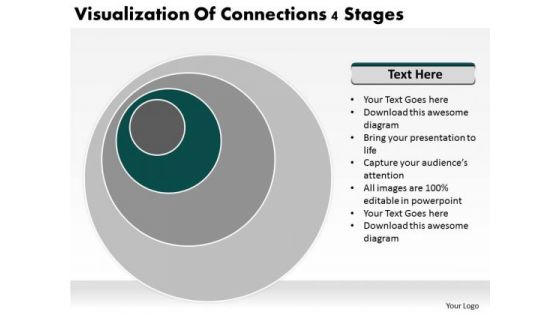
Visualization Of Connections 4 Stages Business Plan PowerPoint Slides
We present our visualization of connections 4 stages business plan PowerPoint Slides.Use our Circle Charts PowerPoint Templates because It will mark the footprints of your journey. Illustrate how they will lead you to your desired destination. Download our Process and Flows PowerPoint Templates because You should Bet on your luck with our PowerPoint Templates and Slides. Be assured that you will hit the jackpot. Use our Business PowerPoint Templates because Our PowerPoint Templates and Slides will definately Enhance the stature of your presentation. Adorn the beauty of your thoughts with their colourful backgrounds. Use our Shapes PowerPoint Templates because Our PowerPoint Templates and Slides will let you Hit the right notes. Watch your audience start singing to your tune. Present our Spheres PowerPoint Templates because You have a driving passion to excel in your field. Our PowerPoint Templates and Slides will prove ideal vehicles for your ideas.Use these PowerPoint slides for presentations relating to Background, design, circular, vector, abstract, abstraction, graphic, art, concept, style, surface, wallpaper, techno, vibrant, perspective, dimension, digital art, urban, rippling, clip art, circle, rippled, digital illustration, digital, glow, technology, idea, trend, modern, illustration, dimensional, futuristic, backdrop, high-tech, coordinate, ripple, stylish, clip-art, artistic, illuminate. The prominent colors used in the PowerPoint template are Green dark , Gray, White. Bash on ahead with bold conviction. Have no fear with our Visualization Of Connections 4 Stages Business Plan PowerPoint Slides.
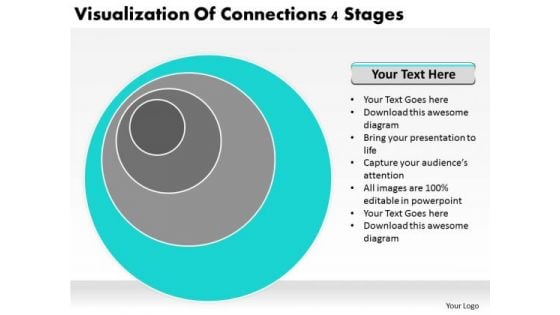
Visualization Of Connections 4 Stages Ppt Business Plan PowerPoint Templates
We present our visualization of connections 4 stages ppt business plan PowerPoint templates.Use our Circle Charts PowerPoint Templates because Our PowerPoint Templates and Slides offer you the widest possible range of options. Present our Process and Flows PowerPoint Templates because You have the co-ordinates for your destination of success. Let our PowerPoint Templates and Slides map out your journey. Download and present our Business PowerPoint Templates because Our PowerPoint Templates and Slides ensures Effective communication. They help you put across your views with precision and clarity. Present our Shapes PowerPoint Templates because Our PowerPoint Templates and Slides will let Your superior ideas hit the target always and everytime. Download our Spheres PowerPoint Templates because It will mark the footprints of your journey. Illustrate how they will lead you to your desired destination.Use these PowerPoint slides for presentations relating to Background, design, circular, vector, abstract, abstraction, graphic, art, concept, style, surface, wallpaper, techno, vibrant, perspective, dimension, digital art, urban, rippling, clip art, circle, rippled, digital illustration, digital, glow, technology, idea, trend, modern, illustration, dimensional, futuristic, backdrop, high-tech, coordinate, ripple, stylish, clip-art, artistic, illuminate. The prominent colors used in the PowerPoint template are Green lime , Gray, White. Be superman with our Visualization Of Connections 4 Stages Ppt Business Plan PowerPoint Templates. You will come out on top.
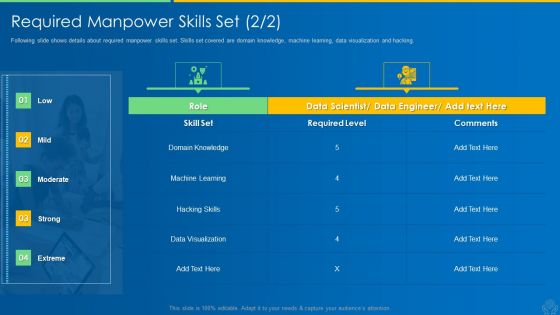
AI And ML Driving Monetary Value For Organization Required Manpower Skills Set Visualization Rules PDF
Following slide shows details about required manpower skills set. Skills set covered are domain knowledge, machine learning, data visualization and hacking. Deliver an awe inspiring pitch with this creative ai and ml driving monetary value for organization required manpower skills set visualization rules pdf bundle. Topics like domain knowledge, machine learning, machine learning, data visualization can be discussed with this completely editable template. It is available for immediate download depending on the needs and requirements of the user.

Branches For Visualization Research And Development Univariate Analysis Techniques Download PDF
This slide depicts the univariate analysis technique for data visualization, including distribution, box and whisker, and the violin plot. This Branches For Visualization Research And Development Univariate Analysis Techniques Download PDF is perfect for any presentation, be it in front of clients or colleagues. It is a versatile and stylish solution for organizing your meetings. The Branches For Visualization Research And Development Univariate Analysis Techniques Download PDF features a modern design for your presentation meetings. The adjustable and customizable slides provide unlimited possibilities for acing up your presentation. Slidegeeks has done all the homework before launching the product for you. So, dont wait, grab the presentation templates today.
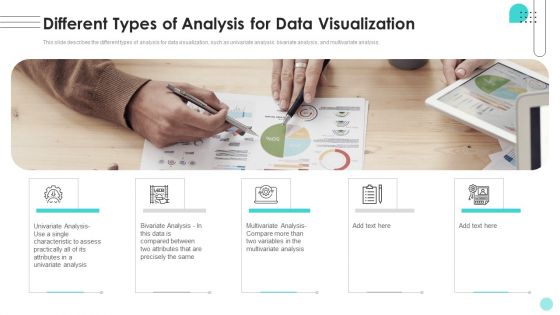
Branches For Visualization Research And Development Different Types Of Analysis Clipart PDF
This slide describes the different types of analysis for data visualization, such as univariate analysis, bivariate analysis, and multivariate analysis. Present like a pro with Branches For Visualization Research And Development Different Types Of Analysis Clipart PDF Create beautiful presentations together with your team, using our easy-to-use presentation slides. Share your ideas in real-time and make changes on the fly by downloading our templates. So whether youre in the office, on the go, or in a remote location, you can stay in sync with your team and present your ideas with confidence. With Slidegeeks presentation got a whole lot easier. Grab these presentations today.
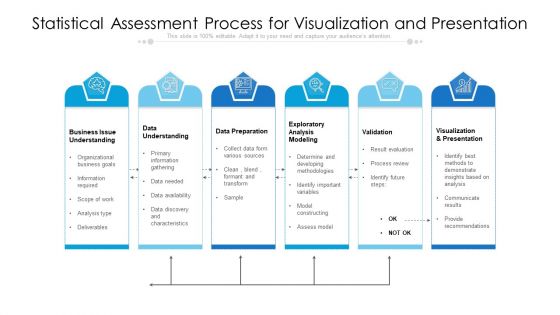
Statistical Assessment Process For Visualization And Presentation Ppt Styles Graphics Example PDF
Showcasing this set of slides titled statistical assessment process for visualization and presentation ppt styles graphics example pdf. The topics addressed in these templates are data understanding, data preparation, validation, visualization, presentation. All the content presented in this PPT design is completely editable. Download it and make adjustments in color, background, font etc. as per your unique business setting.
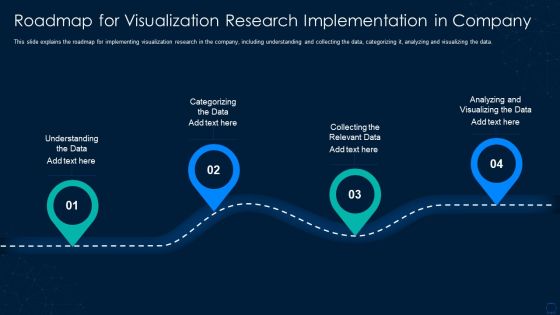
Graphical Representation Of Research IT Roadmap For Visualization Research Summary PDF
This slide explains the roadmap for implementing visualization research in the company, including understanding and collecting the data, categorizing it, analyzing and visualizing the data. Presenting graphical representation of research it roadmap for visualization research summary pdf to provide visual cues and insights. Share and navigate important information on four stages that need your due attention. This template can be used to pitch topics like roadmap for visualization research implementation in company. In addtion, this PPT design contains high resolution images, graphics, etc, that are easily editable and available for immediate download.
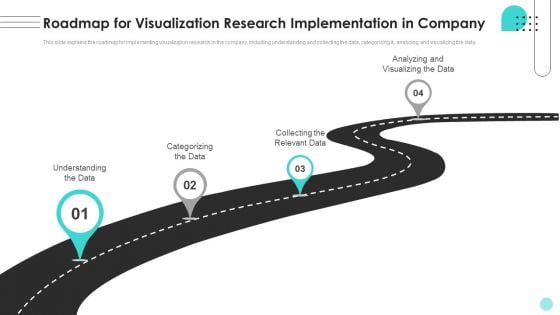
Roadmap For Visualization Research Implementation In Company Ppt Inspiration Summary PDF
This slide explains the roadmap for implementing visualization research in the company, including understanding and collecting the data, categorizing it, analyzing and visualizing the data. This Roadmap For Visualization Research Implementation In Company Ppt Inspiration Summary PDF from Slidegeeks makes it easy to present information on your topic with precision. It provides customization options, so you can make changes to the colors, design, graphics, or any other component to create a unique layout. It is also available for immediate download, so you can begin using it right away. Slidegeeks has done good research to ensure that you have everything you need to make your presentation stand out. Make a name out there for a brilliant performance.
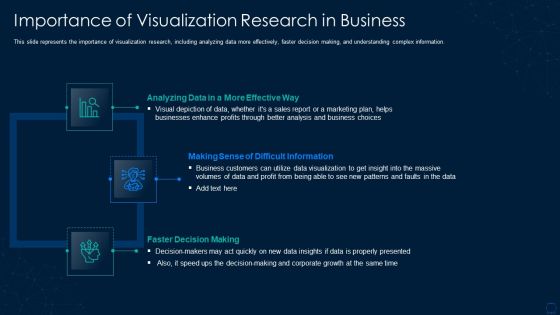
Graphical Representation Of Research IT Importance Of Visualization Research In Business Summary PDF
This slide represents the importance of visualization research, including analyzing data more effectively, faster decision making, and understanding complex information. This is a graphical representation of research it importance of visualization research in business summary pdf template with various stages. Focus and dispense information on three stages using this creative set, that comes with editable features. It contains large content boxes to add your information on topics like business customers, marketing plan, growth, data. You can also showcase facts, figures, and other relevant content using this PPT layout. Grab it now.
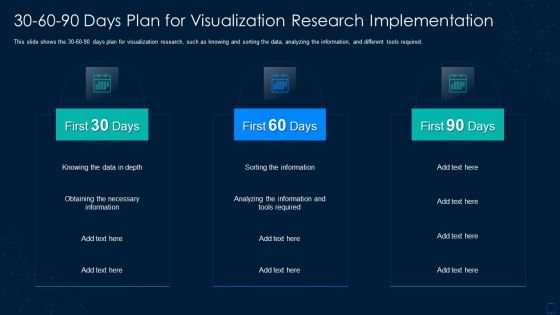
Graphical Representation Of Research IT 30 60 90 Days Plan For Visualization Diagrams PDF
This slide shows the 30 60 90 days plan for visualization research, such as knowing and sorting the data, analyzing the information, and different tools required. This is a graphical representation of research it 30 60 90 days plan for visualization diagrams pdf template with various stages. Focus and dispense information on three stages using this creative set, that comes with editable features. It contains large content boxes to add your information on topics like information, required, analyzing. You can also showcase facts, figures, and other relevant content using this PPT layout. Grab it now.
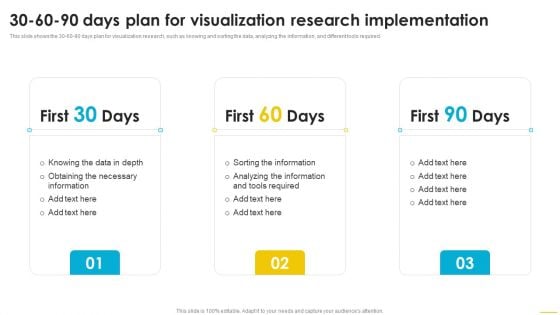
30 60 90 Days Plan For Visualization Research Implementation Themes PDF
This slide shows the 30 60 90 days plan for visualization research, such as knowing and sorting the data, analyzing the information, and different tools required. If you are looking for a format to display your unique thoughts, then the professionally designed 30 60 90 Days Plan For Visualization Research Implementation Themes PDF is the one for you. You can use it as a Google Slides template or a PowerPoint template. Incorporate impressive visuals, symbols, images, and other charts. Modify or reorganize the text boxes as you desire. Experiment with shade schemes and font pairings. Alter, share or cooperate with other people on your work. Download 30 60 90 Days Plan For Visualization Research Implementation Themes PDF and find out how to give a successful presentation. Present a perfect display to your team and make your presentation unforgettable.
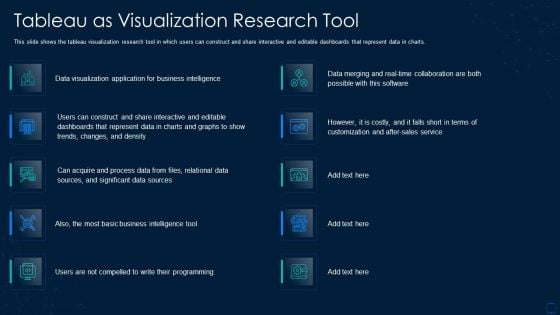
Graphical Representation Of Research IT Tableau As Visualization Research Tool Graphics PDF
This slide shows the tableau visualization research tool in which users can construct and share interactive and editable dashboards that represent data in charts. Deliver and pitch your topic in the best possible manner with this graphical representation of research it tableau as visualization research tool graphics pdf. Use them to share invaluable insights on process data, sources, sales, application and impress your audience. This template can be altered and modified as per your expectations. So, grab it now.
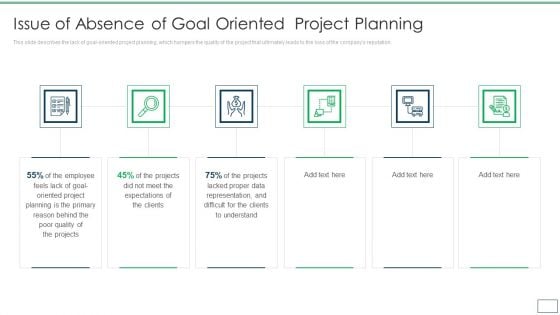
Departments Of Visualization Research Issue Of Absence Of Goal Oriented Project Planning Designs PDF
This slide describes the lack of goal oriented project planning, which hampers the quality of the project that ultimately leads to the loss of the companys reputation. This is a Departments Of Visualization Research Issue Of Absence Of Goal Oriented Project Planning Designs PDF template with various stages. Focus and dispense information on six stages using this creative set, that comes with editable features. It contains large content boxes to add your information on topics like Planning Is The Primary, Representation And Difficult, Lacked Proper Data You can also showcase facts, figures, and other relevant content using this PPT layout. Grab it now.
Graphical Representation Of Research IT Information Visualization Research Branch Icons PDF
This slide explains information visualization as a branch of visualization research that includes visuals like histograms, trend graphs, flow charts. Presenting graphical representation of research it information visualization research branch icons pdf to provide visual cues and insights. Share and navigate important information on four stages that need your due attention. This template can be used to pitch topics like geographic, information, design. In addtion, this PPT design contains high resolution images, graphics, etc, that are easily editable and available for immediate download.
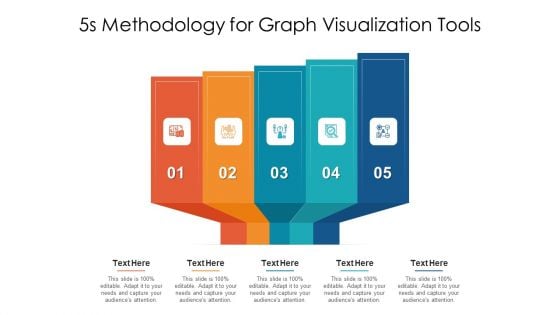
5S Methodology Slide For Graph Visualization Tools Ppt PowerPoint Presentation Summary Graphics Template PDF
Presenting 5s methodology slide for graph visualization tools ppt powerpoint presentation summary graphics template pdf to dispense important information. This template comprises five stages. It also presents valuable insights into the topics including 5s methodology for graph visualization tools. This is a completely customizable PowerPoint theme that can be put to use immediately. So, download it and address the topic impactfully.
Visualization Of Merged Real And Virtual Environment Technology Icon Inspiration PDF
Showcasing this set of slides titled Visualization Of Merged Real And Virtual Environment Technology Icon Inspiration PDF. The topics addressed in these templates are Visualization Merged Real, Virtual Environment, Technology Icon. All the content presented in this PPT design is completely editable. Download it and make adjustments in color, background, font etc. as per your unique business setting.
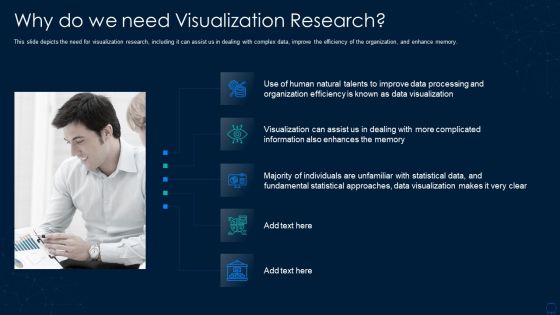
Graphical Representation Of Research IT Why Do We Need Visualization Research Graphics PDF
This is a graphical representation of research it why do we need visualization research graphics pdf template with various stages. Focus and dispense information on five stages using this creative set, that comes with editable features. It contains large content boxes to add your information on topics like why do we need visualization research. You can also showcase facts, figures, and other relevant content using this PPT layout. Grab it now.

 Home
Home