Data Visualization
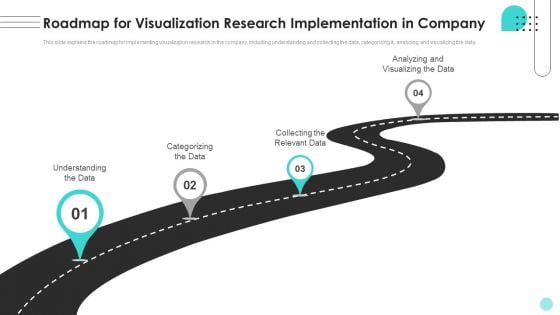
Roadmap For Visualization Research Implementation In Company Ppt Inspiration Summary PDF
This slide explains the roadmap for implementing visualization research in the company, including understanding and collecting the data, categorizing it, analyzing and visualizing the data. This Roadmap For Visualization Research Implementation In Company Ppt Inspiration Summary PDF from Slidegeeks makes it easy to present information on your topic with precision. It provides customization options, so you can make changes to the colors, design, graphics, or any other component to create a unique layout. It is also available for immediate download, so you can begin using it right away. Slidegeeks has done good research to ensure that you have everything you need to make your presentation stand out. Make a name out there for a brilliant performance.
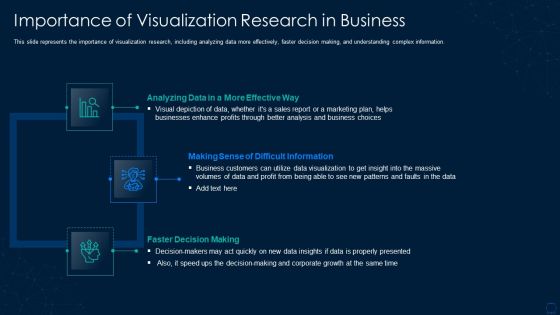
Graphical Representation Of Research IT Importance Of Visualization Research In Business Summary PDF
This slide represents the importance of visualization research, including analyzing data more effectively, faster decision making, and understanding complex information. This is a graphical representation of research it importance of visualization research in business summary pdf template with various stages. Focus and dispense information on three stages using this creative set, that comes with editable features. It contains large content boxes to add your information on topics like business customers, marketing plan, growth, data. You can also showcase facts, figures, and other relevant content using this PPT layout. Grab it now.
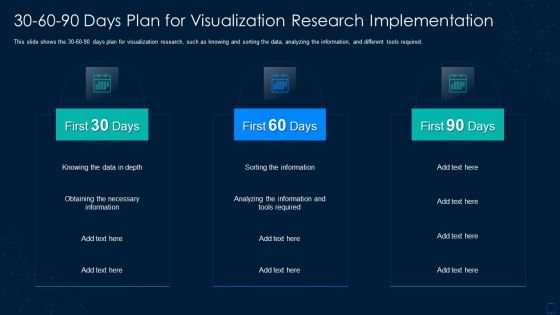
Graphical Representation Of Research IT 30 60 90 Days Plan For Visualization Diagrams PDF
This slide shows the 30 60 90 days plan for visualization research, such as knowing and sorting the data, analyzing the information, and different tools required. This is a graphical representation of research it 30 60 90 days plan for visualization diagrams pdf template with various stages. Focus and dispense information on three stages using this creative set, that comes with editable features. It contains large content boxes to add your information on topics like information, required, analyzing. You can also showcase facts, figures, and other relevant content using this PPT layout. Grab it now.
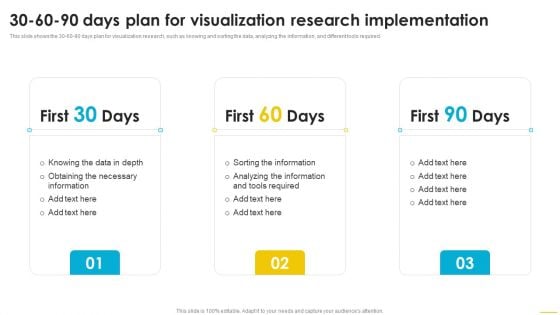
30 60 90 Days Plan For Visualization Research Implementation Themes PDF
This slide shows the 30 60 90 days plan for visualization research, such as knowing and sorting the data, analyzing the information, and different tools required. If you are looking for a format to display your unique thoughts, then the professionally designed 30 60 90 Days Plan For Visualization Research Implementation Themes PDF is the one for you. You can use it as a Google Slides template or a PowerPoint template. Incorporate impressive visuals, symbols, images, and other charts. Modify or reorganize the text boxes as you desire. Experiment with shade schemes and font pairings. Alter, share or cooperate with other people on your work. Download 30 60 90 Days Plan For Visualization Research Implementation Themes PDF and find out how to give a successful presentation. Present a perfect display to your team and make your presentation unforgettable.
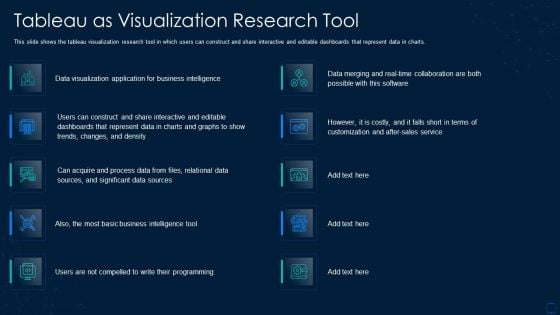
Graphical Representation Of Research IT Tableau As Visualization Research Tool Graphics PDF
This slide shows the tableau visualization research tool in which users can construct and share interactive and editable dashboards that represent data in charts. Deliver and pitch your topic in the best possible manner with this graphical representation of research it tableau as visualization research tool graphics pdf. Use them to share invaluable insights on process data, sources, sales, application and impress your audience. This template can be altered and modified as per your expectations. So, grab it now.
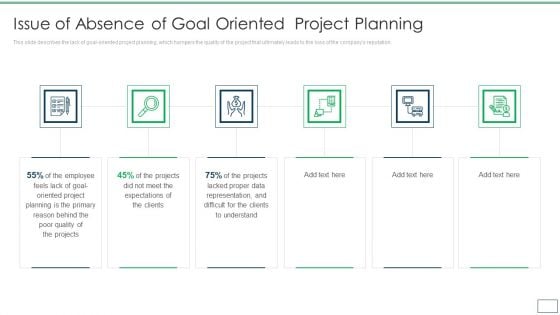
Departments Of Visualization Research Issue Of Absence Of Goal Oriented Project Planning Designs PDF
This slide describes the lack of goal oriented project planning, which hampers the quality of the project that ultimately leads to the loss of the companys reputation. This is a Departments Of Visualization Research Issue Of Absence Of Goal Oriented Project Planning Designs PDF template with various stages. Focus and dispense information on six stages using this creative set, that comes with editable features. It contains large content boxes to add your information on topics like Planning Is The Primary, Representation And Difficult, Lacked Proper Data You can also showcase facts, figures, and other relevant content using this PPT layout. Grab it now.
Graphical Representation Of Research IT Information Visualization Research Branch Icons PDF
This slide explains information visualization as a branch of visualization research that includes visuals like histograms, trend graphs, flow charts. Presenting graphical representation of research it information visualization research branch icons pdf to provide visual cues and insights. Share and navigate important information on four stages that need your due attention. This template can be used to pitch topics like geographic, information, design. In addtion, this PPT design contains high resolution images, graphics, etc, that are easily editable and available for immediate download.
5S Methodology Slide For Graph Visualization Tools Ppt PowerPoint Presentation Summary Graphics Template PDF
Presenting 5s methodology slide for graph visualization tools ppt powerpoint presentation summary graphics template pdf to dispense important information. This template comprises five stages. It also presents valuable insights into the topics including 5s methodology for graph visualization tools. This is a completely customizable PowerPoint theme that can be put to use immediately. So, download it and address the topic impactfully.
Visualization Of Merged Real And Virtual Environment Technology Icon Inspiration PDF
Showcasing this set of slides titled Visualization Of Merged Real And Virtual Environment Technology Icon Inspiration PDF. The topics addressed in these templates are Visualization Merged Real, Virtual Environment, Technology Icon. All the content presented in this PPT design is completely editable. Download it and make adjustments in color, background, font etc. as per your unique business setting.
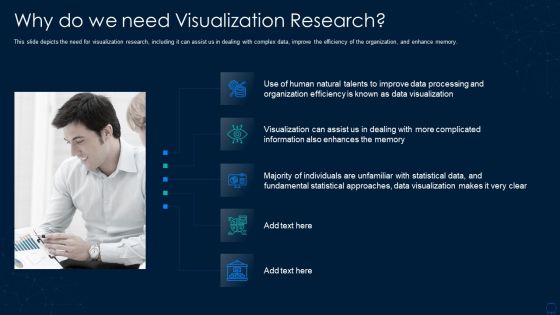
Graphical Representation Of Research IT Why Do We Need Visualization Research Graphics PDF
This is a graphical representation of research it why do we need visualization research graphics pdf template with various stages. Focus and dispense information on five stages using this creative set, that comes with editable features. It contains large content boxes to add your information on topics like why do we need visualization research. You can also showcase facts, figures, and other relevant content using this PPT layout. Grab it now.
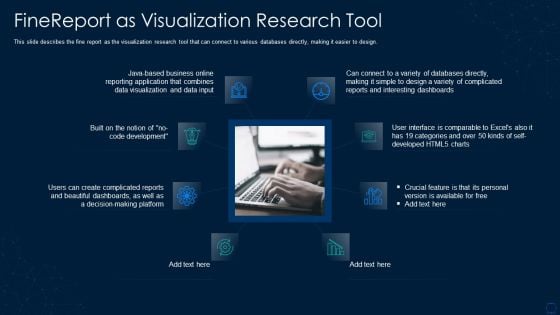
Graphical Representation Of Research IT Finereport As Visualization Research Tool Structure PDF
This slide describes the fine report as the visualization research tool that can connect to various databases directly, making it easier to design. Presenting graphical representation of research it finereport as visualization research tool structure pdf to provide visual cues and insights. Share and navigate important information on eight stages that need your due attention. This template can be used to pitch topics like application, dashboards, databases. In addtion, this PPT design contains high resolution images, graphics, etc, that are easily editable and available for immediate download.
Visualization Of Human Brain PowerPoint Templates Ppt Backgrounds For Slides 0513
However dry your topic maybe. Make it catchy with our Visualization Of Human Brain PowerPoint Templates PPT Backgrounds For Slides 0513. Drum up a beat with our Mindmaps PowerPoint Templates. You will have their minds keeping time. Our Health PowerPoint Templates are dual purpose. They help instruct and inform at the same time. Arm your team with our Visualization Of Human Brain PowerPoint Templates Ppt Backgrounds For Slides 0513. You will come out on top.

Visualization Of Seo Concept PowerPoint Templates Ppt Backgrounds For Slides 0713
However dry your topic maybe. Make it catchy with our Visualization Of SEO Concept PowerPoint Templates PPT Backgrounds For Slides. Drum up a beat with our People PowerPoint Templates. You will have their minds keeping time. Our Business PowerPoint Templates are dual purpose. They help instruct and inform at the same time. Index your ascent with our Visualization Of Seo Concept PowerPoint Templates Ppt Backgrounds For Slides 0713. Illustrate every step of the way.
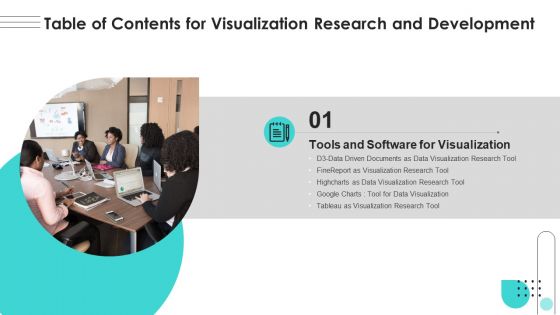
Table Of Contents For Visualization Research And Development Ppt Model Influencers PDF
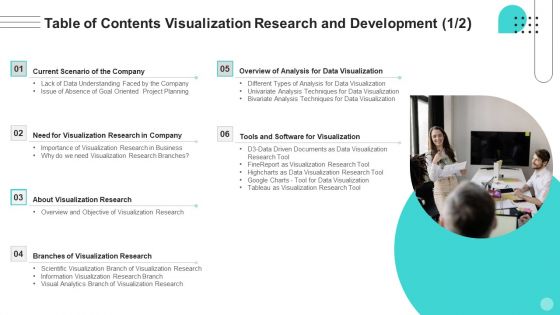
Table Of Contents Visualization Research And Development Ppt Infographic Template Rules PDF
Do you know about Slidesgeeks Table Of Contents Visualization Research And Development Ppt Infographic Template Rules PDFThese are perfect for delivering any kind od presentation. Using it, create PowerPoint presentations that communicate your ideas and engage audiences. Save time and effort by using our pre-designed presentation templates that are perfect for a wide range of topic. Our vast selection of designs covers a range of styles, from creative to business, and are all highly customizable and easy to edit. Download as a PowerPoint template or use them as Google Slides themes.
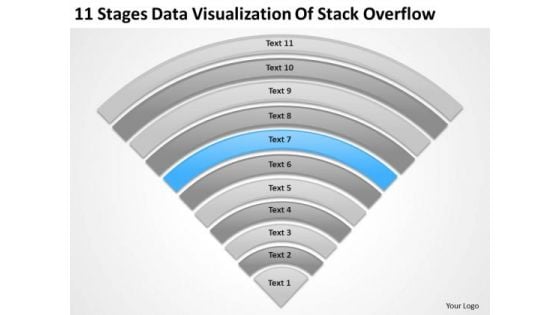
Visualization Of Stack Overflow Executive Summary Example Business Plan PowerPoint Slides
We present our visualization of stack overflow executive summary example business plan PowerPoint Slides.Present our Advertising PowerPoint Templates because You can Be the puppeteer with our PowerPoint Templates and Slides as your strings. Lead your team through the steps of your script. Use our Competition PowerPoint Templates because It can Bubble and burst with your ideas. Present our Business PowerPoint Templates because Your success is our commitment. Our PowerPoint Templates and Slides will ensure you reach your goal. Download our Shapes PowerPoint Templates because Our PowerPoint Templates and Slides will help you be quick off the draw. Just enter your specific text and see your points hit home. Download and present our Targets PowerPoint Templates because You can Double your output with our PowerPoint Templates and Slides. They make beating deadlines a piece of cake.Use these PowerPoint slides for presentations relating to Legal, pressure, heap, documents, file, messy, copy, bureaucracy, order, business, problems, chaos, stack, pile, occupation, finance, data, cardboard, supply, report, vertical, folders, tall, paperwork, stacking, up, overflowing, high, excess, group, objects, paper, over-sized, organization, archive, working, angle, space, drudgery, organized, office, large, ideas, 3d. The prominent colors used in the PowerPoint template are Blue, Gray, White. Serve presentations with our Visualization Of Stack Overflow Executive Summary Example Business Plan PowerPoint Slides. Download without worries with our money back guaranteee.
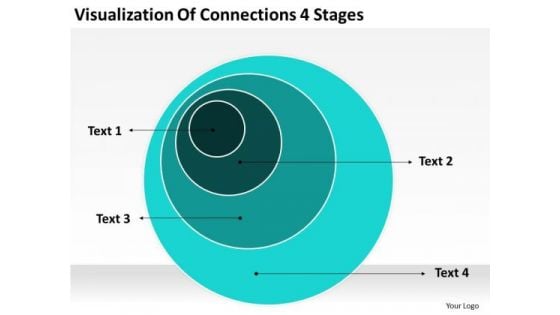
Visualization Of Connections 4 Stages Growthink Business Plan Template PowerPoint Templates
We present our visualization of connections 4 stages growthink business plan template PowerPoint templates.Download our Process and Flows PowerPoint Templates because Our PowerPoint Templates and Slides have the Brilliant backdrops. Guaranteed to illuminate the minds of your audience. Use our Business PowerPoint Templates because They will Put your wonderful verbal artistry on display. Our PowerPoint Templates and Slides will provide you the necessary glam and glitter. Download our Marketing PowerPoint Templates because You aspire to touch the sky with glory. Let our PowerPoint Templates and Slides provide the fuel for your ascent. Download our Circle Charts PowerPoint Templates because It can Conjure up grand ideas with our magical PowerPoint Templates and Slides. Leave everyone awestruck by the end of your presentation. Use our Shapes PowerPoint Templates because Our PowerPoint Templates and Slides have the Brilliant backdrops. Guaranteed to illuminate the minds of your audience.Use these PowerPoint slides for presentations relating to Blue, abstract, spiral, background, light, design, motion, shape, vector, round, line, graphic, business, modern, effect, pattern, blank, flowing, wallpaper, decoration, concept, technology, illustration, shiny, color, style, space, image, simplicity, textured. The prominent colors used in the PowerPoint template are Green, Blue light, White. Attempt great targets with our Visualization Of Connections 4 Stages Growthink Business Plan Template PowerPoint Templates. You will come out on top.
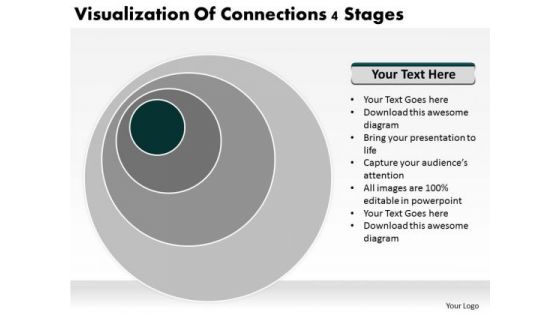
Visualization Of Connections 4 Stages Ppt Business Plan For PowerPoint Slides
We present our visualization of connections 4 stages ppt business plan for PowerPoint Slides.Present our Circle Charts PowerPoint Templates because You can Be the star of the show with our PowerPoint Templates and Slides. Rock the stage with your ideas. Use our Process and Flows PowerPoint Templates because You can Inspire your team with our PowerPoint Templates and Slides. Let the force of your ideas flow into their minds. Use our Business PowerPoint Templates because Our PowerPoint Templates and Slides will fulfill your every need. Use them and effectively satisfy the desires of your audience. Download and present our Shapes PowerPoint Templates because Our PowerPoint Templates and Slides are effectively colour coded to prioritise your plans They automatically highlight the sequence of events you desire. Download our Spheres PowerPoint Templates because Our PowerPoint Templates and Slides offer you the needful to organise your thoughts. Use them to list out your views in a logical sequence.Use these PowerPoint slides for presentations relating to Background, design, circular, vector, abstract, abstraction, graphic, art, concept, style, surface, wallpaper, techno, vibrant, perspective, dimension, digital art, urban, rippling, clip art, circle, rippled, digital illustration, digital, glow, technology, idea, trend, modern, illustration, dimensional, futuristic, backdrop, high-tech, coordinate, ripple, stylish, clip-art, artistic, illuminate. The prominent colors used in the PowerPoint template are Green dark , Gray, White. Examine the facts in all their combinations. Run the comb through with our Visualization Of Connections 4 Stages Ppt Business Plan For PowerPoint Slides.
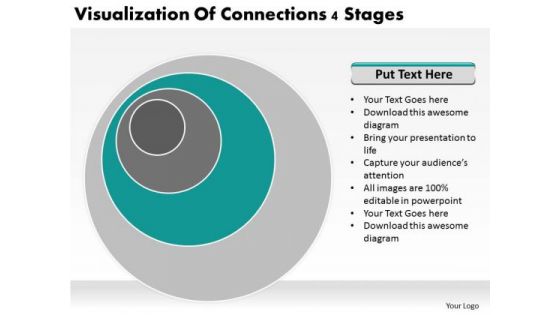
Visualization Of Connections 4 Stages Ppt It Business Plan PowerPoint Templates
We present our visualization of connections 4 stages ppt it business plan PowerPoint templates.Download our Circle Charts PowerPoint Templates because You are well armed with penetrative ideas. Our PowerPoint Templates and Slides will provide the gunpowder you need. Download our Process and Flows PowerPoint Templates because Our PowerPoint Templates and Slides are like the strings of a tennis racquet. Well strung to help you serve aces. Download and present our Business PowerPoint Templates because Our PowerPoint Templates and Slides will weave a web of your great ideas. They are gauranteed to attract even the most critical of your colleagues. Download and present our Shapes PowerPoint Templates because You can Inspire your team with our PowerPoint Templates and Slides. Let the force of your ideas flow into their minds. Present our Spheres PowerPoint Templates because Our PowerPoint Templates and Slides will bullet point your ideas. See them fall into place one by one.Use these PowerPoint slides for presentations relating to Background, design, circular, vector, abstract, abstraction, graphic, art, concept, style, surface, wallpaper, techno, vibrant, perspective, dimension, digital art, urban, rippling, clip art, circle, rippled, digital illustration, digital, glow, technology, idea, trend, modern, illustration, dimensional, futuristic, backdrop, high-tech, coordinate, ripple, stylish, clip-art, artistic, illuminate. The prominent colors used in the PowerPoint template are Green, Gray, White. Our Visualization Of Connections 4 Stages Ppt It Business Plan PowerPoint Templates combine to create an exciting ensemble. Each one has a distinct character.
Visual Analytics Vector Icon Ppt PowerPoint Presentation Visual Aids Show
Presenting this set of slides with name visual analytics vector icon ppt powerpoint presentation visual aids show. This is a three stage process. The stages in this process are data visualization icon, research analysis, business focus. This is a completely editable PowerPoint presentation and is available for immediate download. Download now and impress your audience.
Visual Analytics Vector Icon Ppt Powerpoint Presentation Infographics Show
This is a visual analytics vector icon ppt powerpoint presentation infographics show. This is a three stage process. The stages in this process are data visualization icon, data management icon.
Statistics Dashboard Vector Icon Ppt PowerPoint Presentation Pictures Visual Aids
Presenting this set of slides with name statistics dashboard vector icon ppt powerpoint presentation pictures visual aids. This is a one stage process. The stages in this process are data visualization icon, research analysis, business focus. This is a completely editable PowerPoint presentation and is available for immediate download. Download now and impress your audience.
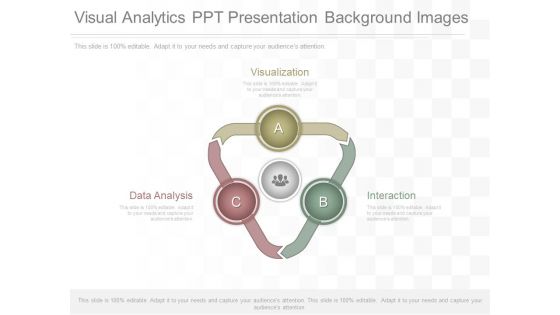
Visual Analytics Ppt Presentation Background Images
This is a visual analytics ppt presentation background images. This is a three stage process. The stages in this process are visualization, interaction, data analysis.
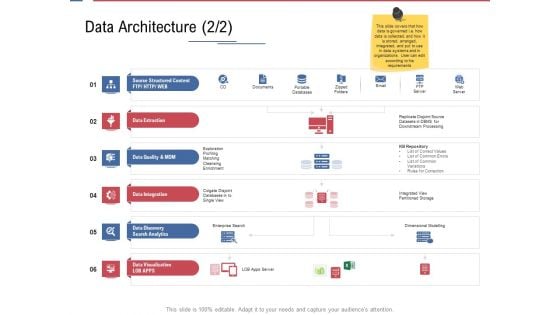
Data Assimilation Data Architecture Errors Ppt Ideas Template PDF
Presenting data assimilation data architecture errors ppt ideas template pdf to provide visual cues and insights. Share and navigate important information on six stages that need your due attention. This template can be used to pitch topics like data extraction, analytics, data visualization, data integration, data quality. In addtion, this PPT design contains high resolution images, graphics, etc, that are easily editable and available for immediate download.
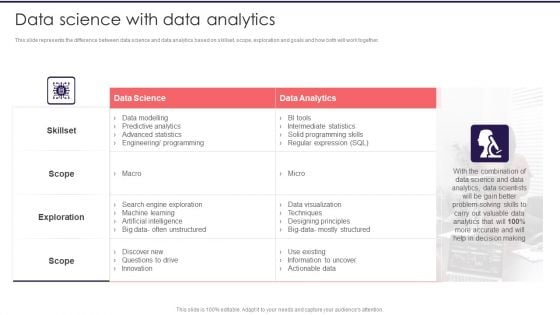
Information Studies Data Science With Data Analytics Background PDF
This slide represents the difference between data science and data analytics based on skillset, scope, exploration and goals and how both will work together. Deliver an awe inspiring pitch with this creative Information Studies Data Science With Data Analytics Background PDF bundle. Topics like Data Science, Data Analytics, Data Visualization can be discussed with this completely editable template. It is available for immediate download depending on the needs and requirements of the user.

Data Warehousing Review Ppt Presentation
This is a data warehousing review ppt presentation. This is a four stage process. The stages in this process are olttp server, meta data responsibility, pre data ware house, etl, data cleansing, data warehouse, data mart, data mart, ods, data repositories, opal, data mining, data visualization, reporting, front end analytics.
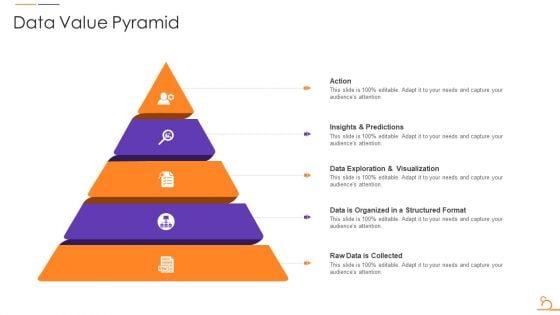
Agile Techniques For Data Migration Data Value Pyramid Template PDF
Presenting Agile Techniques For Data Migration Data Value Pyramid Template PDF to provide visual cues and insights. Share and navigate important information on five stages that need your due attention. This template can be used to pitch topics like Action, Insights And Predictions, Data Exploration Visualization, Data Organized Structured. In addtion, this PPT design contains high resolution images, graphics, etc, that are easily editable and available for immediate download.
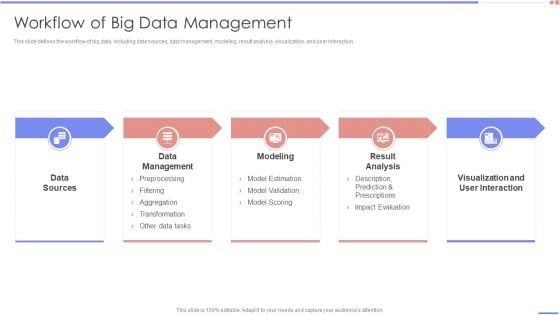
Data Analytics Management Workflow Of Big Data Management Infographics PDF
This slide defines the workflow of big data, including data sources, data management, modeling, result analysis, visualization, and user interaction.This is a Data Analytics Management Workflow Of Big Data Management Infographics PDF template with various stages. Focus and dispense information on five stages using this creative set, that comes with editable features. It contains large content boxes to add your information on topics like Data Management, Visualization Interaction, Result Analysis. You can also showcase facts, figures, and other relevant content using this PPT layout. Grab it now.
Data Analytics Vector Icon Ppt Powerpoint Presentation Icon Designs
This is a data analytics vector icon ppt powerpoint presentation icon designs. This is a four stage process. The stages in this process are data visualization icon, data management icon.

Data Governance And Data Management Pyramid Ppt Example
This is a data governance and data management pyramid ppt example. This is a five stage process. The stages in this process are data sets, analytical models, discovery, ingestion hdfs, visualize, data quality and management.
Data Folders Back Up On Server Vector Icon Ppt PowerPoint Presentation File Visual Aids PDF
Persuade your audience using this data folders back up on server vector icon ppt powerpoint presentation file visual aids pdf. This PPT design covers three stages, thus making it a great tool to use. It also caters to a variety of topics including data folders back up on server vector icon. Download this PPT design now to present a convincing pitch that not only emphasizes the topic but also showcases your presentation skills.

Data Analytics IT Tasks And Skills Of Machine Learning Engineer Ppt Gallery Visual Aids PDF
This slide represents the machine learning engineers tasks and skills, including a deep knowledge of machine learning, ML algorithms, and Python and C. This is a data analytics it tasks and skills of machine learning engineer ppt gallery visual aids pdf template with various stages. Focus and dispense information on six stages using this creative set, that comes with editable features. It contains large content boxes to add your information on topics like knowledge of machine learning, python, c plus, ml algorithms. You can also showcase facts, figures, and other relevant content using this PPT layout. Grab it now.
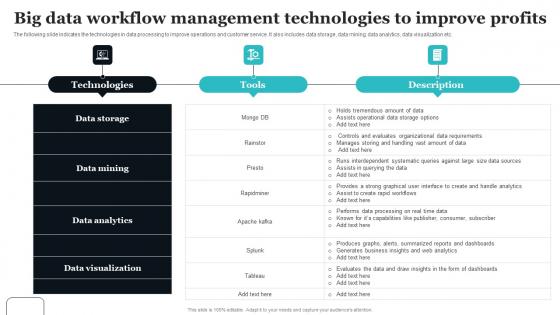
Big Data Workflow Management Technologies To Improve Profits Designs Pdf
The following slide indicates the technologies in data processing to improve operations and customer service. It also includes data storage, data mining, data analytics, data visualization etc. Pitch your topic with ease and precision using this Big Data Workflow Management Technologies To Improve Profits Designs Pdf This layout presents information on Data Storage, Data Analytics, Data Visualization It is also available for immediate download and adjustment. So, changes can be made in the color, design, graphics or any other component to create a unique layout. The following slide indicates the technologies in data processing to improve operations and customer service. It also includes data storage, data mining, data analytics, data visualization etc.
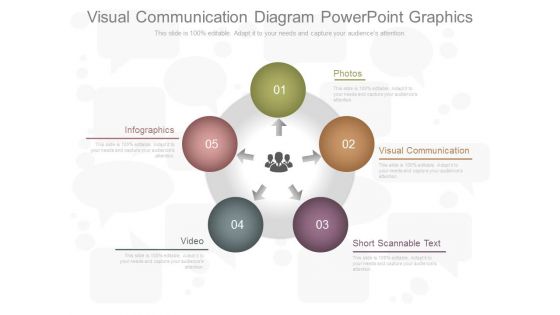
Visual Communication Diagram Powerpoint Graphics
This is a visual communication diagram powerpoint graphics. This is a five stage process. The stages in this process are photos, visual communication, short scannable text, video, infographics.

Business Diagram Business Bar Graph For Data Analysis Presentation Template
This business slide displays pie charts with percentage ratios. This diagram is a data visualization tool that gives you a simple way to present statistical information. This slide helps your audience examines and interprets the data you present.
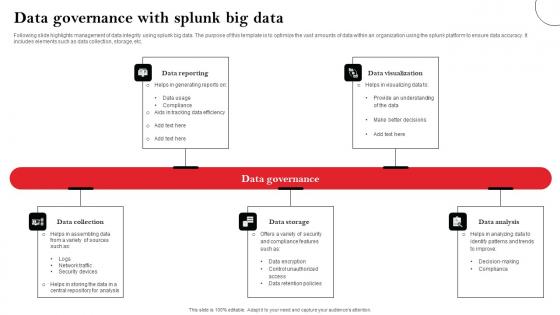
Data Governance With Splunk Big Data Designs Pdf
Following slide highlights management of data integrity using splunk big data. The purpose of this template is to optimize the vast amounts of data within an organization using the splunk platform to ensure data accuracy. It includes elements such as data collection, storage, etc. Showcasing this set of slides titled Data Governance With Splunk Big Data Designs Pdf The topics addressed in these templates are Data Reporting, Data Visualization, Data Collection All the content presented in this PPT design is completely editable. Download it and make adjustments in color, background, font etc. as per your unique business setting. Following slide highlights management of data integrity using splunk big data. The purpose of this template is to optimize the vast amounts of data within an organization using the splunk platform to ensure data accuracy. It includes elements such as data collection, storage, etc.
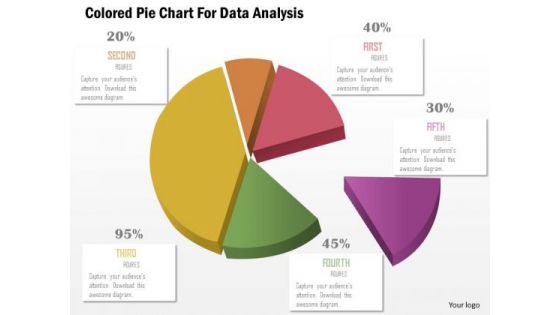
Business Diagram Colored Pie Chart For Data Analysis Presentation Template
This business slide displays pie chart. This diagram is a data visualization tool that gives you a simple way to present statistical information. This slide helps your audience examine and interpret the data you present.
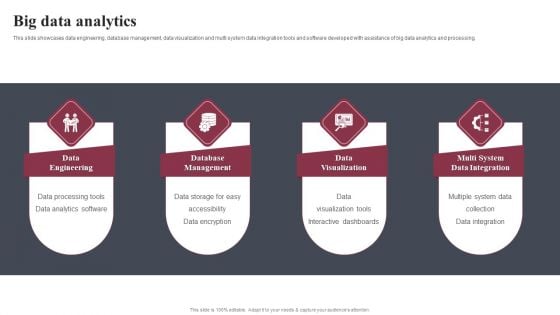
Business Software Development Company Profile Big Data Analytics Professional PDF
This slide showcases data engineering, database management, data visualization and multi system data integration tools and software developed with assistance of big data analytics and processing. Presenting Business Software Development Company Profile Big Data Analytics Professional PDF to provide visual cues and insights. Share and navigate important information on four stages that need your due attention. This template can be used to pitch topics like Data Engineering, Database Management, Data Visualization. In addtion, this PPT design contains high resolution images, graphics, etc, that are easily editable and available for immediate download.
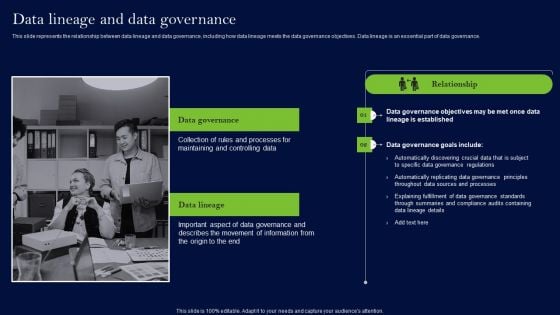
Data Lineage Methods Data Lineage And Data Governance Infographics PDF
This slide represents the relationship between data lineage and data governance, including how data lineage meets the data governance objectives. Data lineage is an essential part of data governance. The Data Lineage Methods Data Lineage And Data Governance Infographics PDF is a compilation of the most recent design trends as a series of slides. It is suitable for any subject or industry presentation, containing attractive visuals and photo spots for businesses to clearly express their messages. This template contains a variety of slides for the user to input data, such as structures to contrast two elements, bullet points, and slides for written information. Slidegeeks is prepared to create an impression.
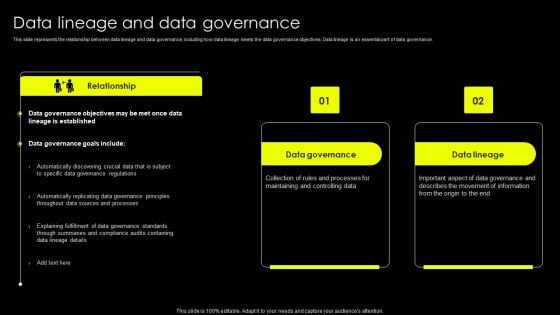
Data Lineage Implementation Data Lineage And Data Governance Elements PDF
This slide represents the relationship between data lineage and data governance, including how data lineage meets the data governance objectives. Data lineage is an essential part of data governance. Slidegeeks is here to make your presentations a breeze with Data Lineage Implementation Data Lineage And Data Governance Elements PDF With our easy to use and customizable templates, you can focus on delivering your ideas rather than worrying about formatting. With a variety of designs to choose from, you are sure to find one that suits your needs. And with animations and unique photos, illustrations, and fonts, you can make your presentation pop. So whether you are giving a sales pitch or presenting to the board, make sure to check out Slidegeeks first.
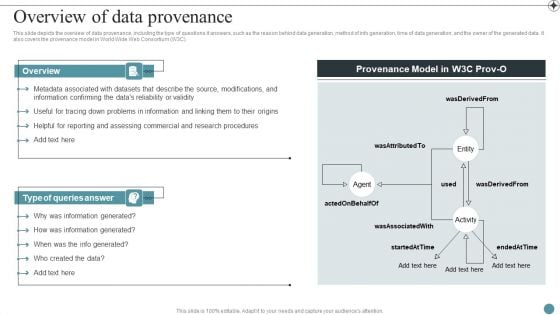
Overview Of Data Provenance Deploying Data Lineage IT Professional PDF
This slide gives an overview of graph data lineage visualization that enables business users to view and analyze data lineage to find solutions without technical skills. The search bar feature allows users to search for any data set or property in the database.Do you know about Slidesgeeks Overview Of Data Provenance Deploying Data Lineage IT Professional PDF These are perfect for delivering any kind od presentation. Using it, create PowerPoint presentations that communicate your ideas and engage audiences. Save time and effort by using our pre-designed presentation templates that are perfect for a wide range of topic. Our vast selection of designs covers a range of styles, from creative to business, and are all highly customizable and easy to edit. Download as a PowerPoint template or use them as Google Slides themes.
Data Governance IT Data Steward Vs Data Analyst Icons PDF
Present like a pro with Data Governance IT Data Steward Vs Data Analyst Icons PDF Create beautiful presentations together with your team, using our easy to use presentation slides. Share your ideas in real time and make changes on the fly by downloading our templates. So whether you are in the office, on the go, or in a remote location, you can stay in sync with your team and present your ideas with confidence. With Slidegeeks presentation got a whole lot easier. Grab these presentations today.
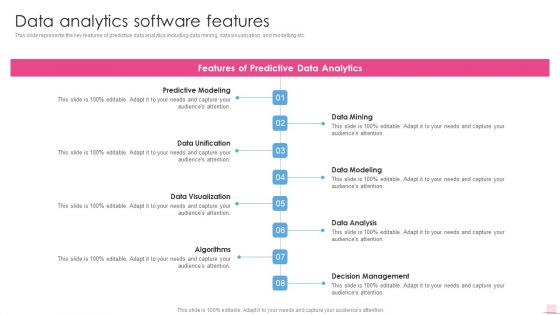
Data Analytics Software Features Business Analysis Modification Toolkit Formats PDF
This slide represents the key features of predictive data analytics including data mining, data visualization, and modelling etc.Presenting Data Analytics Software Features Business Analysis Modification Toolkit Formats PDF to provide visual cues and insights. Share and navigate important information on eight stages that need your due attention. This template can be used to pitch topics like Predictive Modeling, Data Unification, Data Visualization. In addtion, this PPT design contains high resolution images, graphics, etc, that are easily editable and available for immediate download.
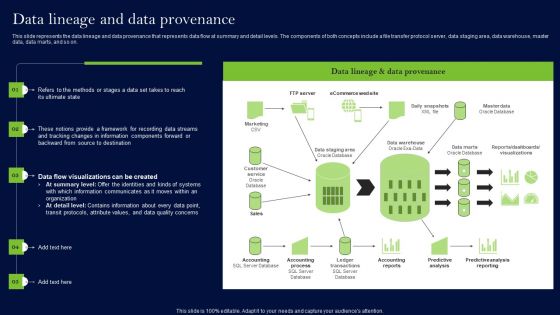
Data Lineage Methods Data Lineage And Data Provenance Download PDF
This slide represents the data lineage and data provenance that represents data flow at summary and detail levels. The components of both concepts include a file transfer protocol server, data staging area, data warehouse, master data, data marts, and so on. Are you searching for a Data Lineage Methods Data Lineage And Data Provenance Download PDF that is uncluttered, straightforward, and original Its easy to edit, and you can change the colors to suit your personal or business branding. For a presentation that expresses how much effort you have put in, this template is ideal With all of its features, including tables, diagrams, statistics, and lists, its perfect for a business plan presentation. Make your ideas more appealing with these professional slides. Download Data Lineage Methods Data Lineage And Data Provenance Download PDF from Slidegeeks today.
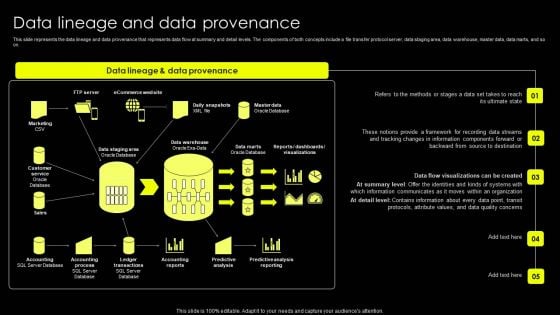
Data Lineage Implementation Data Lineage And Data Provenance Download PDF
This slide represents the data lineage and data provenance that represents data flow at summary and detail levels. The components of both concepts include a file transfer protocol server, data staging area, data warehouse, master data, data marts, and so on. Do you have an important presentation coming up Are you looking for something that will make your presentation stand out from the rest Look no further than Data Lineage Implementation Data Lineage And Data Provenance Download PDF. With our professional designs, you can trust that your presentation will pop and make delivering it a smooth process. And with Slidegeeks, you can trust that your presentation will be unique and memorable. So why wait Grab Data Lineage Implementation Data Lineage And Data Provenance Download PDF today and make your presentation stand out from the rest.
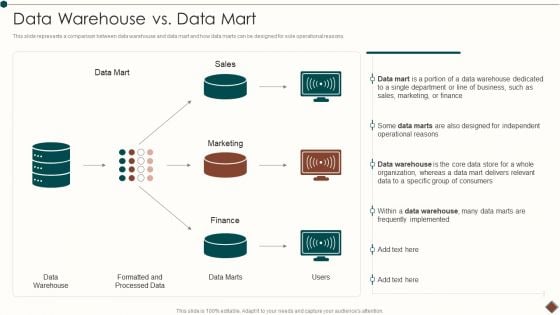
Data Warehouse Implementation Data Warehouse Vs Data Mart Summary PDF
This slide represents a comparison between data warehouse and data mart and how data marts can be designed for sole operational reasons.Deliver and pitch your topic in the best possible manner with this Data Warehouse Implementation Data Warehouse Vs Data Mart Summary PDF. Use them to share invaluable insights on Processed Data, Data Warehouse, Marketing Finance and impress your audience. This template can be altered and modified as per your expectations. So, grab it now.
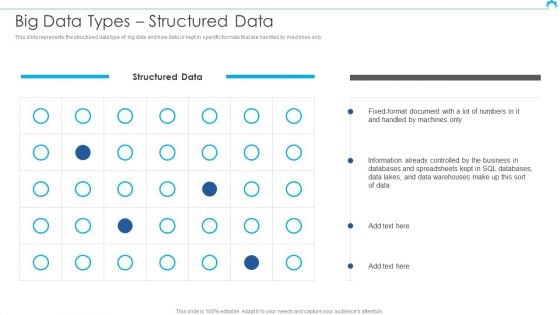
Big Data Architect Big Data Types Structured Data Infographics PDF
This slide represents the structured data type of big data and how data is kept in specific formats that are handled by machines only.Deliver an awe inspiring pitch with this creative Big Data Architect Big Data Types Structured Data Infographics PDF bundle. Topics like Already Controlled, Databases Spreadsheets, Data Warehouses can be discussed with this completely editable template. It is available for immediate download depending on the needs and requirements of the user.
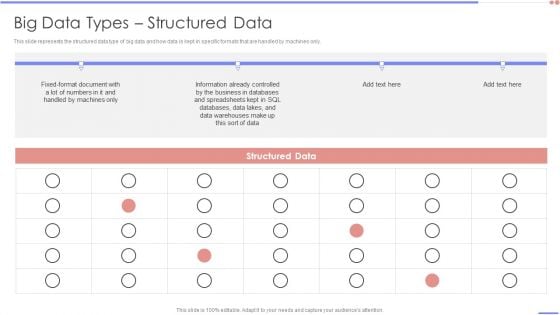
Data Analytics Management Big Data Types Structured Data Introduction PDF
This slide represents the structured data type of big data and how data is kept in specific formats that are handled by machines only.Deliver an awe inspiring pitch with this creative Data Analytics Management Big Data Types Structured Data Introduction PDF bundle. Topics like Handled By Machines, Information, Business Databases can be discussed with this completely editable template. It is available for immediate download depending on the needs and requirements of the user.
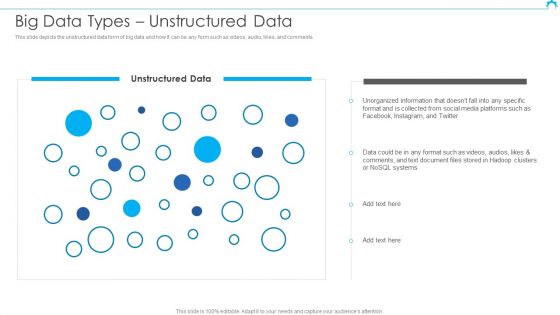
Big Data Architect Big Data Types Unstructured Data Pictures PDF
This slide depicts the unstructured data form of big data and how it can be any form such as videos, audio, likes, and comments. Deliver and pitch your topic in the best possible manner with this Big Data Architect Big Data Types Unstructured Data Pictures PDF. Use them to share invaluable insights on Unorganized Information, Media Platforms, Document Clusters and impress your audience. This template can be altered and modified as per your expectations. So, grab it now.
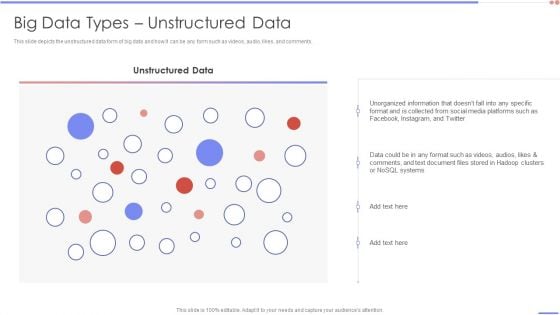
Data Analytics Management Big Data Types Unstructured Data Brochure PDF
This slide depicts the unstructured data form of big data and how it can be any form such as videos, audio, likes, and comments. Deliver and pitch your topic in the best possible manner with this Data Analytics Management Big Data Types Unstructured Data Brochure PDF. Use them to share invaluable insights on Unorganized Information, Format Collected, Document Stored and impress your audience. This template can be altered and modified as per your expectations. So, grab it now.
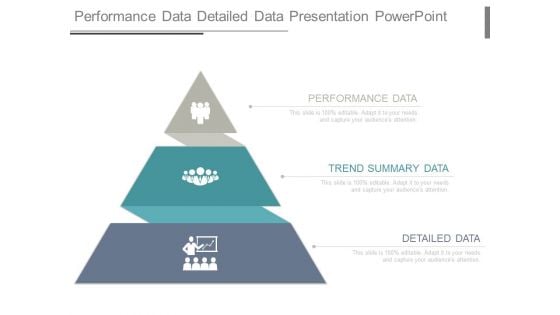
Performance Data Detailed Data Presentation Powerpoint
This is a performance data detailed data presentation powerpoint. This is a three stage process. The stages in this process are performance data, trend summary data, detailed data.
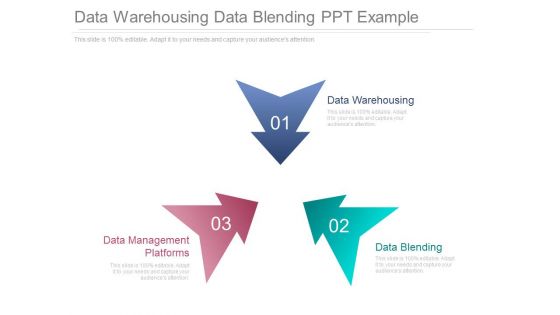
Data Warehousing Data Blending Ppt Example
This is a data warehousing data blending ppt example. This is a three stage process. The stages in this arrow, business.
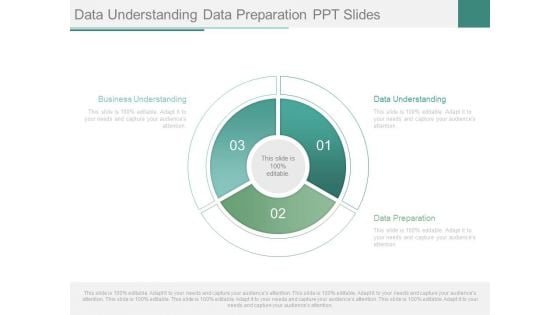
Data Understanding Data Preparation Ppt Slides
This is a data understanding data preparation ppt slides. This is a three stage process. The stages in this process are data understanding, data preparation, business understanding.
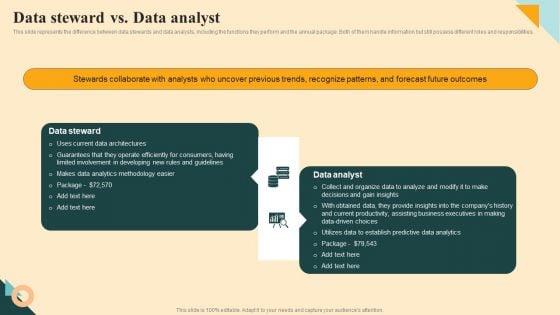
Data Steward Vs Data Analyst Background PDF
This slide represents the difference between data stewards and data analysts, including the functions they perform and the annual package. Both of them handle information but still possess different roles and responsibilities. Whether you have daily or monthly meetings, a brilliant presentation is necessary. Data Steward Vs Data Analyst Background PDF can be your best option for delivering a presentation. Represent everything in detail using Data Steward Vs Data Analyst Background PDF and make yourself stand out in meetings. The template is versatile and follows a structure that will cater to your requirements. All the templates prepared by Slidegeeks are easy to download and edit. Our research experts have taken care of the corporate themes as well. So, give it a try and see the results.
Data Analysis Reports Under Magnifying Glass Ppt Powerpoint Presentation Summary Slideshow
This is a data analysis reports under magnifying glass ppt powerpoint presentation summary slideshow. This is a three stage process. The stages in this process are data visualization icon, data management icon.
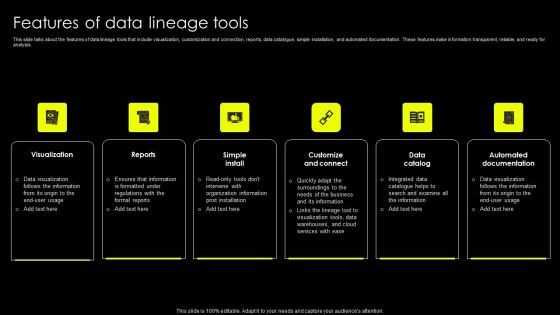
Data Lineage Implementation Features Of Data Lineage Tools Template PDF
This slide talks about the features of data lineage tools that include visualization, customization and connection, reports, data catalogue, simple installation, and automated documentation. These features make information transparent, reliable, and ready for analysis. The best PPT templates are a great way to save time, energy, and resources. Slidegeeks have 100 percent editable powerpoint slides making them incredibly versatile. With these quality presentation templates, you can create a captivating and memorable presentation by combining visually appealing slides and effectively communicating your message. Download Data Lineage Implementation Features Of Data Lineage Tools Template PDF from Slidegeeks and deliver a wonderful presentation.
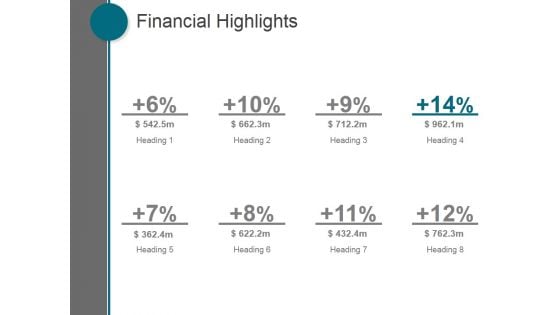
Financial Highlights Ppt PowerPoint Presentation Visual Aids
This is a financial highlights ppt powerpoint presentation visual aids. This is a eight stage process. The stages in this process are business, marketing, management, finance, strategy.
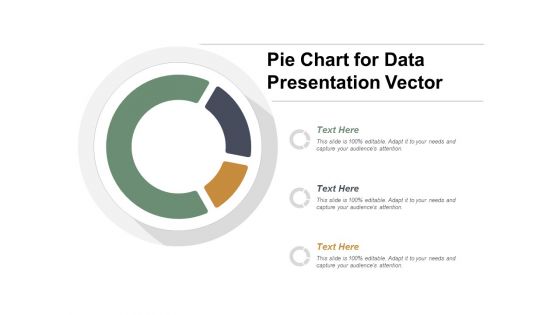
Pie Chart For Data Presentation Vector Ppt Powerpoint Presentation Summary Display
This is a pie chart for data presentation vector ppt powerpoint presentation summary display. This is a three stage process. The stages in this process are data visualization icon, data management icon.
Data Representation Vector Icon Ppt Powerpoint Presentation Infographic Template Example File
This is a data representation vector icon ppt powerpoint presentation infographic template example file. This is a four stage process. The stages in this process are data visualization icon, data management icon.
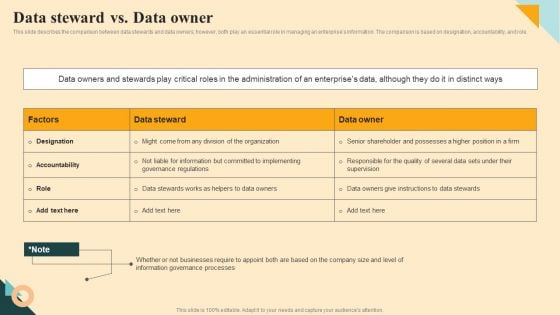
Data Steward Vs Data Owner Brochure PDF
This slide describes the comparison between data stewards and data owners however, both play an essential role in managing an enterprises information. The comparison is based on designation, accountability, and role. This Data Steward Vs Data Owner Brochure PDF from Slidegeeks makes it easy to present information on your topic with precision. It provides customization options, so you can make changes to the colors, design, graphics, or any other component to create a unique layout. It is also available for immediate download, so you can begin using it right away. Slidegeeks has done good research to ensure that you have everything you need to make your presentation stand out. Make a name out there for a brilliant performance.

 Home
Home