Financial Dashboard
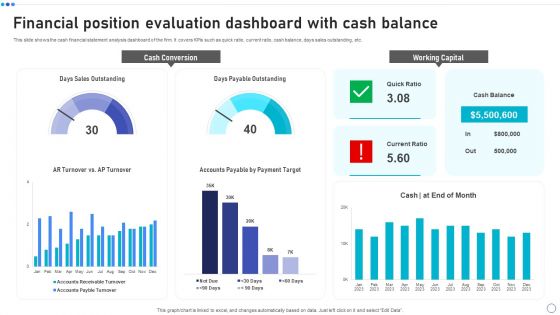
Financial Position Evaluation Dashboard With Cash Balance Rules PDF
This slide shows the cash financial statement analysis dashboard of the firm. It covers KPIs such as quick ratio, current ratio, cash balance, days sales outstanding, etc. Showcasing this set of slides titled Financial Position Evaluation Dashboard With Cash Balance Rules PDF. The topics addressed in these templates are Cash Conversion, Working Capital, Days Sales Outstanding. All the content presented in this PPT design is completely editable. Download it and make adjustments in color, background, font etc. as per your unique business setting.
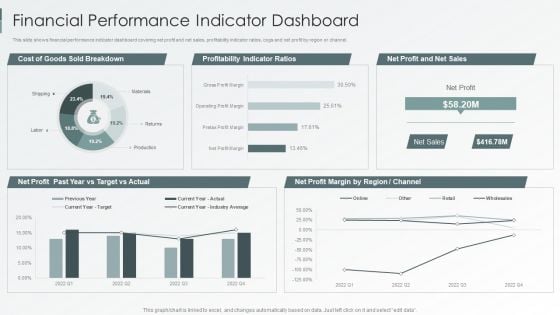
Enterprise Sustainability Performance Metrics Financial Performance Indicator Dashboard Themes PDF
This slide shows financial performance indicator dashboard covering net profit and net sales, profitability indicator ratios, cogs and net profit by region or channel.Deliver an awe inspiring pitch with this creative Enterprise Sustainability Performance Metrics Financial Performance Indicator Dashboard Themes PDF bundle. Topics like Profitability Indicator, Sold Breakdown, Target Actual can be discussed with this completely editable template. It is available for immediate download depending on the needs and requirements of the user.
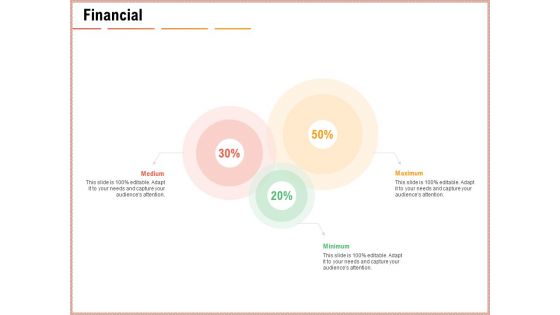
Net Promoter Score Dashboard Financial Ppt Styles Show PDF
Presenting net promoter score dashboard financial ppt styles show pdf to provide visual cues and insights. Share and navigate important information on three stages that need your due attention. This template can be used to pitch topics like financial, medium, minimum, maximum. In addtion, this PPT design contains high-resolution images, graphics, etc, that are easily editable and available for immediate download.
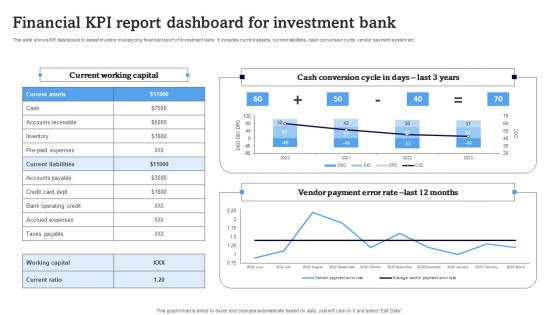
Financial KPI Report Dashboard For Investment Bank Structure Pdf
This slide shows KPI dashboard to assist investor in analyzing financial report of investment bank. It includes current assets, current liabilities, cash conversion cycle, vendor payment system etc. Showcasing this set of slides titled Financial KPI Report Dashboard For Investment Bank Structure Pdf. The topics addressed in these templates are Current Working Capital, Cash Conversion Cycle Days, Vendor Payment Error Rate. All the content presented in this PPT design is completely editable. Download it and make adjustments in color, background, font etc. as per your unique business setting. This slide shows KPI dashboard to assist investor in analyzing financial report of investment bank. It includes current assets, current liabilities, cash conversion cycle, vendor payment system etc.
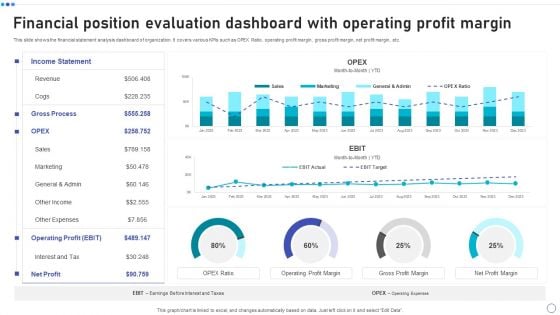
Financial Position Evaluation Dashboard With Operating Profit Margin Elements PDF
This slide shows the financial statement analysis dashboard of organization. It covers various KPIs such as OPEX Ratio, operating profit margin, gross profit margin, net profit margin, etc. Pitch your topic with ease and precision using this Financial Position Evaluation Dashboard With Operating Profit Margin Elements PDF. This layout presents information on Income Statement, Revenue, Operating Profit, Net Profit. It is also available for immediate download and adjustment. So, changes can be made in the color, design, graphics or any other component to create a unique layout.
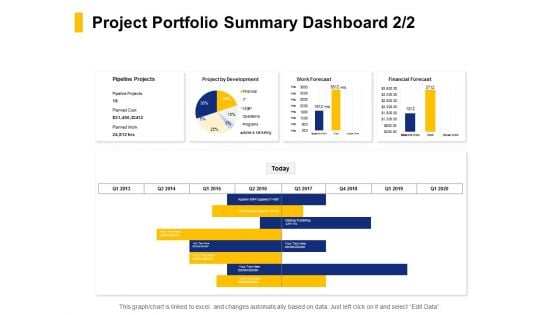
Project Portfolio Summary Dashboard Financial Ppt PowerPoint Presentation Outline Aids
Presenting this set of slides with name project portfolio summary dashboard financial ppt powerpoint presentation outline aids. The topics discussed in these slides are pipeline projects, project development, financial forecast. This is a completely editable PowerPoint presentation and is available for immediate download. Download now and impress your audience.
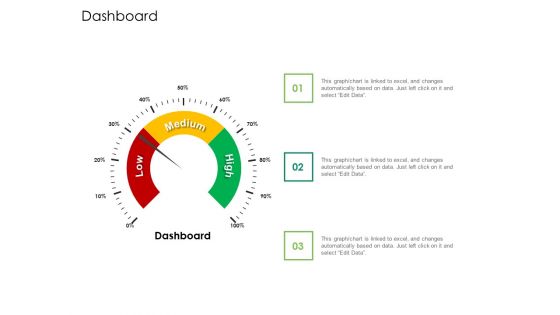
Global Financial Catastrophe 2008 Dashboard Ppt Inspiration Template PDF
Deliver an awe inspiring pitch with this creative global financial catastrophe 2008 dashboard ppt inspiration template pdf bundle. Topics like dashboard can be discussed with this completely editable template. It is available for immediate download depending on the needs and requirements of the user.
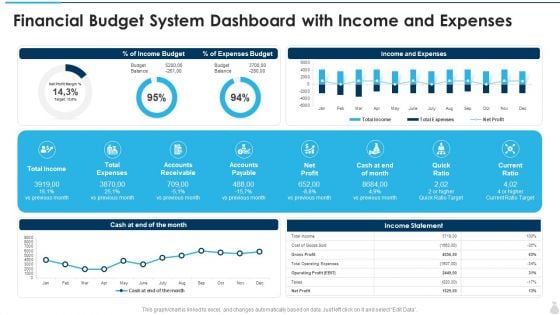
Financial Budget System Dashboard With Income And Expenses Formats PDF
Deliver an awe inspiring pitch with this creative financial budget system dashboard with income and expenses formats pdf bundle. Topics like expenses budget, income budget, expenses can be discussed with this completely editable template. It is available for immediate download depending on the needs and requirements of the user.
Corporate Turnaround Strategies Financial Performance Tracking Dashboard Rules PDF
Presenting this set of slides with name corporate turnaround strategies financial performance tracking dashboard rules pdf. The topics discussed in these slides are performance, profit, revenue, expense, customers. This is a completely editable PowerPoint presentation and is available for immediate download. Download now and impress your audience.
Effective Corporate Turnaround Management Financial Performance Tracking Dashboard Graphics PDF
Presenting this set of slides with name effective corporate turnaround management financial performance tracking dashboard graphics pdf. The topics discussed in these slides are performance, profit, revenue, expense, customers. This is a completely editable PowerPoint presentation and is available for immediate download. Download now and impress your audience.
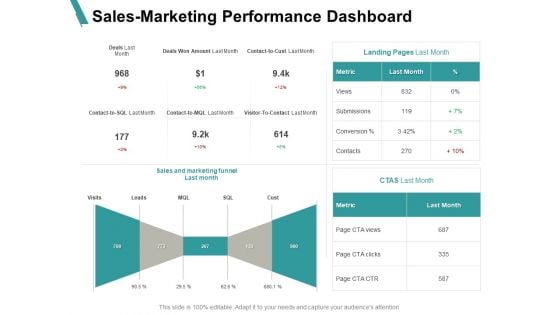
Sales Marketing Performance Dashboard Financial Ppt PowerPoint Presentation Styles Backgrounds
Presenting this set of slides with name sales marketing performance dashboard financial ppt powerpoint presentation styles backgrounds. The topics discussed in these slides are marketing, business, management, planning, strategy. This is a completely editable PowerPoint presentation and is available for immediate download. Download now and impress your audience.
Organizational Plan Overview Corporate Financial Performance Tracking Dashboard Icons PDF
This slide provides information regarding dashboard utilized by firm to monitor financial performance. The performance is tracked through revenues generated, vendors associated, profit generated, etc. Here you can discover an assortment of the finest PowerPoint and Google Slides templates. With these templates, you can create presentations for a variety of purposes while simultaneously providing your audience with an eye-catching visual experience. Download Organizational Plan Overview Corporate Financial Performance Tracking Dashboard Icons PDF to deliver an impeccable presentation. These templates will make your job of preparing presentations much quicker, yet still, maintain a high level of quality. Slidegeeks has experienced researchers who prepare these templates and write high-quality content for you. Later on, you can personalize the content by editing the Organizational Plan Overview Corporate Financial Performance Tracking Dashboard Icons PDF.
Cyber Safety Incident Management Financial Performance Tracking Dashboard Formats PDF
This slide presents the dashboard which will help firm in tracking the fiscal performance. This dashboard displays revenues and expenses trends and payment received analysis. Deliver an awe inspiring pitch with this creative cyber safety incident management financial performance tracking dashboard formats pdf bundle. Topics like revenue and expense trends, receivables analysis can be discussed with this completely editable template. It is available for immediate download depending on the needs and requirements of the user.
Threat Management At Workplace Financial Performance Tracking Dashboard Introduction Pdf
This slide presents the dashboard which will help firm in tracking the fiscal performance. This dashboard displays revenues and expenses trends and payment received analysis. Deliver and pitch your topic in the best possible manner with this threat management at workplace financial performance tracking dashboard introduction pdf. Use them to share invaluable insights on revenue trends, expense trends, receivables analysis and impress your audience. This template can be altered and modified as per your expectations. So, grab it now.
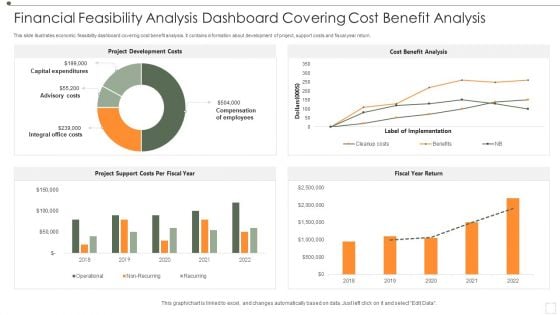
Financial Feasibility Analysis Dashboard Covering Cost Benefit Analysis Professional PDF
This slide illustrates economic feasibility dashboard covering cost benefit analysis. It contains information about development of project, support costs and fiscal year return. Showcasing this set of slides titled Financial Feasibility Analysis Dashboard Covering Cost Benefit Analysis Professional PDF. The topics addressed in these templates are Project Development Costs, Cost Benefit Analysis, Fiscal Year Return. All the content presented in this PPT design is completely editable. Download it and make adjustments in color, background, font etc. as per your unique business setting.
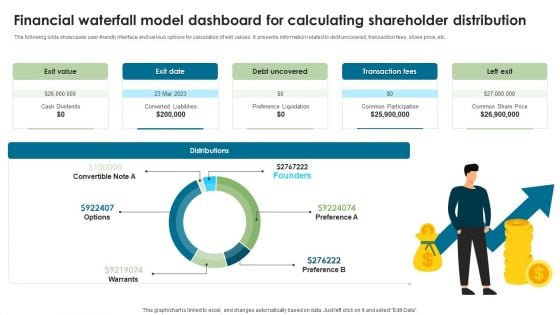
Financial Waterfall Model Dashboard For Calculating Shareholder Distribution Slides PDF
The following slide showcases user-friendly interface and various options for calculation of exit values. It presents information related to debt uncovered, transaction fees, share price, etc. Showcasing this set of slides titled Financial Waterfall Model Dashboard For Calculating Shareholder Distribution Slides PDF. The topics addressed in these templates are Exit Value, Exit Date, Debt Uncovered. All the content presented in this PPT design is completely editable. Download it and make adjustments in color, background, font etc. as per your unique business setting.
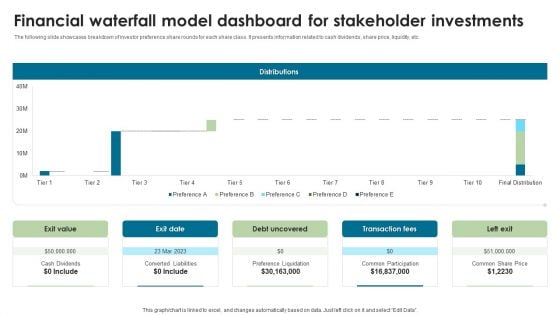
Financial Waterfall Model Dashboard For Stakeholder Investments Graphics PDF
The following slide showcases breakdown of investor preference share rounds for each share class. It presents information related to cash dividends, share price, liquidity, etc. Showcasing this set of slides titled Financial Waterfall Model Dashboard For Stakeholder Investments Graphics PDF. The topics addressed in these templates are Distributions, Transaction Fees, Left Exit. All the content presented in this PPT design is completely editable. Download it and make adjustments in color, background, font etc. as per your unique business setting.
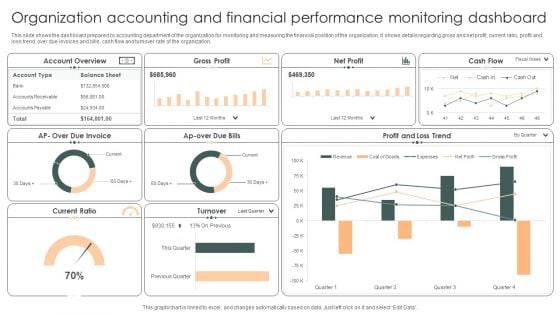
Organization Accounting And Financial Performance Monitoring Dashboard Pictures PDF
This slide shows the dashboard prepared by accounting department of the organization for monitoring and measuring the financial position of the organization. It shows details regarding gross and net profit, current ratio, profit and loss trend, over due invoices and bills, cash flow and turnover rate of the organization.Showcasing this set of slides titled Organization Accounting And Financial Performance Monitoring Dashboard Pictures PDF. The topics addressed in these templates are Account Overview, Due Invoice, Loss Trend. All the content presented in this PPT design is completely editable. Download it and make adjustments in color, background, font etc. as per your unique business setting.
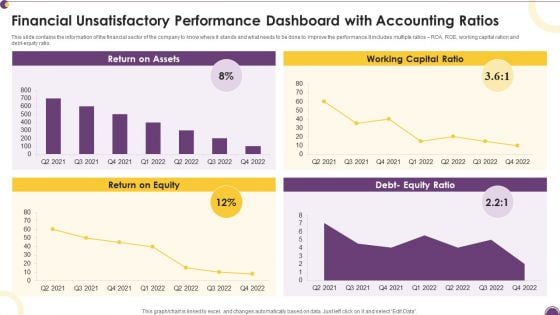
Financial Unsatisfactory Performance Dashboard With Accounting Ratios Diagrams PDF
This slide contains the information of the financial sector of the company to know where it stands and what needs to be done to improve the performance.It includes multiple ratios ROA, ROE, working capital ration and debt-equity ratio. Pitch your topic with ease and precision using this Financial Unsatisfactory Performance Dashboard With Accounting Ratios Diagrams PDF. This layout presents information on Return Assets, Working Capital, Return Equity. It is also available for immediate download and adjustment. So, changes can be made in the color, design, graphics or any other component to create a unique layout.
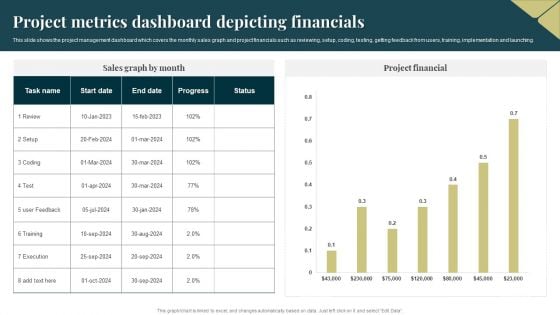
Project Metrics Dashboard Depicting Financials Pictures PDF
This slide shows the project management dashboard which covers the monthly sales graph and project financials such as reviewing, setup, coding, testing, getting feedback from users, training, implementation and launching. Pitch your topic with ease and precision using this Project Metrics Dashboard Depicting Financials Pictures PDF. This layout presents information on Execution, Project Financial. It is also available for immediate download and adjustment. So, changes can be made in the color, design, graphics or any other component to create a unique layout.
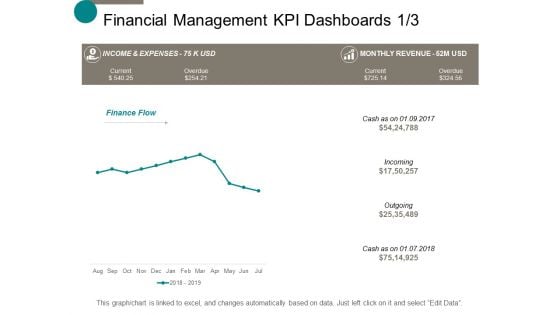
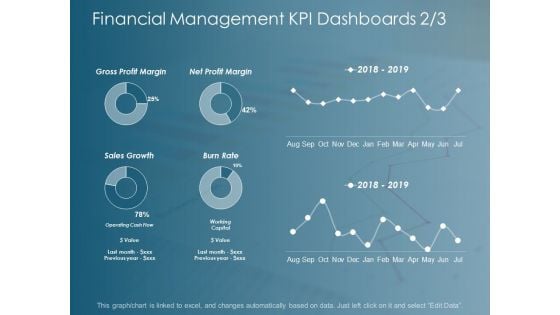
Financial Management Kpi Dashboards Business Ppt Powerpoint Presentation Show Gridlines
This is a financial management kpi dashboards business ppt powerpoint presentation show gridlines. This is a four stage process. The stages in this process are finance, marketing, management, investment, analysis.
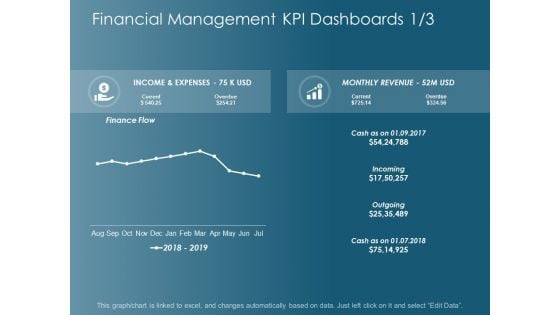
Financial Management Kpi Dashboards Business Ppt Powerpoint Presentation Inspiration Designs
This is a financial management kpi dashboards business ppt powerpoint presentation inspiration designs. This is a six stage process. The stages in this process are finance, marketing, management, investment, analysis.
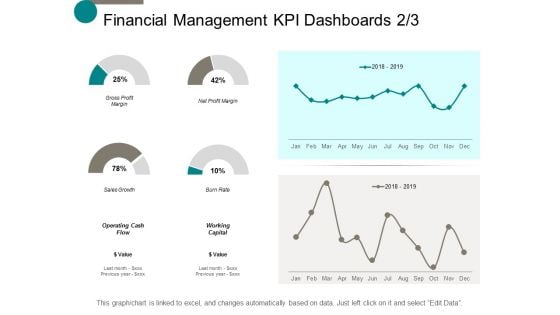
Financial Management Kpi Dashboards Marketing Ppt Powerpoint Presentation Inspiration Microsoft
This is a financial management kpi dashboards marketing ppt powerpoint presentation inspiration microsoft. This is a one stage process. The stages in this process are finance, marketing, management, investment, analysis.
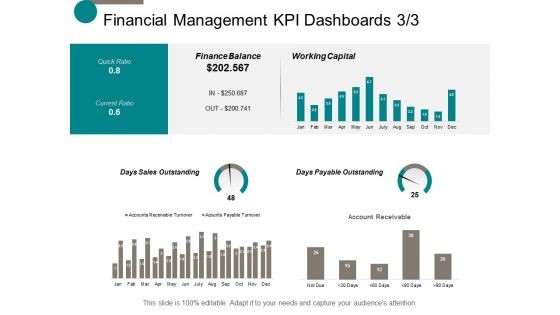
Financial Management Kpi Dashboards Marketing Ppt Powerpoint Presentation Infographics Outline
This is a financial management kpi dashboards marketing ppt powerpoint presentation infographics outline. This is a six stage process. The stages in this process are finance, marketing, management, investment, analysis.
Financial Management Kpi Dashboards Finance Ppt Powerpoint Presentation Ideas Brochure
This is a financial management kpi dashboards finance ppt powerpoint presentation ideas brochure. This is a six stage process. The stages in this process are finance, marketing, management, investment, analysis.
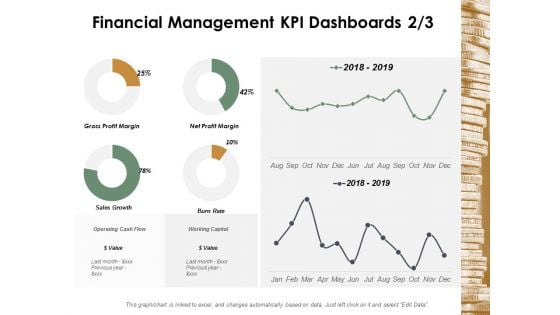
Financial Management Kpi Dashboards Management Ppt Powerpoint Presentation Slides Tips
This is a financial management kpi dashboards management ppt powerpoint presentation slides tips. This is a six stage process. The stages in this process are finance, marketing, management, investment, analysis.
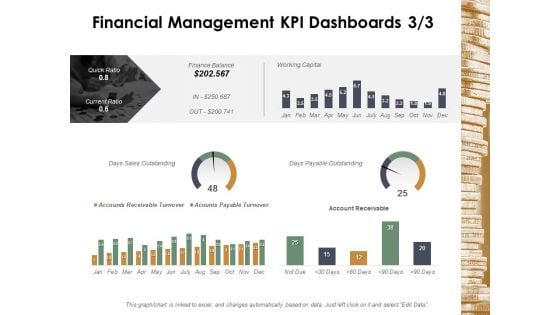
Financial Management Kpi Dashboards Marketing Ppt Powerpoint Presentation Professional Portrait
This is a financial management kpi dashboards marketing ppt powerpoint presentation professional portrait. This is a six stage process. The stages in this process are finance, marketing, management, investment, analysis.
Strategic Financial Planning And Administration KPI Dashboard Analyze Financial Improvements Icons PDF
This slide showcases the KPIs that would help our business organization to evaluate improvements with the new financial strategy implementation. It includes total income, total expenses, accounts receivable, etc. Retrieve professionally designed Strategic Financial Planning And Administration KPI Dashboard Analyze Financial Improvements Icons PDF to effectively convey your message and captivate your listeners. Save time by selecting pre-made slideshows that are appropriate for various topics, from business to educational purposes. These themes come in many different styles, from creative to corporate, and all of them are easily adjustable and can be edited quickly. Access them as PowerPoint templates or as Google Slides themes. You do not have to go on a hunt for the perfect presentation because Slidegeeks got you covered from everywhere. This slide showcases the KPIs that would help our business organization to evaluate improvements with the new financial strategy implementation. It includes total income, total expenses, accounts receivable, etc.
Icon For Annual Financial Performance Dashboard For Capital Fund Raising Ppt Layouts Layout PDF
Presenting Icon For Annual Financial Performance Dashboard For Capital Fund Raising Ppt Layouts Layout PDF to dispense important information. This template comprises three stages. It also presents valuable insights into the topics including Icon, Annual Financial ,Performance Dashboard, Capital Fund Raising. This is a completely customizable PowerPoint theme that can be put to use immediately. So, download it and address the topic impactfully.
Business Financial Report Dashboard Vector Icon Ppt PowerPoint Presentation File Graphics PDF
Presenting business financial report dashboard vector icon ppt powerpoint presentation file graphics pdf to dispense important information. This template comprises three stages. It also presents valuable insights into the topics including business financial report dashboard vector icon. This is a completely customizable PowerPoint theme that can be put to use immediately. So, download it and address the topic impactfully.
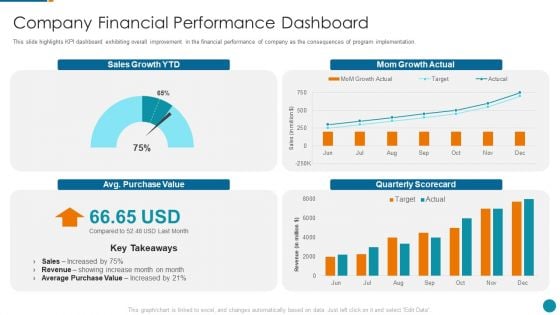
Strategic Procedure To Improve Employee Efficiency Company Financial Performance Dashboard Infographics PDF
This slide highlights KPI dashboard exhibiting overall improvement in the financial performance of company as the consequences of program implementation. Deliver and pitch your topic in the best possible manner with this strategic procedure to improve employee efficiency company financial performance dashboard infographics pdf Use them to share invaluable insights on company financial performance dashboard and impress your audience. This template can be altered and modified as per your expectations. So, grab it now.
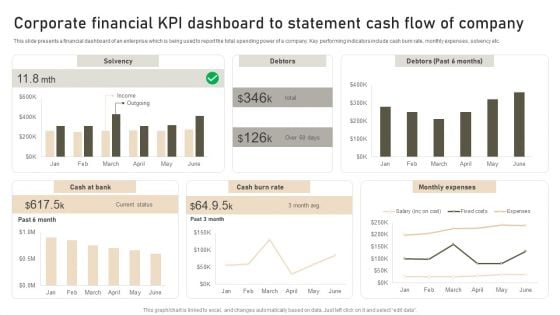
Corporate Financial KPI Dashboard To Statement Cash Flow Of Company Diagrams PDF
This slide presents a financial dashboard of an enterprise which is being used to report the total spending power of a company. Key performing indicators include cash burn rate, monthly expenses, solvency etc. Showcasing this set of slides titled Corporate Financial KPI Dashboard To Statement Cash Flow Of Company Diagrams PDF. The topics addressed in these templates are Solvency, Debtors, Monthly Expenses. All the content presented in this PPT design is completely editable. Download it and make adjustments in color, background, font etc. as per your unique business setting.
Strategy To Improve Team Proficiency Company Financial Performance Dashboard Icons PDF
This slide provides detailed interpretation of statistics metrics provided in the previous slide highlighting the improvements in organization current human capital state. Deliver and pitch your topic in the best possible manner with this strategy to improve team proficiency company financial performance dashboard icons pdf. Use them to share invaluable insights on company financial performance dashboard and impress your audience. This template can be altered and modified as per your expectations. So, grab it now.
Financial Environment Dashboard For Tracking Growth In Banking Industry Slides PDF
This slide covers financial environment dashboard for tracking growth in banking industry which includes overall regional and sub-regional growth of banking services Pitch your topic with ease and precision using this Financial Environment Dashboard For Tracking Growth In Banking Industry Slides PDF This layout presents information on Best Demonstrated, Worst Demonstrated, Average Variance It is also available for immediate download and adjustment. So, changes can be made in the color, design, graphics or any other component to create a unique layout.
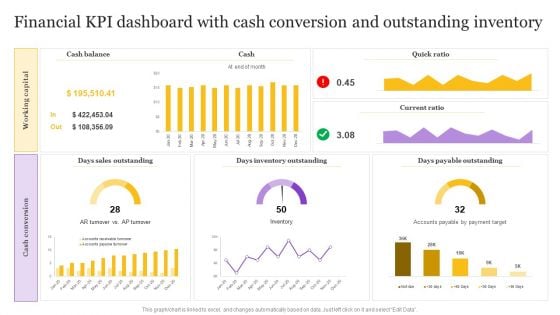
Financial KPI Dashboard With Cash Conversion And Outstanding Inventory Pictures PDF
Pitch your topic with ease and precision using this Financial KPI Dashboard With Cash Conversion And Outstanding Inventory Pictures PDF. This layout presents information on Cash Conversion, Working Capital, Days Sales Outstanding. It is also available for immediate download and adjustment. So, changes can be made in the color, design, graphics or any other component to create a unique layout.
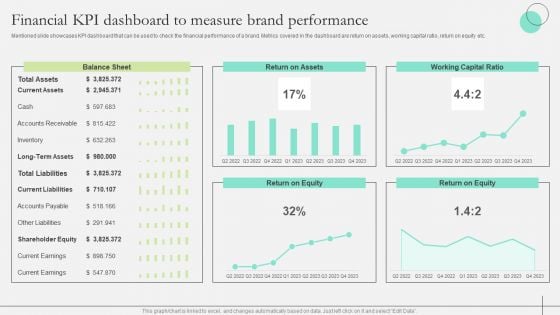
Comprehensive Guide To Strengthen Brand Equity Financial KPI Dashboard Measure Brand Structure PDF
Mentioned slide showcases KPI dashboard that can be used to check the financial performance of a brand. Metrics covered in the dashboard are return on assets, working capital ratio, return on equity etc. Take your projects to the next level with our ultimate collection of Comprehensive Guide To Strengthen Brand Equity Financial KPI Dashboard Measure Brand Structure PDF. Slidegeeks has designed a range of layouts that are perfect for representing task or activity duration, keeping track of all your deadlines at a glance. Tailor these designs to your exact needs and give them a truly corporate look with your own brand colors they will make your projects stand out from the rest
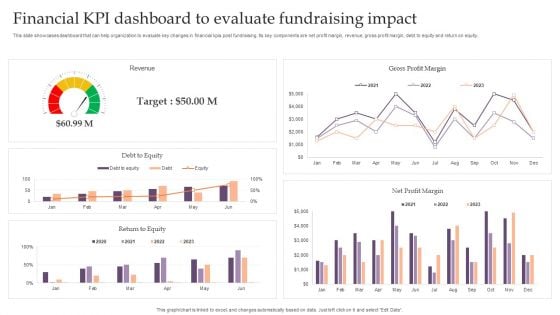
Assessing Debt And Equity Fundraising Alternatives For Business Growth Financial KPI Dashboard To Evaluate Infographics PDF
This slide showcases dashboard that can help organization to evaluate key changes in financial kpis post fundraising. Its key components are net profit margin, revenue, gross profit margin, debt to equity and return on equity. This Assessing Debt And Equity Fundraising Alternatives For Business Growth Financial KPI Dashboard To Evaluate Infographics PDF is perfect for any presentation, be it in front of clients or colleagues. It is a versatile and stylish solution for organizing your meetings. TheAssessing Debt And Equity Fundraising Alternatives For Business Growth Financial KPI Dashboard To Evaluate Infographics PDF features a modern design for your presentation meetings. The adjustable and customizable slides provide unlimited possibilities for acing up your presentation. Slidegeeks has done all the homework before launching the product for you. So, do not wait, grab the presentation templates today
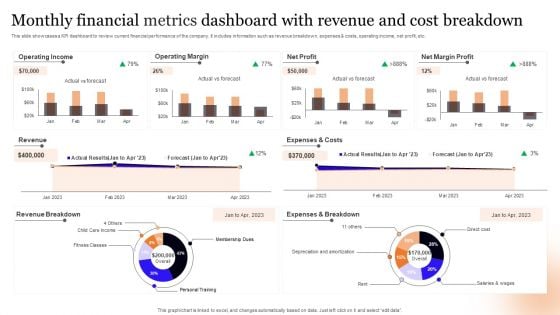
Monthly Financial Metrics Dashboard With Revenue And Cost Breakdown Information PDF
This slide showcases a KPI dashboard to review current financial performance of the company. It includes information such as revenue breakdown, expenses and costs, operating income, net profit, etc. Pitch your topic with ease and precision using this Monthly Financial Metrics Dashboard With Revenue And Cost Breakdown Information PDF. This layout presents information on Operating Income, Operating Margin, Net Profit. It is also available for immediate download and adjustment. So, changes can be made in the color, design, graphics or any other component to create a unique layout.
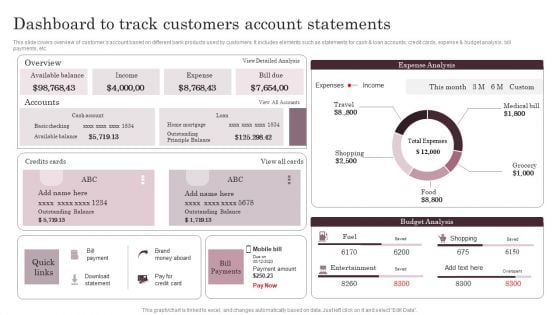
Omnichannel Services Solution In Financial Sector Dashboard To Track Customers Account Statements Guidelines PDF
This slide covers overview of customers account based on different bank products used by customers. It includes elements such as statements for cash and loan accounts, credit cards, expense and budget analysis, bill payments, etc. Create an editable Omnichannel Services Solution In Financial Sector Dashboard To Track Customers Account Statements Guidelines PDF that communicates your idea and engages your audience. Whether you are presenting a business or an educational presentation, pre designed presentation templates help save time. Omnichannel Services Solution In Financial Sector Dashboard To Track Customers Account Statements Guidelines PDF is highly customizable and very easy to edit, covering many different styles from creative to business presentations. Slidegeeks has creative team members who have crafted amazing templates. So, go and get them without any delay.
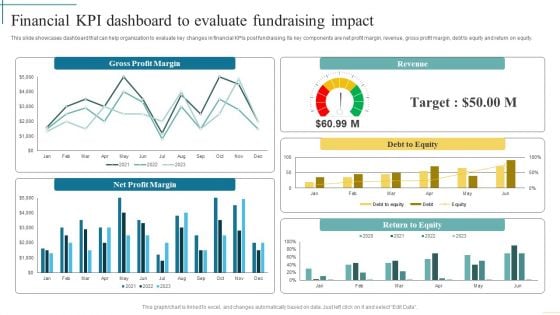
Financial Kpi Dashboard To Evaluate Fundraising Impact Developing Fundraising Techniques Diagrams PDF
This slide showcases dashboard that can help organization to evaluate key changes in financial KPIs post fundraising. Its key components are net profit margin, revenue, gross profit margin, debt to equity and return on equity. From laying roadmaps to briefing everything in detail, our templates are perfect for you. You can set the stage with your presentation slides. All you have to do is download these easy-to-edit and customizable templates. Financial Kpi Dashboard To Evaluate Fundraising Impact Developing Fundraising Techniques Diagrams PDF will help you deliver an outstanding performance that everyone would remember and praise you for. Do download this presentation today.
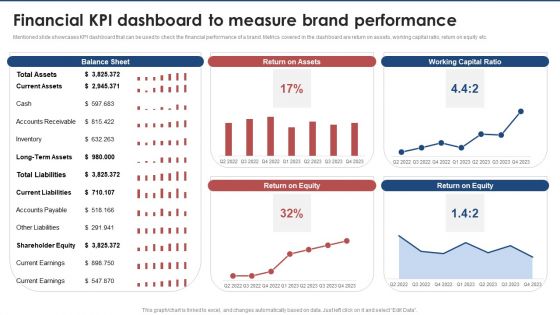
Financial Kpi Dashboard To Measure Brand Performance Brand Value Estimation Guide Inspiration PDF
Mentioned slide showcases KPI dashboard that can be used to check the financial performance of a brand. Metrics covered in the dashboard are return on assets, working capital ratio, return on equity etc.Are you in need of a template that can accommodate all of your creative concepts This one is crafted professionally and can be altered to fit any style. Use it with Google Slides or PowerPoint. Include striking photographs, symbols, depictions, and other visuals. Fill, move around, or remove text boxes as desired. Test out color palettes and font mixtures. Edit and save your work, or work with colleagues. Download Financial Kpi Dashboard To Measure Brand Performance Brand Value Estimation Guide Inspiration PDF and observe how to make your presentation outstanding. Give an impeccable presentation to your group and make your presentation unforgettable.
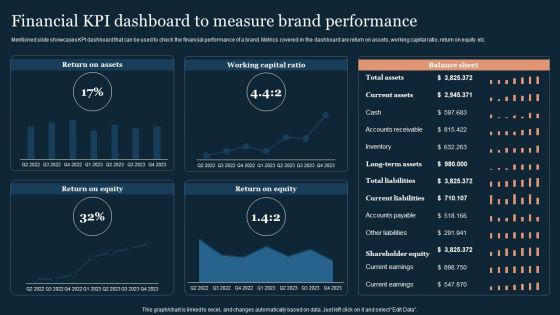
Guide To Develop And Estimate Brand Value Financial KPI Dashboard To Measure Brand Performance Formats PDF
Mentioned slide showcases KPI dashboard that can be used to check the financial performance of a brand. Metrics covered in the dashboard are return on assets, working capital ratio, return on equity etc.Coming up with a presentation necessitates that the majority of the effort goes into the content and the message you intend to convey. The visuals of a PowerPoint presentation can only be effective if it supplements and supports the story that is being told. Keeping this in mind our experts created Guide To Develop And Estimate Brand Value Financial KPI Dashboard To Measure Brand Performance Formats PDF to reduce the time that goes into designing the presentation. This way, you can concentrate on the message while our designers take care of providing you with the right template for the situation.
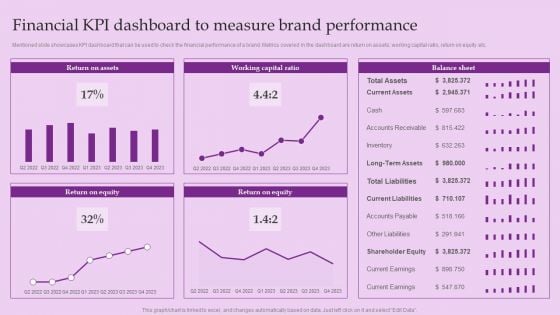
Financial KPI Dashboard To Measure Brand Performance Brand And Equity Evaluation Techniques Elements PDF
Mentioned slide showcases KPI dashboard that can be used to check the financial performance of a brand. Metrics covered in the dashboard are return on assets, working capital ratio, return on equity etc.Coming up with a presentation necessitates that the majority of the effort goes into the content and the message you intend to convey. The visuals of a PowerPoint presentation can only be effective if it supplements and supports the story that is being told. Keeping this in mind our experts created Financial KPI Dashboard To Measure Brand Performance Brand And Equity Evaluation Techniques Elements PDF to reduce the time that goes into designing the presentation. This way, you can concentrate on the message while our designers take care of providing you with the right template for the situation.

Funding Pitch On Key Financial Metrics Dashboard Ppt Ideas Deck PDF
This slide illustrates facts and figures related to important financial metrics It includes cash flow, DSO, ROCE, EPS diluted for Q4 FY21, Q3 FY22 and Q4 FY22 etc. Showcasing this set of slides titled Funding Pitch On Key Financial Metrics Dashboard Ppt Ideas Deck PDF. The topics addressed in these templates are Cash Flow, EPS Diluted, ROCE. All the content presented in this PPT design is completely editable. Download it and make adjustments in color, background, font etc. as per your unique business setting.
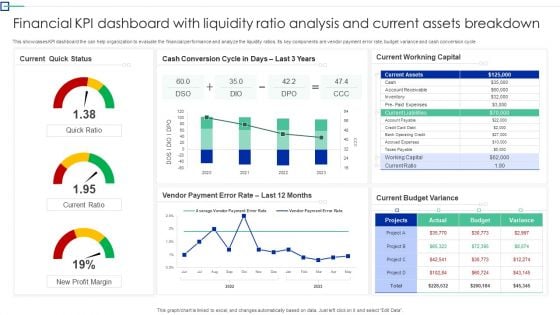
Financial KPI Dashboard With Liquidity Ratio Analysis And Current Assets Breakdown Ideas PDF
This showcases KPI dashboard the can help organization to evaluate the financial performance and analyze the liquidity ratios. Its key components are vendor payment error rate, budget variance and cash conversion cycle. Showcasing this set of slides titled. The topics addressed in these templates are Quick Status, Workning Capital, Budget Variance. All the content presented in this PPT design is completely editable. Download it and make adjustments in color, background, font etc. as per your unique business setting.
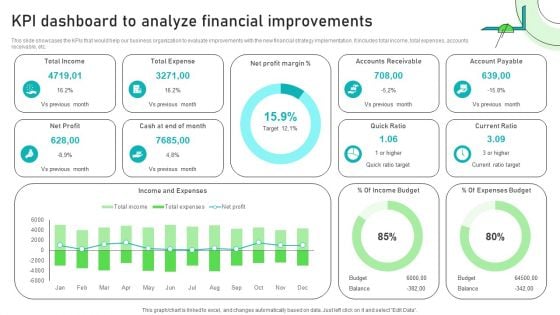
Adjusting Financial Strategies And Planning KPI Dashboard To Analyze Financial Improvements Inspiration PDF
This slide showcases the KPIs that would help our business organization to evaluate improvements with the new financial strategy implementation. It includes total income, total expenses, accounts receivable, etc. The best PPT templates are a great way to save time, energy, and resources. Slidegeeks have 100 percent editable powerpoint slides making them incredibly versatile. With these quality presentation templates, you can create a captivating and memorable presentation by combining visually appealing slides and effectively communicating your message. Download Adjusting Financial Strategies And Planning KPI Dashboard To Analyze Financial Improvements Inspiration PDF from Slidegeeks and deliver a wonderful presentation.
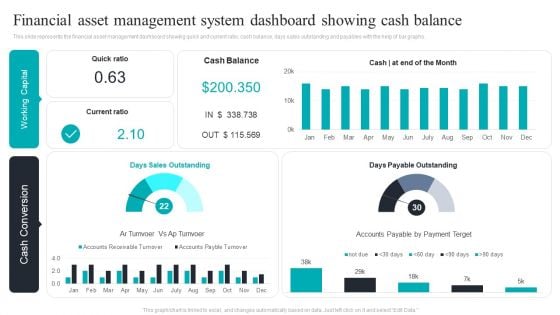
Financial Asset Management System Dashboard Showing Cash Balance Download PDF
This slide represents the financial asset management dashboard showing quick and current ratio, cash balance, days sales outstanding and payables with the help of bar graphs. Pitch your topic with ease and precision using this Financial Asset Management System Dashboard Showing Cash Balance Download PDF. This layout presents information on Financial Asset, Management System, Dashboard Showing, Cash Balance. It is also available for immediate download and adjustment. So, changes can be made in the color, design, graphics or any other component to create a unique layout.
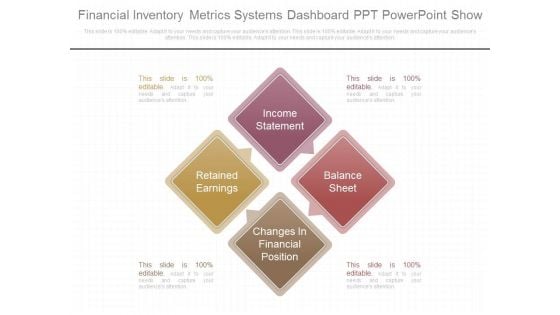
Financial Inventory Metrics Systems Dashboard Ppt Powerpoint Show
This is a financial inventory metrics systems dashboard ppt powerpoint show. This is a four stage process. The stages in this process are income statement, retained earnings, balance sheet, changes in financial position.
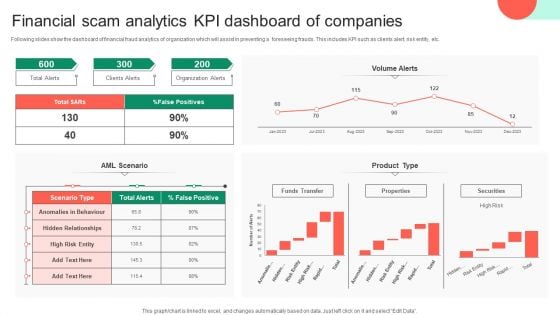
Financial Scam Analytics KPI Dashboard Of Companies Clipart PDF
Following slides show the dashboard of financial fraud analytics of organization which will assist in preventing a foreseeing frauds. This includes KPI such as clients alert, risk entity, etc. Pitch your topic with ease and precision using this Financial Scam Analytics KPI Dashboard Of Companies Clipart PDF. This layout presents information on Financial Scam Analytics, Kpi Dashboard Of Companies. It is also available for immediate download and adjustment. So, changes can be made in the color, design, graphics or any other component to create a unique layout.
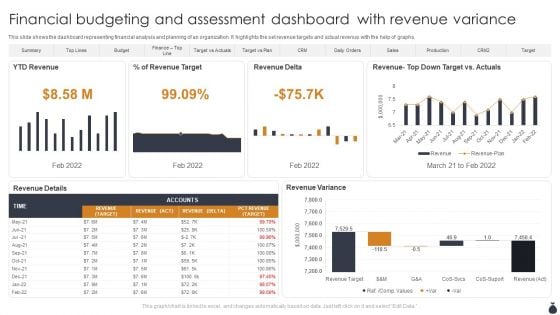
Financial Budgeting And Assessment Dashboard With Revenue Variance Designs PDF
This slide shows the dashboard representing financial analysis and planning of an organization. It highlights the set revenue targets and actual revenue with the help of graphs. Showcasing this set of slides titled Financial Budgeting And Assessment Dashboard With Revenue Variance Designs PDF. The topics addressed in these templates are YTD Revenue, Revenue Delta, Revenue Variance. All the content presented in this PPT design is completely editable. Download it and make adjustments in color, background, font etc. as per your unique business setting.
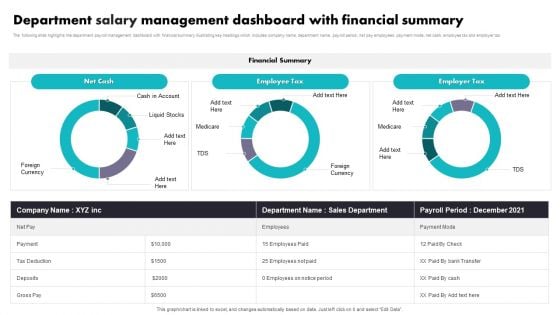
Department Salary Management Dashboard With Financial Summary Portrait PDF
The following slide highlights the department payroll management dashboard with financial summary illustrating key headings which includes company name, department name, payroll period, net pay employees, payment mode, net cash, employee tax and employer tax. Showcasing this set of slides titled Department Salary Management Dashboard With Financial Summary Portrait PDF. The topics addressed in these templates are Sales Department, Employee Tax, Financial Summary. All the content presented in this PPT design is completely editable. Download it and make adjustments in color, background, font etc. as per your unique business setting.
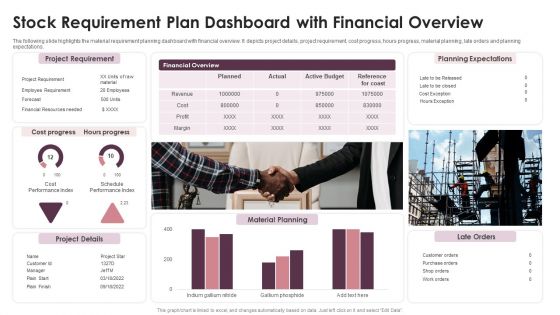
Stock Requirement Plan Dashboard With Financial Overview Formats PDF
The following slide highlights the material requirement planning dashboard with financial overview. It depicts project details, project requirement, cost progress, hours progress, material planning, late orders and planning expectations. Showcasing this set of slides titled Stock Requirement Plan Dashboard With Financial Overview Formats PDF. The topics addressed in these templates are Project Requirement, Planning Expectations, Project Details. All the content presented in this PPT design is completely editable. Download it and make adjustments in color, background, font etc. as per your unique business setting.

BPO Managing Enterprise Financial Transactions Accounts Payable Dashboard Demonstration PDF
Presenting this set of slides with name bpo managing enterprise financial transactions accounts payable dashboard demonstration pdf. The topics discussed in these slide is accounts payable dashboard. This is a completely editable PowerPoint presentation and is available for immediate download. Download now and impress your audience.

BPO Managing Enterprise Financial Transactions Accounts Receivable Dashboard Professional PDF
Presenting this set of slides with name bpo managing enterprise financial transactions accounts receivable dashboard professional pdf. The topics discussed in these slide is accounts receivable dashboard. This is a completely editable PowerPoint presentation and is available for immediate download. Download now and impress your audience.
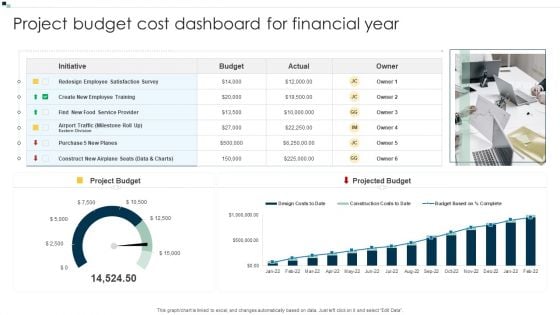
Project Budget Cost Dashboard For Financial Year Ideas PDF
Pitch your topic with ease and precision using this Project Budget Cost Dashboard For Financial Year Ideas PDF. This layout presents information on Budget, Service Provider, Redesign Employee. It is also available for immediate download and adjustment. So, changes can be made in the color, design, graphics or any other component to create a unique layout.
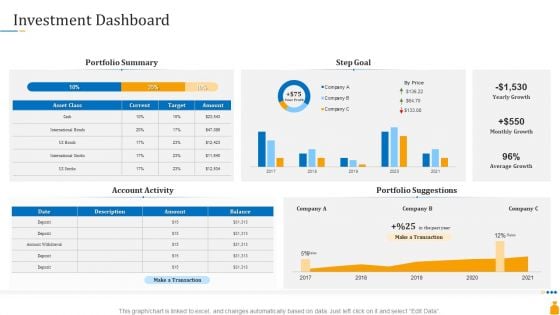
Financial Banking PPT Investment Dashboard Ppt Layouts Example Introduction PDF
Deliver an awe-inspiring pitch with this creative financial banking ppt investment dashboard ppt layouts example introduction pdf bundle. Topics like portfolio summary, account activity, portfolio suggestions, goal can be discussed with this completely editable template. It is available for immediate download depending on the needs and requirements of the user.
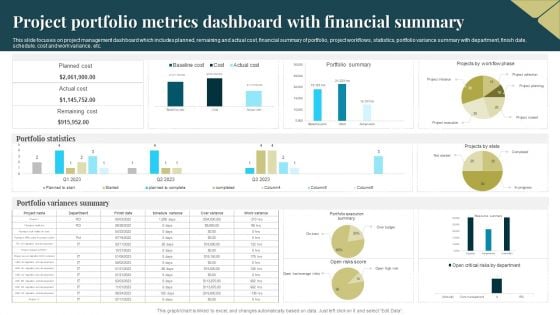
Project Portfolio Metrics Dashboard With Financial Summary Demonstration PDF
This slide focuses on project management dashboard which includes planned, remaining and actual cost, financial summary of portfolio, project workflows, statistics, portfolio variance summary with department, finish date, schedule, cost and work variance, etc. Showcasing this set of slides titled Project Portfolio Metrics Dashboard With Financial Summary Demonstration PDF. The topics addressed in these templates are Planned Cost, Portfolio Statistics, Portfolio Variances Summary. All the content presented in this PPT design is completely editable. Download it and make adjustments in color, background, font etc. as per your unique business setting.
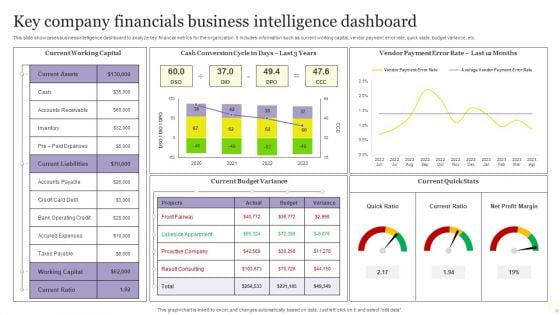
Key Company Financials Business Intelligence Dashboard Graphics PDF
This slide showcases business intelligence dashboard to analyze key financial metrics for the organization. It includes information such as current working capital, vendor payment error rate, quick stats, budget variance, etc. Showcasing this set of slides titled Key Company Financials Business Intelligence Dashboard Graphics PDF. The topics addressed in these templates are Key Company Financials, Business Intelligence Dashboard. All the content presented in this PPT design is completely editable. Download it and make adjustments in color, background, font etc. as per your unique business setting.
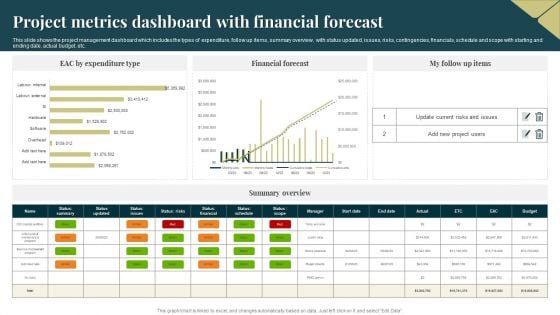
Project Metrics Dashboard With Financial Forecast Professional PDF
This slide shows the project management dashboard which includes the types of expenditure, follow up items, summary overview, with status updated, issues, risks, contingencies, financials, schedule and scope with starting and ending date, actual budget, etc. Showcasing this set of slides titled Project Metrics Dashboard With Financial Forecast Professional PDF. The topics addressed in these templates are Expenditure, Financial Forecast, Risks. All the content presented in this PPT design is completely editable. Download it and make adjustments in color, background, font etc. as per your unique business setting.
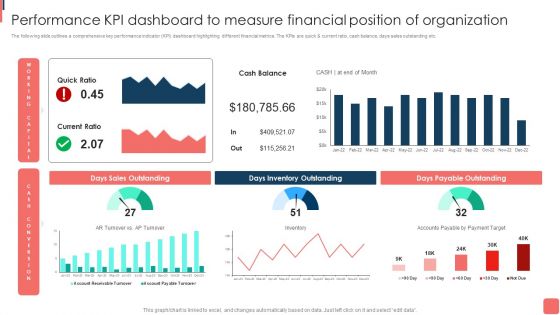
Effective Financial Planning Assessment Techniques Performance Kpi Dashboard To Measure Financial Graphics PDF
The following slide outlines a comprehensive key performance indicator KPI dashboard highlighting different financial metrics. The KPIs are quick and current ratio, cash balance, days sales outstanding etc. The best PPT templates are a great way to save time, energy, and resources. Slidegeeks have 100 precent editable powerpoint slides making them incredibly versatile. With these quality presentation templates, you can create a captivating and memorable presentation by combining visually appealing slides and effectively communicating your message. Download Effective Financial Planning Assessment Techniques Performance Kpi Dashboard To Measure Financial Graphics PDF from Slidegeeks and deliver a wonderful presentation.

 Home
Home