Financial Graphs
Dices On Financial Graph PowerPoint Icon F
Microsoft PowerPoint Template and Background with dices on financial graph Stitch together the fabric of your thoughts. Thread through with our Dices On Financial Graph PowerPoint Icon F.
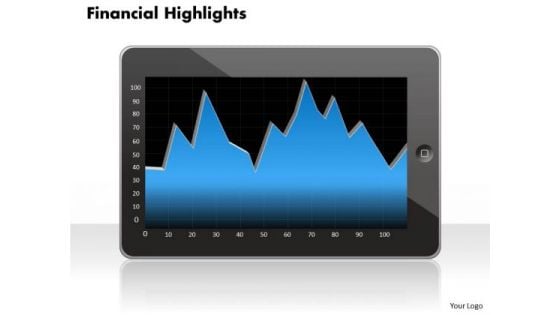
Business Framework Model Financial Graph Consulting Diagram
Document Your Views On Our Business Framework Model Financial Graph Consulting Diagram Powerpoint Templates. They Will Create A Strong Impression.
Dices On Financial Graph PowerPoint Icon C
Microsoft PowerPoint Template and Background with dices on financial graph Prescribe changes with our Dices On Financial Graph PowerPoint Icon C. Download without worries with our money back guaranteee.

Financial Graph PowerPoint Backgrounds And Templates 0111
Microsoft PowerPoint Template and Background with 3d rendered rainbow colored financial graph showing strong growth Be the architect of your own destiny. Design it with our Financial Graph PowerPoint Backgrounds And Templates 0111.
Dices On Financial Graph PowerPoint Icon Cc
Microsoft PowerPoint Template and Background with dices on financial graph Give your presentations a great look with our Dices On Financial Graph PowerPoint Icon Cc. You will be at the top of your game.
Dices On Financial Graph PowerPoint Icon R
Microsoft PowerPoint Template and Background with dices on financial graph Demonstrate your work ethic with our Dices On Financial Graph PowerPoint Icon R. Give credence to your impeccable reputation.
Dices On Financial Graph PowerPoint Icon S
Microsoft PowerPoint Template and Background with dices on financial graph Our Dices On Financial Graph PowerPoint Icon S project your erudite nature. They bring your depth of knowledge to the surface.

Financial Graph Ppt PowerPoint Presentation Visuals
This is a financial graph ppt powerpoint presentation visuals. This is a three stage process. The stages in this process are finance, marketing, analysis, investment, million.
Business Strategy Execution 3d Man With Financial Graphs Concepts
Plan For All Contingencies With Our Business Strategy Execution 3D Man With Financial Graphs Concepts Powerpoint Templates. Douse The Fire Before It Catches.
Information Sheet Icon With Financial Graphs Download PDF
Persuade your audience using this information sheet icon with financial graphs download pdf. This PPT design covers three stages, thus making it a great tool to use. It also caters to a variety of topics including information sheet icon with financial graphs. Download this PPT design now to present a convincing pitch that not only emphasizes the topic but also showcases your presentation skills.
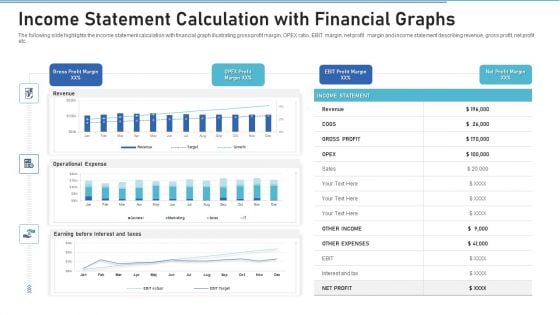
Income Statement Calculation With Financial Graphs Pictures PDF
Showcasing this set of slides titled income statement calculation with financial graphs pictures pdf. The topics addressed in these templates are revenue, gross profit, expenses. All the content presented in this PPT design is completely editable. Download it and make adjustments in color, background, font etc. as per your unique business setting.
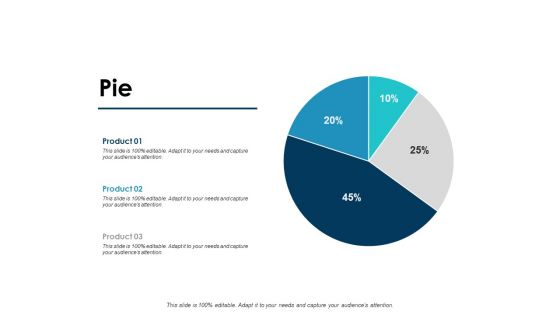
Pie Financial Graph Ppt PowerPoint Presentation Model Gridlines
This is a pie financial graph ppt powerpoint presentation model gridlines. This is a three stage process. The stages in this process are finance, marketing, management, investment, analysis.
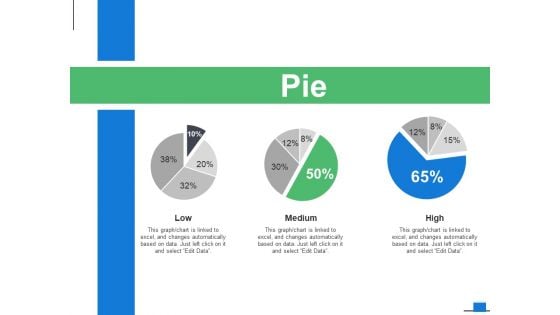
Pie Financial Graph Ppt PowerPoint Presentation Gallery Gridlines
This is a pie financial graph ppt powerpoint presentation gallery gridlines. This is a three stage process. The stages in this process are finance, marketing, management, investment, analysis.
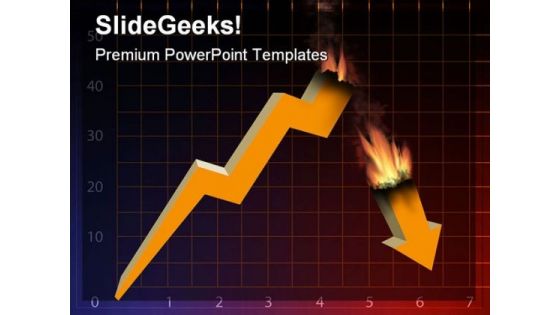
Financial Graph Finance PowerPoint Templates And PowerPoint Backgrounds 0511
Microsoft PowerPoint Template and Background with under the influence of world financial crisis Recieve adulatory feedback with our Financial Graph Finance PowerPoint Templates And PowerPoint Backgrounds 0511. The audience will give an enthusiastic response.
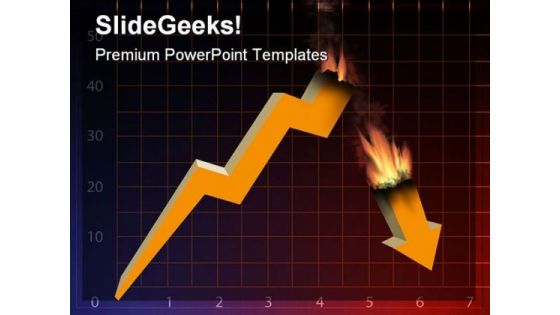
Financial Graph Finance PowerPoint Themes And PowerPoint Slides 0511
Microsoft PowerPoint Slide and Theme with under the influence of world financial crisis Our Financial Graph Finance PowerPoint Themes And PowerPoint Slides 0511 have more than what meets the eye. They contain additional dimensions.
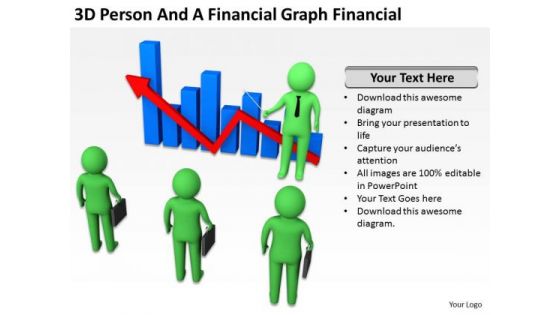
Young Business People 3d Person And Financial Graph PowerPoint Templates
We present our young business people 3d person and financial graph PowerPoint templates.Use our Business PowerPoint Templates because Our PowerPoint Templates and Slides will embellish your thoughts. See them provide the desired motivation to your team. Use our Teamwork PowerPoint Templates because Timeline crunches are a fact of life. Meet all deadlines using our PowerPoint Templates and Slides. Present our Leadership PowerPoint Templates because Our PowerPoint Templates and Slides will bullet point your ideas. See them fall into place one by one. Download and present our Success PowerPoint Templates because Our PowerPoint Templates and Slides are aesthetically designed to attract attention. We gaurantee that they will grab all the eyeballs you need. Download our Process and Flows PowerPoint Templates because Our PowerPoint Templates and Slides are designed to help you succeed. They have all the ingredients you need.Use these PowerPoint slides for presentations relating to 3d, business, businessmen, career, char, character, coaction, community,concept, contact, cooperation, equality, figure, financial, friend, friendship, grafic,graphic, group, growing, growth, guy, handshake, help, human, humorous, icon,idea, leader, leadership, meeting, men, occupation, partner, people, person, play,profit, puppet, team, teamwork, tie, together, unity, white. The prominent colors used in the PowerPoint template are Green, Red, Blue . Exhibit your charisma with our Young Business People 3d Person And Financial Graph PowerPoint Templates. They will add to your ample charm.
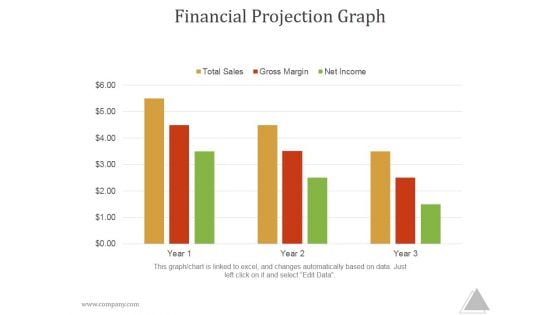
Financial Projection Graph Ppt PowerPoint Presentation Introduction
This is a financial projection graph ppt powerpoint presentation introduction. This is a five stage process. The stages in this process are jan, feb ,mar, apr, may, jun.
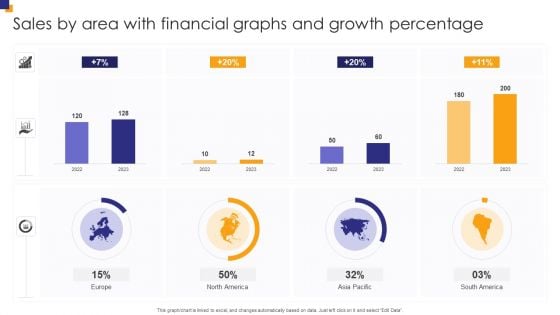
Sales By Area With Financial Graphs And Growth Percentage Inspiration PDF
Pitch your topic with ease and precision using this Sales By Area With Financial Graphs And Growth Percentage Inspiration PDF. This layout presents information on Sales Area, Financial Graphs, Growth Percentage. It is also available for immediate download and adjustment. So, changes can be made in the color, design, graphics or any other component to create a unique layout.
Business Report With Financial Graphs Vector Icon Ppt PowerPoint Presentation File Graphics Example PDF
Presenting this set of slides with name business report with financial graphs vector icon ppt powerpoint presentation file graphics example pdf. This is a three stage process. The stages in this process are business report with financial graphs vector icon. This is a completely editable PowerPoint presentation and is available for immediate download. Download now and impress your audience.

Dices On Financial Graph Business PowerPoint Templates And PowerPoint Backgrounds 0511
Microsoft PowerPoint Template and Background with dices on financial graph Enliven the discussion with our Dices On Financial Graph Business PowerPoint Templates And PowerPoint Backgrounds 0511. The audience will get all animated.

Dices On Financial Graph Business PowerPoint Themes And PowerPoint Slides 0511
Microsoft PowerPoint Theme and Slide with dices on financial graph Our Dices On Financial Graph Business PowerPoint Themes And PowerPoint Slides 0511 will entice the audience. They will make a beeline for you.
Financial Planning Graphs For Investment Details Vector Icon Diagrams PDF
Presenting financial planning graphs for investment details vector icon diagrams pdf to dispense important information. This template comprises three stages. It also presents valuable insights into the topics including financial planning graphs for investment details vector icon. This is a completely customizable PowerPoint theme that can be put to use immediately. So, download it and address the topic impactfully.
Financial Graph For Urban Population Growth With Prediction Figures Icons PDF
Showcasing this set of slides titled financial graph for urban population growth with prediction figures icons pdf. The topics addressed in these templates are financial graph for urban population growth with prediction figures. All the content presented in this PPT design is completely editable. Download it and make adjustments in color, background, font etc. as per your unique business setting.
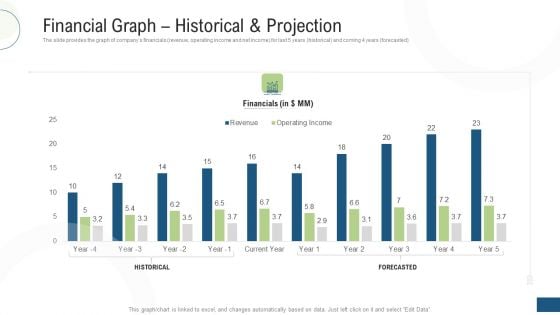
Investor Pitch Deck Fundraising Via Mezzanine Equity Instrument Financial Graph Historical And Projection Formats PDF
The slide provides the graph of companys financials revenue, operating income and net income for last 5 years historical and coming 4 years forecasted. Deliver and pitch your topic in the best possible manner with this investor pitch deck fundraising via mezzanine equity instrument financial graph historical and projection formats pdf. Use them to share invaluable insights on financial graph historical and projection and impress your audience. This template can be altered and modified as per your expectations. So, grab it now.
Financial Graph Economic Growth Vector Icon Ppt PowerPoint Presentation Infographics Graphic Images Cpb
This is a financial graph economic growth vector icon ppt powerpoint presentation infographics graphic images cpb. This is a three stage process. The stages in this process are bar chart icon, bar graph icon, data chart icon.

Hold The Financial Graph Of Company PowerPoint Templates Ppt Backgrounds For Slides 0713
Create your domain with our Hold The Financial Graph Of Company PowerPoint Templates PPT Backgrounds For Slides. Rule minds with your thoughts. Get the domestics right with our finance PowerPoint Templates. Create the base for thoughts to grow. Do away with dogmatic approaches. Establish the value of reason with our business PowerPoint Templates. Show direct & decisive organizational leadership with our Hold The Financial Graph Of Company PowerPoint Templates Ppt Backgrounds For Slides 0713. They will make you look good.
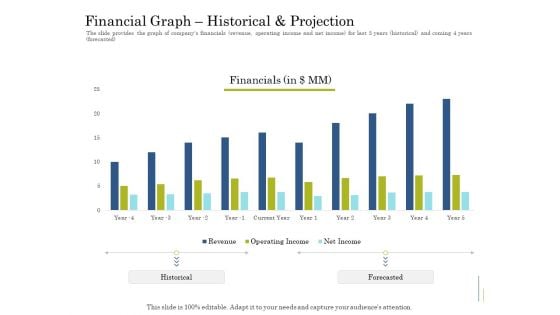
Supplementary Debt Financing Pitch Deck Financial Graph Historical And Projection Brochure PDF
Deliver an awe inspiring pitch with this creative supplementary debt financing pitch deck financial graph historical and projection brochure pdf bundle. Topics like financial, revenue, operating income, net income can be discussed with this completely editable template. It is available for immediate download depending on the needs and requirements of the user.
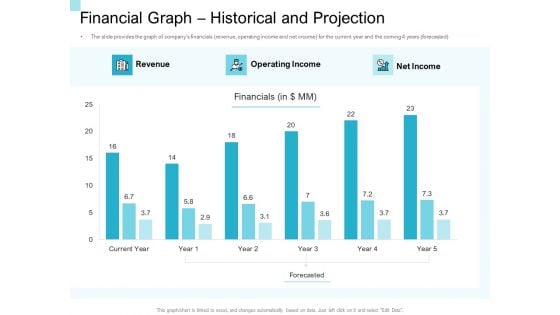
Convertible Market Notes Financial Graph Historical And Projection Ppt Summary Show PDF
Deliver an awe inspiring pitch with this creative convertible market notes financial graph historical and projection ppt summary show pdf bundle. Topics like revenue, operating income, net income, financial can be discussed with this completely editable template. It is available for immediate download depending on the needs and requirements of the user.
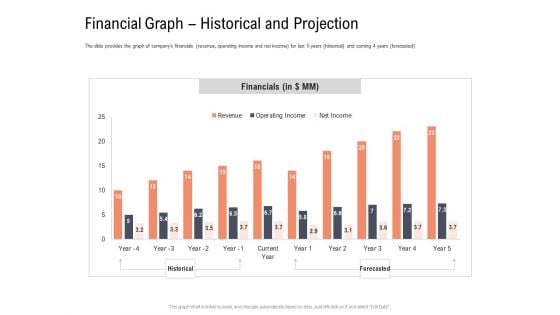
Investor Pitch Deck To Collect Capital From Subordinated Loan Financial Graph Historical And Projection Introduction PDF
The slide provides the graph of companys financials revenue, operating income and net income for last 5 years historical and coming 4 years forecasted. Deliver an awe-inspiring pitch with this creative investor pitch deck to collect capital from subordinated loan financial graph historical and projection introduction pdf bundle. Topics like financials, net income, operating income, revenue, historical, forecasted can be discussed with this completely editable template. It is available for immediate download depending on the needs and requirements of the user.
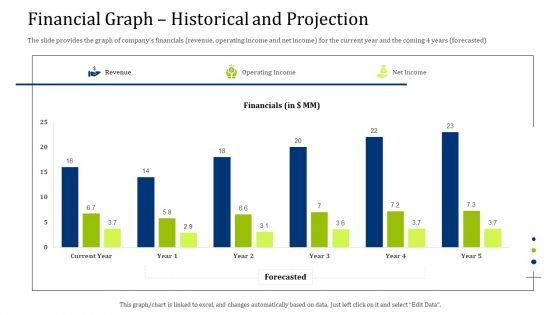
Convertible Debt Financing Pitch Deck Financial Graph Historical And Projection Clipart PDF
Deliver an awe-inspiring pitch with this creative convertible debt financing pitch deck financial graph historical and projection clipart pdf bundle. Topics like revenue, operating income, net income can be discussed with this completely editable template. It is available for immediate download depending on the needs and requirements of the user.
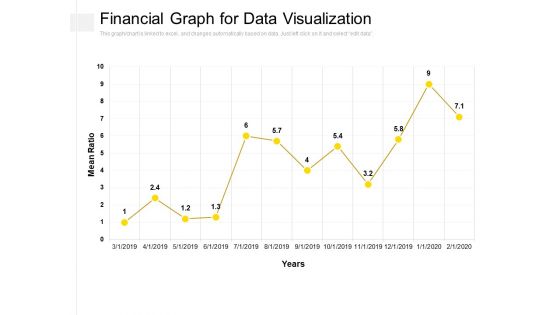
Financial Graph For Data Visualization Ppt PowerPoint Presentation Slides Picture PDF
Presenting this set of slides with name financial graph for data visualization ppt powerpoint presentation slides picture pdf. The topics discussed in these slides are mean ration, year. This is a completely editable PowerPoint presentation and is available for immediate download. Download now and impress your audience.
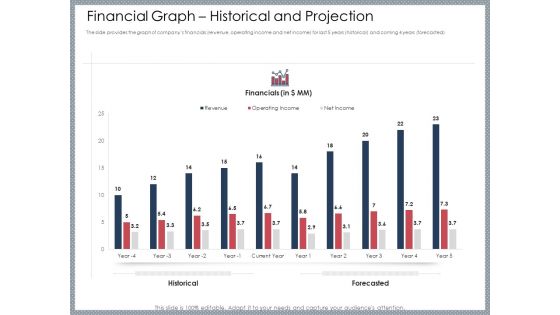
Mezzanine Venture Capital Funding Pitch Deck Financial Graph Historical And Projection Pictures PDF
The slide provides the graph of companys financials revenue operating income and net income for last five years historical and coming four years forecasted. Deliver and pitch your topic in the best possible manner with this mezzanine venture capital funding pitch deck financial graph historical and projection pictures pdf. Use them to share invaluable insights on financial, historical, projection, year, revenue and impress your audience. This template can be altered and modified as per your expectations. So, grab it now.
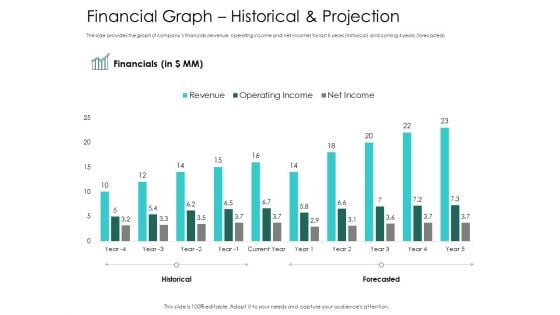
Hybrid Investment Pitch Deck Financial Graph Historical And Projection Ppt Portfolio Design Inspiration PDF
The slide provides the graph of companys financials revenue, operating income and net income for last 5 years historical and coming 4 years forecasted. Deliver an awe inspiring pitch with this creative hybrid investment pitch deck financial graph historical and projection ppt portfolio design inspiration pdf bundle. Topics like financial, revenue, operating income, net income can be discussed with this completely editable template. It is available for immediate download depending on the needs and requirements of the user.
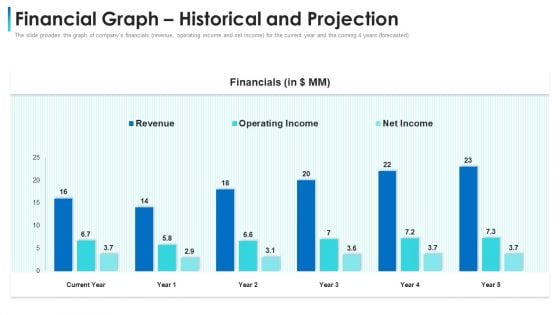
Convertible Bond Financing Pitch Deck Financial Graph Historical And Projection Slides PDF
The slide provides the graph of companys financials revenue, operating income and net income for the current year and the coming 4 years forecasted. Deliver an awe-inspiring pitch with this creative convertible bond financing pitch deck financial graph historical and projection slides pdf bundle. Topics like revenue, operating income, net income, financial can be discussed with this completely editable template. It is available for immediate download depending on the needs and requirements of the user.
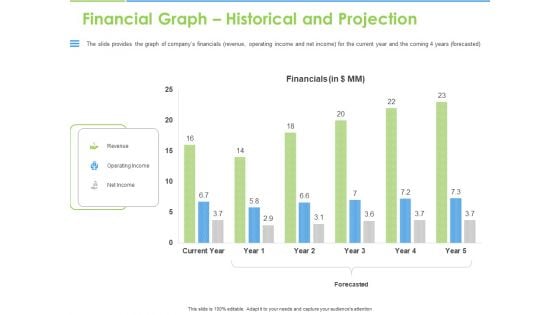
Convertible Bonds Pitch Deck For Increasing Capitals Financial Graph Historical And Projection Elements PDF
The slide provides the graph of companys financials revenue, operating income and net income for the current year and the coming 4 years forecasted. Deliver an awe-inspiring pitch with this creative convertible bonds pitch deck for increasing capitals financial graph historical and projection elements pdf bundle. Topics like revenue, operating income, net income, forecasted, financials, current year can be discussed with this completely editable template. It is available for immediate download depending on the needs and requirements of the user.
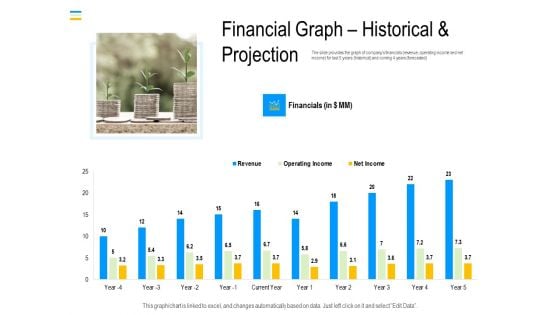
Mezzanine Debt Financing Pitch Deck Financial Graph Historical And Projection Demonstration PDF
The slide provides the graph of companys financials revenue, operating income and net income for last five years historical and coming four years forecasted. Deliver and pitch your topic in the best possible manner with this mezzanine debt financing pitch deck financial graph historical and projection demonstration pdf. Use them to share invaluable insights on financials, revenue, operating income and impress your audience. This template can be altered and modified as per your expectations. So, grab it now.
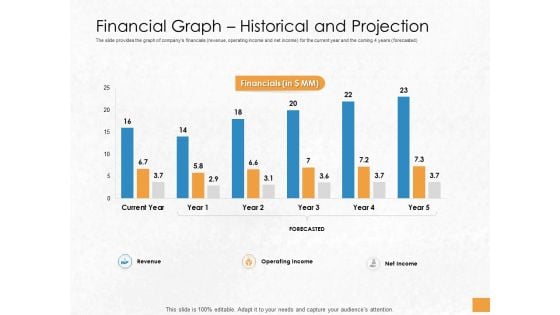
Convertible Debenture Funding Financial Graph Historical And Projection Ppt Professional Themes PDF
The slide provides the graph of companys financials revenue, operating income and net income for the current year and the coming 4 years forecasted. Deliver an awe-inspiring pitch with this creative convertible debenture funding financial graph historical and projection ppt professional themes pdf bundle. Topics like revenue, operating income, net income, forecasted, financials, current year can be discussed with this completely editable template. It is available for immediate download depending on the needs and requirements of the user.
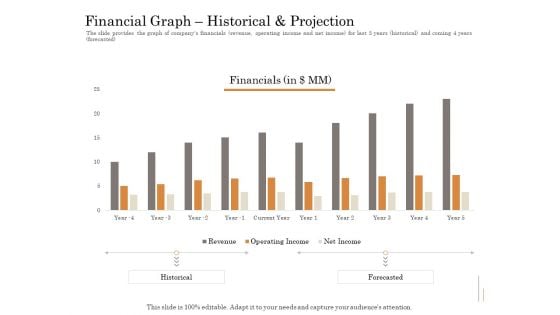
Subordinated Loan Funding Financial Graph Historical And Projection Ppt Model File Formats PDF
The slide provides the graph of companys financials revenue, operating income and net income for last 5 years historical and coming 4 years forecasted. Deliver and pitch your topic in the best possible manner with this subordinated loan funding financial graph historical and projection ppt model file formats pdf. Use them to share invaluable insights on revenue, operating income, net income, current year. and impress your audience. This template can be altered and modified as per your expectations. So, grab it now.
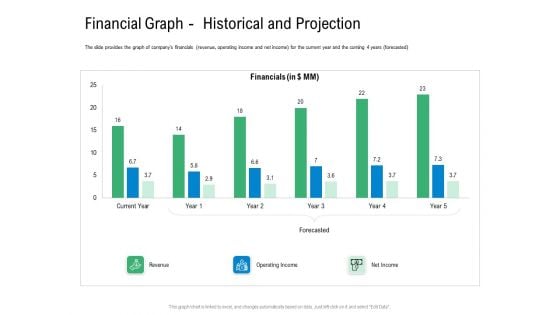
Convertible Preferred Stock Funding Pitch Deck Financial Graph Historical And Projection Themes PDF
The slide provides the graph of companys financials revenue, operating income and net income for the current year and the coming 4 years forecasted. Deliver an awe inspiring pitch with this creative convertible preferred stock funding pitch deck financial graph historical and projection themes pdf bundle. Topics like revenue, operating income, net income can be discussed with this completely editable template. It is available for immediate download depending on the needs and requirements of the user.
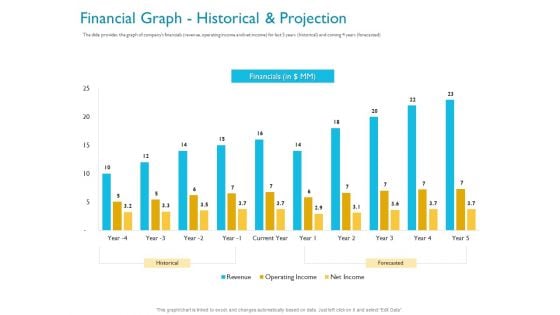
Investor Funding Deck For Hybrid Financing Financial Graph Historical And Projection Ppt Layouts Slides PDF
The slide provides the graph of companys financials revenue, operating income and net income for last 5 years historical and coming 4 years forecasted. Deliver and pitch your topic in the best possible manner with this investor funding deck for hybrid financing financial graph historical and projection ppt layouts slides pdf. Use them to share invaluable insights on historical, forecasted, net income, operating income, financial and impress your audience. This template can be altered and modified as per your expectations. So, grab it now.
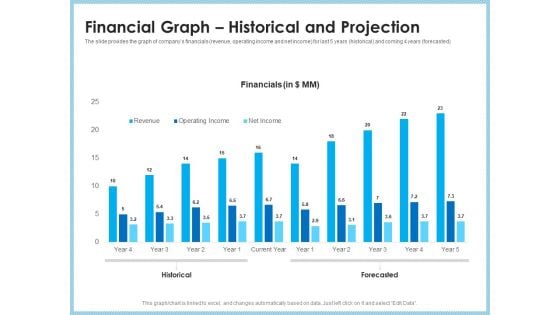
Investment Pitch To Generating Capital From Mezzanine Credit Financial Graph Historical And Projection Microsoft PDF
The slide provides the graph of companys financials revenue, operating income and net income for last 5 years historical and coming 4 years forecasted. Deliver and pitch your topic in the best possible manner with this investment pitch to generating capital from mezzanine credit financial graph historical and projection microsoft pdf. Use them to share invaluable insights on revenue, operating income, net income, current year, historical, forecasted and impress your audience. This template can be altered and modified as per your expectations. So, grab it now.
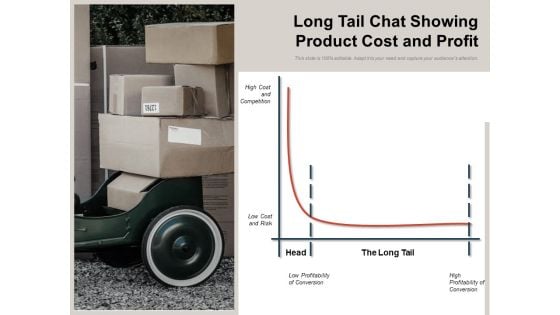
Financial Graph Showing Profit Volume Analysis Ppt PowerPoint Presentation Model Master Slide PDF
Presenting this set of slides with name financial graph showing profit volume analysis ppt powerpoint presentation model master slide pdf. The topics discussed in these slides are high cost and competition, low cost and risk, head, the long tail, high profitability of conversion, low profitability of conversion. This is a completely editable PowerPoint presentation and is available for immediate download. Download now and impress your audience.

Piggy Bank Financial Graph Concept PowerPoint Templates Ppt Backgrounds For Slides 0213
We present our Piggy Bank Financial Graph Concept PowerPoint Templates PPT Backgrounds For Slides 0213.Download our Marketing PowerPoint Templates because Your success is our commitment. Our PowerPoint Templates and Slides will ensure you reach your goal. Download and present our Finance PowerPoint Templates because Our PowerPoint Templates and Slides will let you Clearly mark the path for others to follow. Download our Money PowerPoint Templates because Our PowerPoint Templates and Slides are truly out of this world. Even the MIB duo has been keeping tabs on our team. Download our Business PowerPoint Templates because You can Be the puppeteer with our PowerPoint Templates and Slides as your strings. Lead your team through the steps of your script. Download our Shapes PowerPoint Templates because You can Create a matrix with our PowerPoint Templates and Slides. Feel the strength of your ideas click into place.Use these PowerPoint slides for presentations relating to piggy graph, finance, money, marketing, business, shapes. The prominent colors used in the PowerPoint template are Green, Orange, Red. Exert some pressure with our Piggy Bank Financial Graph Concept PowerPoint Templates Ppt Backgrounds For Slides 0213. Get the decision in your favour.
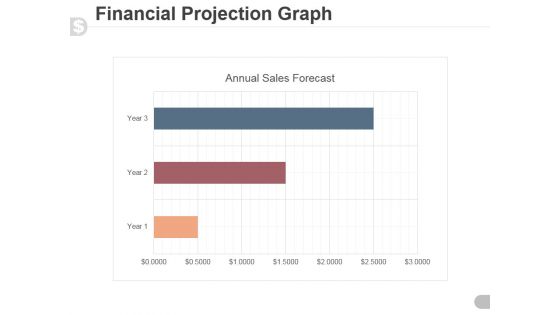
Financial Projection Graph Template 2 Ppt PowerPoint Presentation Samples
This is a financial projection graph template 2 ppt powerpoint presentation samples. This is a three stage process. The stages in this process are annual sales forecast, timeline, marketing, graph, management.

Financial Projection Graph Template 1 Ppt PowerPoint Presentation Guide
This is a financial projection graph template 1 ppt powerpoint presentation guide. This is a three stage process. The stages in this process are annual sales, gross margin, net profit.
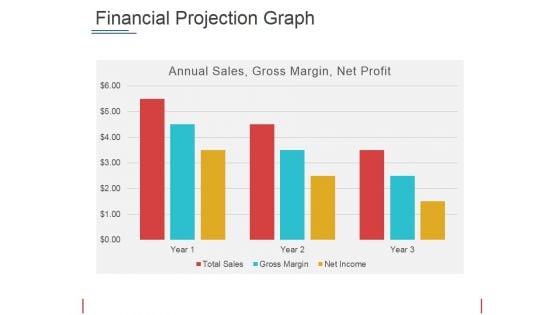
Financial Projection Graph Template 2 Ppt PowerPoint Presentation Show Picture
This is a financial projection graph template 2 ppt powerpoint presentation show picture. This is a three stage process. The stages in this process are annual sales, gross margin, net profit, years.
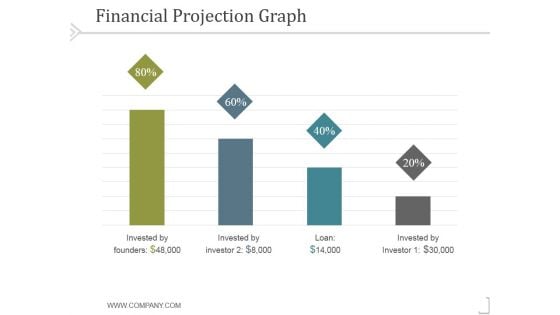
Financial Projection Graph Template 1 Ppt PowerPoint Presentation Model
This is a financial projection graph template 1 ppt powerpoint presentation model. This is a four stage process. The stages in this process are business, strategy, marketing, success, analysis.
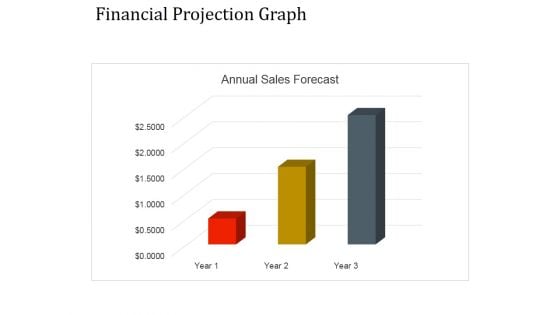
Financial Projection Graph Template 1 Ppt PowerPoint Presentation Graphics
This is a financial projection graph template 1 ppt powerpoint presentation graphics. This is a three stage process. The stages in this process are annual sales, business, management, marketing, strategy.
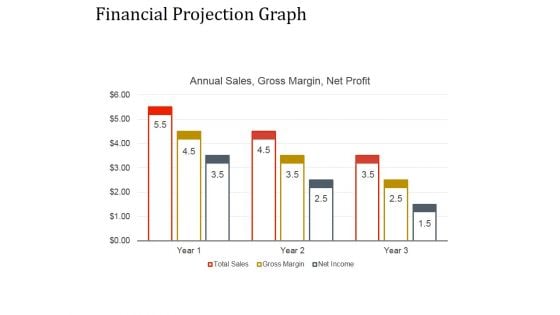
Financial Projection Graph Template 2 Ppt PowerPoint Presentation Ideas
This is a financial projection graph template 2 ppt powerpoint presentation ideas. This is a nine stage process. The stages in this process are annual sales, business, management, marketing, strategy.
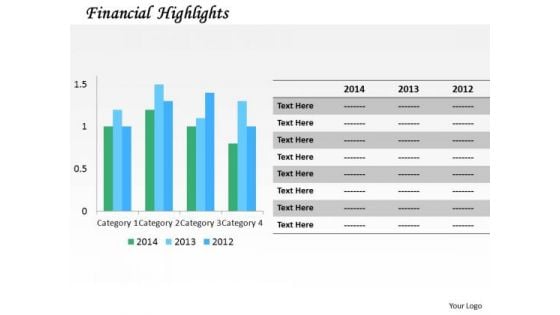
Consulting Diagram Annual Financial Growth Graph Strategic Management
Analyze Ailments On Our Consulting Diagram Annual Financial Growth Graph Strategic Management Powerpoint Templates. Bring Out The Thinking Doctor In You. Dock Your Thoughts With Our Consulting Diagram Annual Financial Growth Graph Strategic Management Powerpoint Templates. They Will Launch Them Into Orbit.
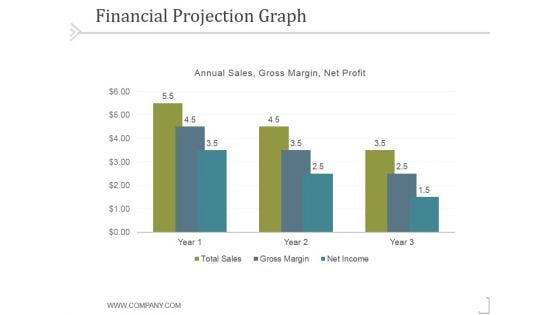
Financial Projection Graph Template 2 Ppt PowerPoint Presentation Template
This is a financial projection graph template 2 ppt powerpoint presentation template. This is a three stage process. The stages in this process are business, strategy, marketing, success, analysis.
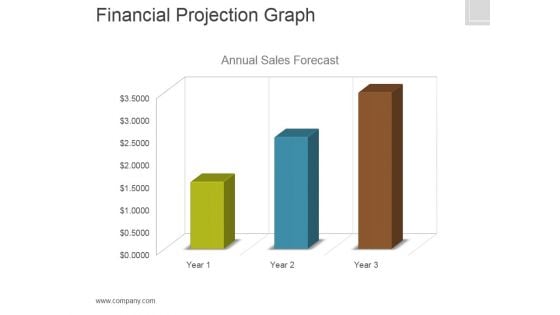
Financial Projection Graph Template 1 Ppt PowerPoint Presentation Clipart
This is a financial projection graph template 1 ppt powerpoint presentation clipart. This is a three stage process. The stages in this process are annual, sales, forecast, finance, marketing.
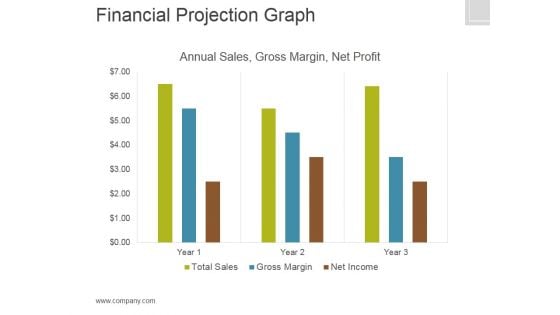
Financial Projection Graph Template 2 Ppt PowerPoint Presentation Graphics
This is a financial projection graph template 2 ppt powerpoint presentation graphics. This is a three stage process. The stages in this process are annual sales, gross margin, net profit, finance.
Financial Growth Graph Vector Icon Ppt PowerPoint Presentation Summary Shapes
Presenting this set of slides with name financial growth graph vector icon ppt powerpoint presentation summary shapes. This is a three stage process. The stages in this process are financial growth graph vector icon. This is a completely editable PowerPoint presentation and is available for immediate download. Download now and impress your audience.
Financial Projection Graph Template 1 Ppt PowerPoint Presentation Icon Summary
This is a financial projection graph template 1 ppt powerpoint presentation icon summary. This is a three stage process. The stages in this process are annual sales forecast, years, business, marketing, management.
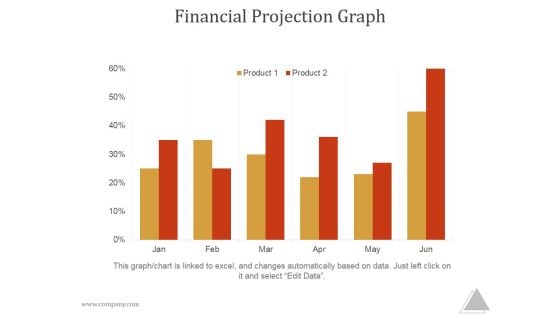
Financial Projection Graph Slide2 Ppt PowerPoint Presentation Themes
This is a financial projection graph slide2 ppt powerpoint presentation themes. This is a five stage process. The stages in this process are year, total sales, gross, margin, net income
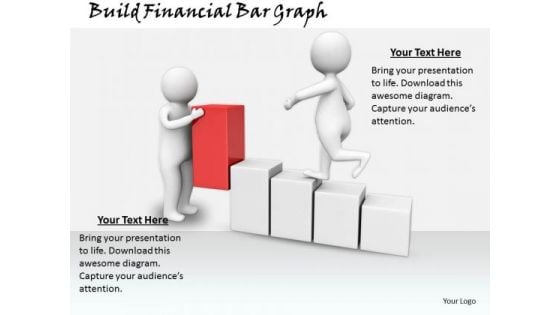
Total Marketing Concepts Build Financial Bar Graph Business Statement
Drink To The Success Of Your Campaign. Our Total Marketing Concepts Build Financial Bar Graph Business Statement Powerpoint Templates Will Raise A Toast. Pass It Around On Our People Powerpoint Templates. Your Audience Will Lap It Up.
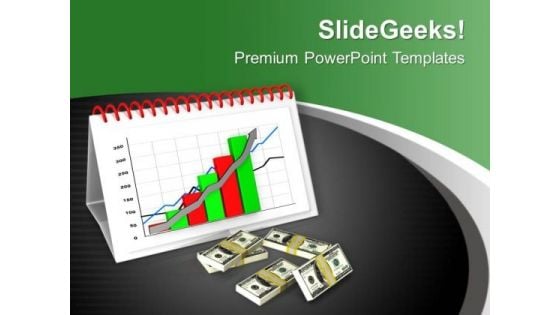
Financial Growth Graph PowerPoint Templates Ppt Backgrounds For Slides 0713
Motivate the disheartened with our Financial Growth Graph PowerPoint Templates PPT Backgrounds For Slides. Inspire them with the goodness in you. Discover decisive moments with our Arrows PowerPoint Templates. They help make that crucial difference. Our Money PowerPoint Templates will help make your dreams come true. Your thoughts will weave the magic for you. Satisfy enquiring minds with our Financial Growth Graph PowerPoint Templates Ppt Backgrounds For Slides 0713. They help you clarify every lingering doubt.
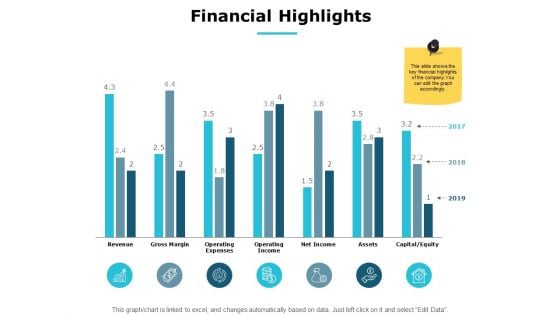
Financial Highlights Graph Ppt PowerPoint Presentation Ideas Good
Presenting this set of slides with name financial highlights graph ppt powerpoint presentation ideas good. This is a six stage process. The stages in this process are finance, marketing, management, investment, analysis. This is a completely editable PowerPoint presentation and is available for immediate download. Download now and impress your audience.
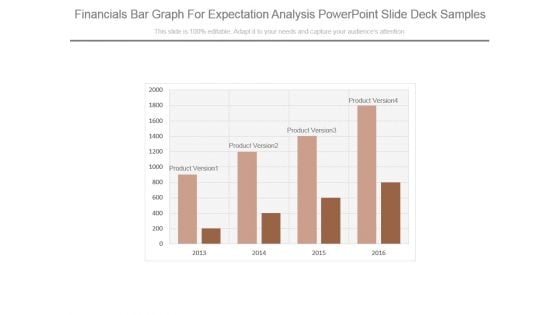
Financials Bar Graph For Expectation Analysis Powerpoint Slide Deck Samples
This is a financials bar graph for expectation analysis powerpoint slide deck samples. This is a four stage process. The stages in this process are product version.

 Home
Home