Financial Graphs
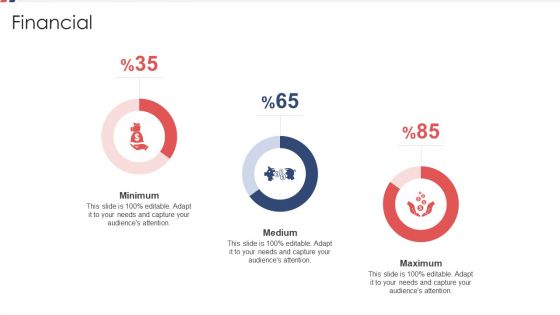
Financial Ppt Show Diagrams PDF
Deliver an awe inspiring pitch with this creative financial ppt show diagrams pdf bundle. Topics like minimum, medium, maximum can be discussed with this completely editable template. It is available for immediate download depending on the needs and requirements of the user.
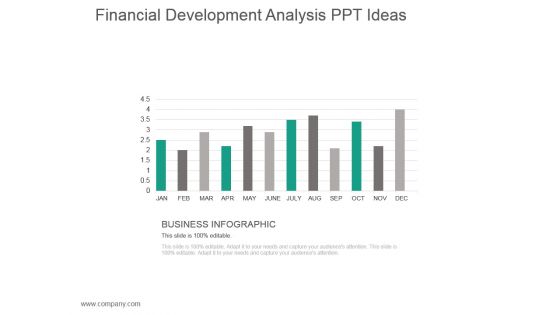
Financial Development Analysis Ppt Ideas
This is a financial development analysis ppt ideas. This is a twelve stage process. The stages in this process are business infographic.
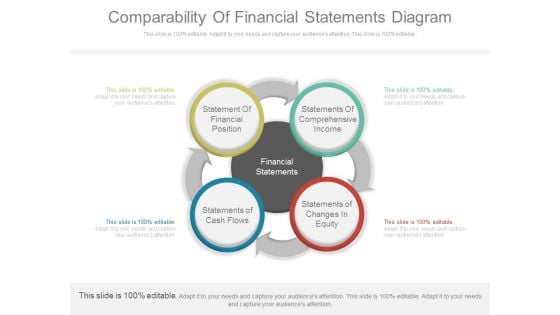
Comparability Of Financial Statements Diagram
This is a comparability of financial statements diagram. This is a four stage process. The stages in this process are statement of financial position, statements of comprehensive income, statements of cash flows, statements of changes in equity.
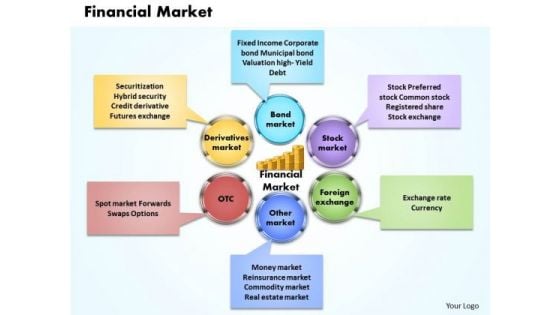
Financial Market Business PowerPoint Presentation
Discover Decisive Moments With Our Financial Market Business Powerpoint Presentation Powerpoint Templates. They Help Make That Crucial Difference.
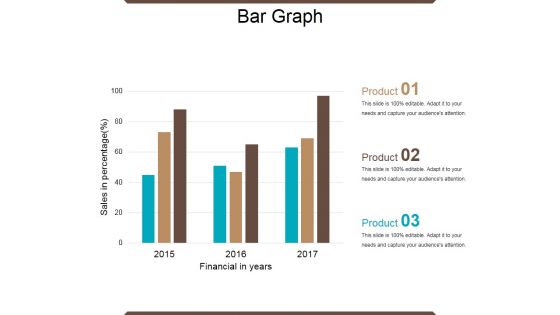
Bar Graph Ppt PowerPoint Presentation Ideas Graphic Tips
This is a bar graph ppt powerpoint presentation ideas graphic tips. This is a three stage process. The stages in this process are financial year, sales in percentage, product, bar graph, growth.
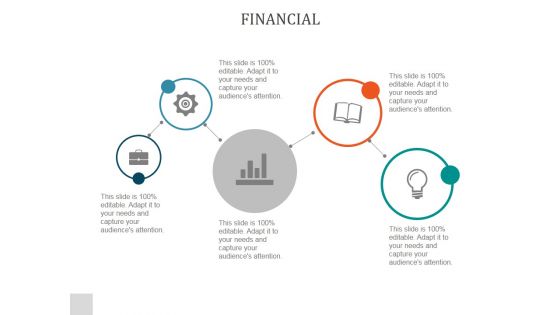
Financial Ppt PowerPoint Presentation Samples
This is a financial ppt powerpoint presentation samples. This is a six stage process. The stages in this process are business, finance, marketing, icons, strategy.
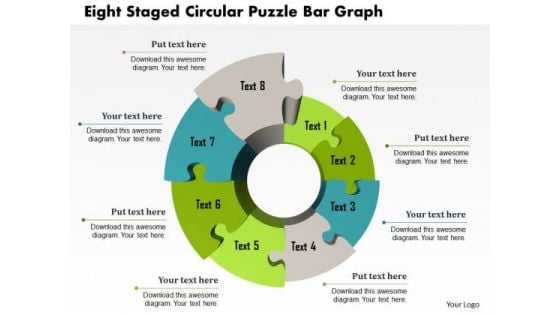
Business Diagram Eight Staged Circular Puzzle Bar Graph Presentation Template
This Power Point template has been crafted with graphic of eight staged circular puzzle and bar graph. This PPT contains the financial result analysis related concept. Use this PPT for your business and success related presentations.
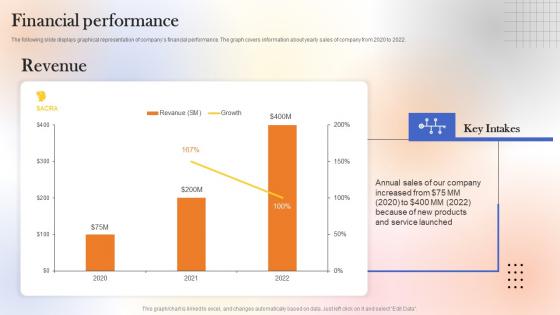
Financial Performance Web Designing Platform Fundraising Pitch Deck Download Pdf
The following slide displays graphical representation of companys financial performance. The graph covers information about yearly sales of company from 2020 to 2022. Do you have an important presentation coming up Are you looking for something that will make your presentation stand out from the rest Look no further than Financial Performance Web Designing Platform Fundraising Pitch Deck Download Pdf. With our professional designs, you can trust that your presentation will pop and make delivering it a smooth process. And with Slidegeeks, you can trust that your presentation will be unique and memorable. So why wait Grab Financial Performance Web Designing Platform Fundraising Pitch Deck Download Pdf today and make your presentation stand out from the rest The following slide displays graphical representation of companys financial performance. The graph covers information about yearly sales of company from 2020 to 2022.
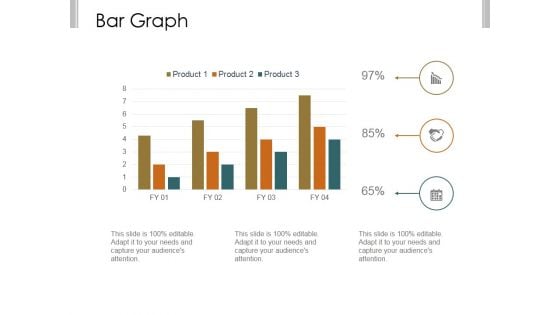
Bar Graph Ppt PowerPoint Presentation Examples
This is a bar graph ppt powerpoint presentation examples. This is a three stage process. The stages in this process are business, strategy, marketing, analysis, finance, bar graph.
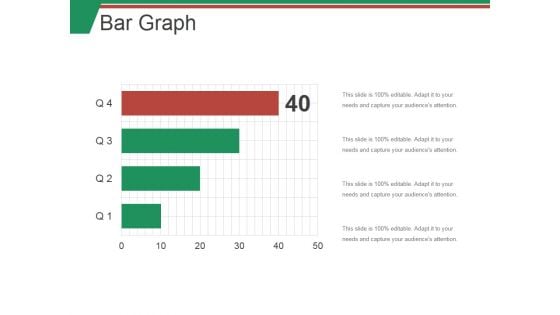
Bar Graph Ppt PowerPoint Presentation Outline Aids
This is a bar graph ppt powerpoint presentation outline aids. This is a four stage process. The stages in this process are bar, graph, finance, marketing, strategy.
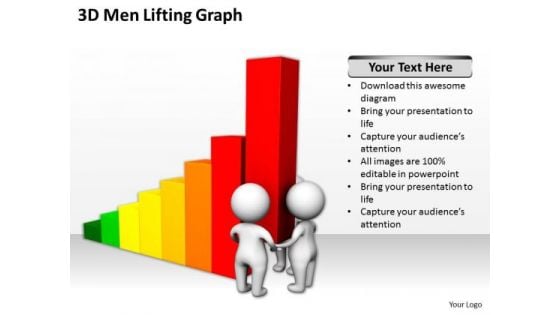
Successful Business Men 3d Lifting Graph PowerPoint Slides
We present our successful business men 3d lifting graph PowerPoint Slides.Download our Business PowerPoint Templates because Our PowerPoint Templates and Slides are aesthetically designed to attract attention. We gaurantee that they will grab all the eyeballs you need. Download and present our People PowerPoint Templates because Our PowerPoint Templates and Slides are created by a hardworking bunch of busybees. Always flitting around with solutions gauranteed to please. Present our Finance PowerPoint Templates because It is Aesthetically crafted by artistic young minds. Our PowerPoint Templates and Slides are designed to display your dexterity. Download our Success PowerPoint Templates because You can Connect the dots. Fan expectations as the whole picture emerges. Download and present our Marketing PowerPoint Templates because You are well armed with penetrative ideas. Our PowerPoint Templates and Slides will provide the gunpowder you need.Use these PowerPoint slides for presentations relating to 3d, abstract, accounting, achievement, advantage, bar, bar graph, bar-chart, bar-graph, business, cartoon, chart, company, concept, corporate, financial, graph, growth, help, icon, idiom, lifting, lifting the bar, market, meeting, men, metaphor, partnership, people, performance, presentation, progress, report, strength, team, teamwork. The prominent colors used in the PowerPoint template are Red, Yellow, Green. Position yourself with our Successful Business Men 3d Lifting Graph PowerPoint Slides. Download without worries with our money back guaranteee.
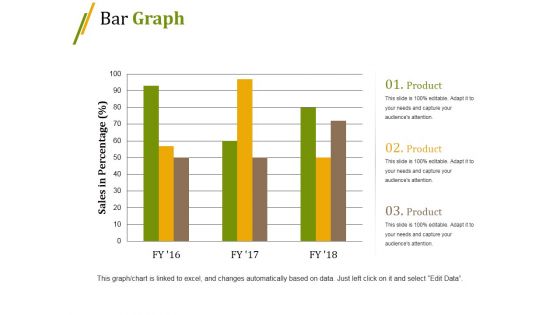
Bar Graph Ppt PowerPoint Presentation Professional Gridlines
This is a bar graph ppt powerpoint presentation professional gridlines. This is a three stage process. The stages in this process are bar, marketing, strategy, planning, growth.
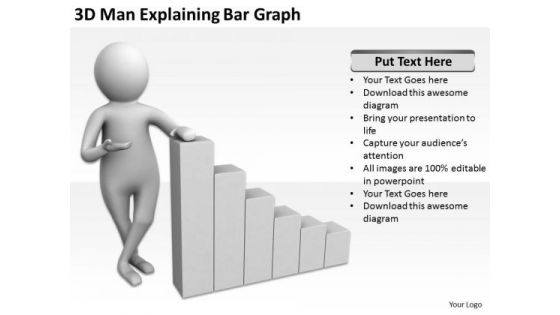
Business People Walking 3d Man Explaining Bar Graph PowerPoint Templates
We present our business people walking 3d man explaining bar graph PowerPoint templates.Use our Finance PowerPoint Templates because Our PowerPoint Templates and Slides are Clear and concise. Use them and dispel any doubts your team may have. Download our Success PowerPoint Templates because Our PowerPoint Templates and Slides has conjured up a web of all you need with the help of our great team. Use them to string together your glistening ideas. Download our Business PowerPoint Templates because You are working at that stage with an air of royalty. Let our PowerPoint Templates and Slides be the jewels in your crown. Download and present our Sales PowerPoint Templates because Our PowerPoint Templates and Slides will bullet point your ideas. See them fall into place one by one. Use our Shapes PowerPoint Templates because Our PowerPoint Templates and Slides are specially created by a professional team with vast experience. They diligently strive to come up with the right vehicle for your brilliant Ideas. Use these PowerPoint slides for presentations relating to 3d, Accounting, Activity, Analysis, Analyst, Analytics, Background, Bar, Business, Businessman, Chart, Concept, Corporate, Diagram, Earn, Economy, Finance, Financial, Graph, Graphic, Grow, Growth, Illustration, Income, Investing, Investment, Isolated, Man, Manager, Market, Moving, People, Person, Profit, Progress, Prosperity, Red, Sales, Statistic, Stats, Strategy, Succeed, Success. The prominent colors used in the PowerPoint template are White, Gray, Black. Engineer growth with our Business People Walking 3d Man Explaining Bar Graph PowerPoint Templates. Download without worries with our money back guaranteee.
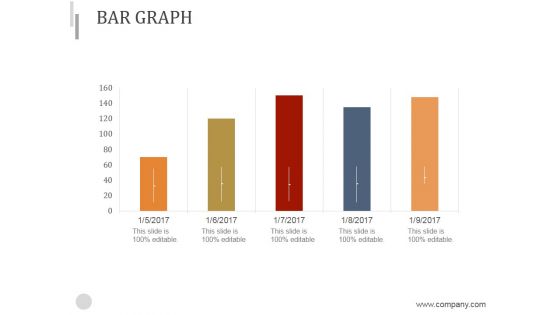
Bar Graph Ppt PowerPoint Presentation Styles
This is a bar graph ppt powerpoint presentation styles. This is a five stage process. The stages in this process are bar graph, business, marketing, strategy, growth.
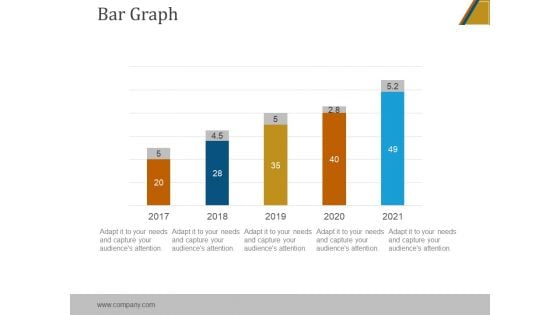
Bar Graph Ppt PowerPoint Presentation Designs
This is a bar graph ppt powerpoint presentation designs. This is a five stage process. The stages in this process are bar graph, marketing, analysis, strategy, business.
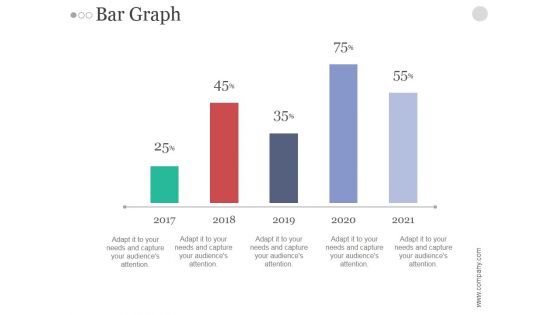
Bar Graph Ppt PowerPoint Presentation Portfolio
This is a bar graph ppt powerpoint presentation portfolio. This is a five stage process. The stages in this process are bar graph, marketing, analysis, finance, business, investment.
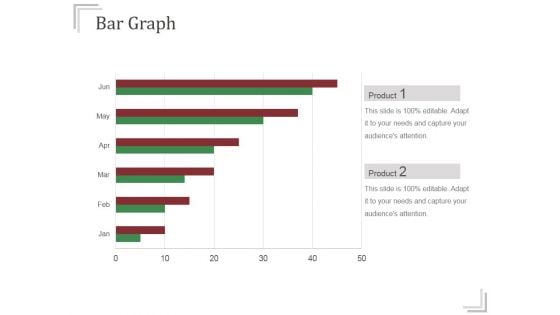
Bar Graph Ppt PowerPoint Presentation Slide
This is a bar graph ppt powerpoint presentation slide. This is a six stage process. The stages in this process are bar graph, analysis, marketing, strategy, business, finance.
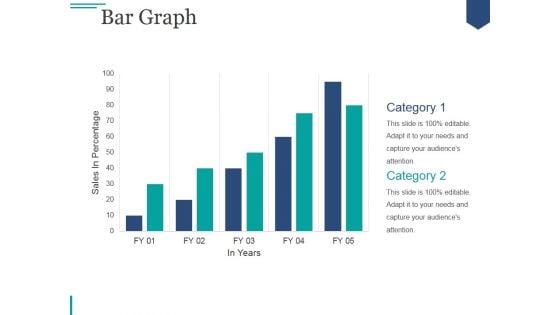
Bar Graph Ppt PowerPoint Presentation Slides Format
This is a bar graph ppt powerpoint presentation slides format. This is a two stage process. The stages in this process are business, marketing, growth, planning, sales plan.
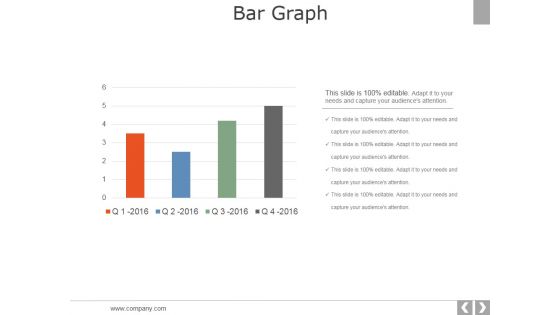
Bar Graph Ppt PowerPoint Presentation Styles Picture
This is a bar graph ppt powerpoint presentation styles picture. This is a four stage process. The stages in this process are business, strategy, marketing, analysis, chart and graph, bar graph.
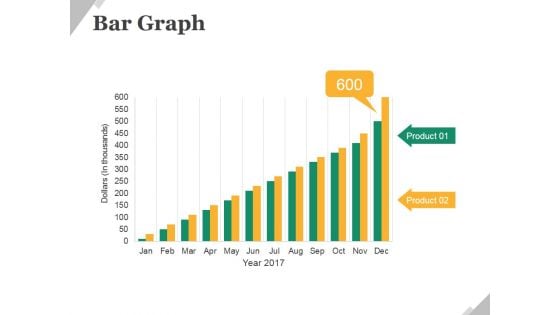
Bar Graph Ppt PowerPoint Presentation Model Layouts
This is a bar graph ppt powerpoint presentation model layouts. This is a two stage process. The stages in this process are business, product, bar graph, growth, management.
Bar Graph Ppt PowerPoint Presentation Templates
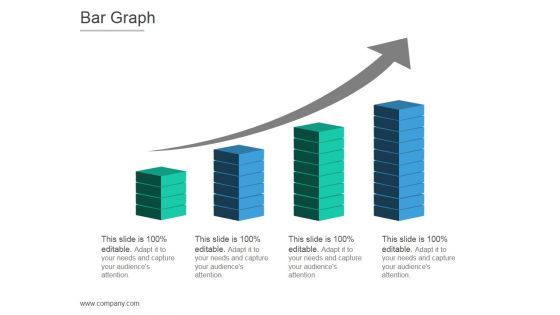
This is a bar graph ppt powerpoint presentation templates. This is a four stage process. The stages in this process are arrows, business, marketing, strategy, growth, graphic.
Bar Graph Ppt PowerPoint Presentation Layout
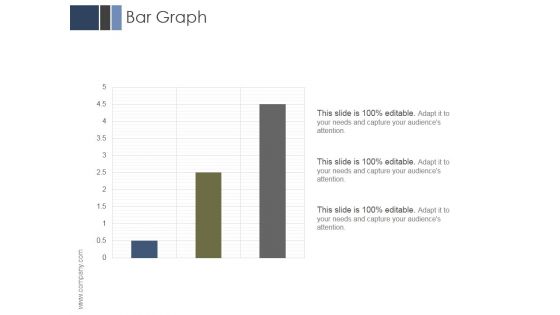
This is a bar graph ppt powerpoint presentation layout. This is a three stage process. The stages in this process are business, marketing, management, analysis, growth.
Bar Graph Ppt PowerPoint Presentation Outline Slides
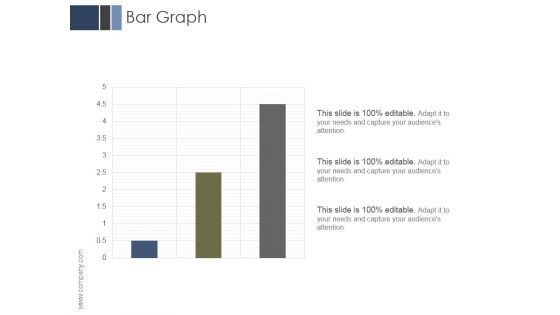
This is a bar graph ppt powerpoint presentation outline slides. This is a three stage process. The stages in this process are business, marketing, management, analysis, growth.
Bar Graph Ppt PowerPoint Presentation Microsoft
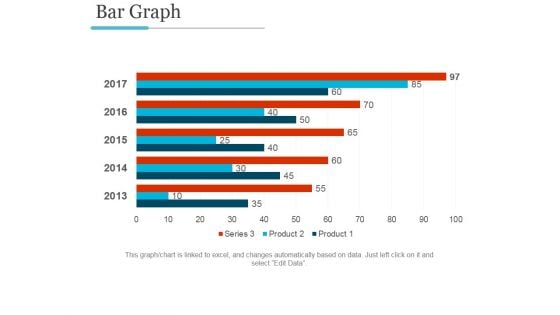
This is a bar graph ppt powerpoint presentation microsoft. This is a five stage process. The stages in this process are bar graph, finance, marketing, strategy, analysis, business.
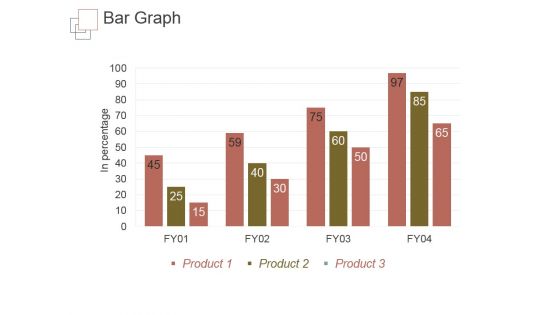
Bar Graph Ppt PowerPoint Presentation Gallery Skills
This is a bar graph ppt powerpoint presentation gallery skills. This is a four stage process. The stages in this process are in percentage, bar graph, business, marketing, product.
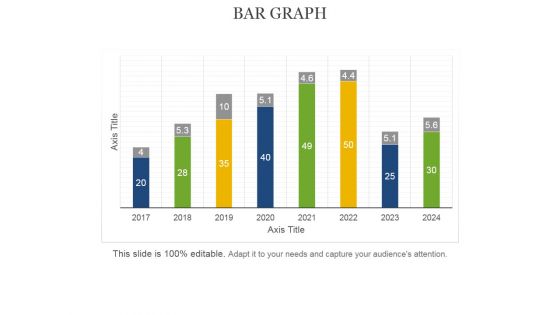
Bar Graph Ppt PowerPoint Presentation Professional Guide
This is a bar graph ppt powerpoint presentation professional guide. This is a eight stage process. The stages in this process are axis title, bar graph, business, marketing, management.
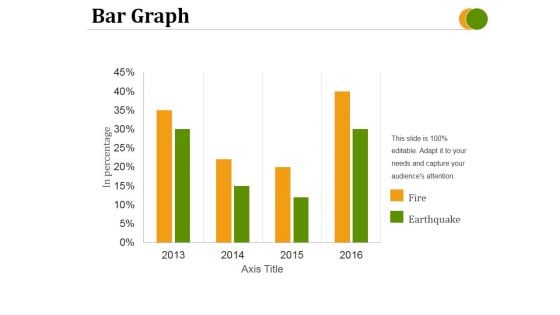
Bar Graph Ppt PowerPoint Presentation Layouts Pictures
This is a bar graph ppt powerpoint presentation layouts pictures. This is a four stage process. The stages in this process are fire, earthquake, axis title, in percentage.
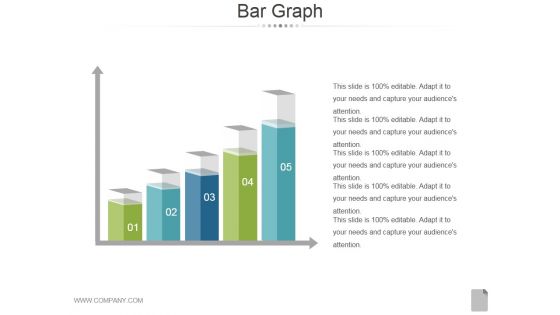
Bar Graph Ppt PowerPoint Presentation Guide
This is a bar graph ppt powerpoint presentation guide. This is a five stage process. The stages in this process are bar graph, finance, marketing, analysis, strategy, business.
Bar Graph Ppt PowerPoint Presentation Layouts Good
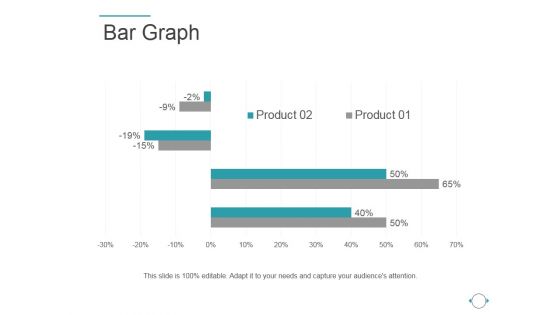
This is a bar graph ppt powerpoint presentation layouts good. This is a two stage process. The stages in this process are bar graph, finance, success, strategy, management.
Bar Graph Ppt PowerPoint Presentation Model
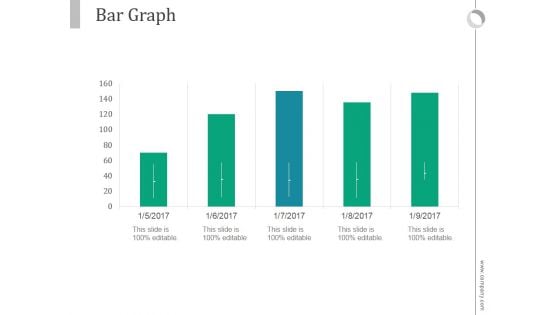
This is a bar graph ppt powerpoint presentation model. This is a five stage process. The stages in this process are business, marketing, bar slides, management, finance.
Bar Graph Ppt PowerPoint Presentation Themes
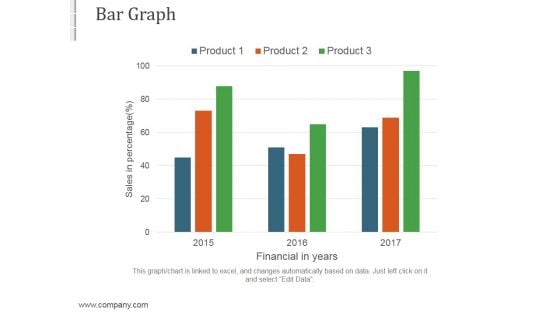
This is a bar graph ppt powerpoint presentation themes. This is a three stage process. The stages in this process are business, marketing, strategy, success, management.
Finance Bar Graph With Arrow Business PowerPoint Templates And PowerPoint Themes 0912
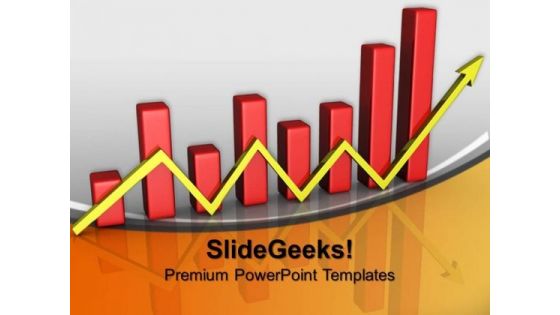
Finance Bar Graph With Arrow Business PowerPoint Templates And PowerPoint Themes 0912-Microsoft Powerpoint Templates and Background with financial bar graph chart-Financial bar graph chart, business, arrows, marketing, finance, success End doubts with our Finance Bar Graph With Arrow Business PowerPoint Templates And PowerPoint Themes 0912. You will come out on top.
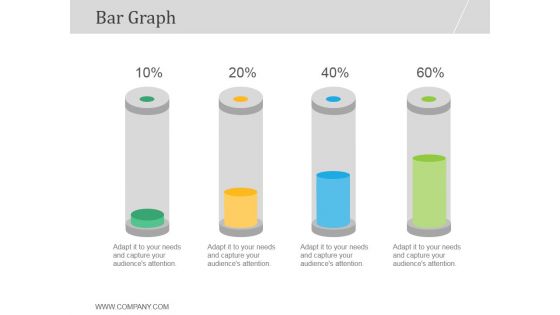
Bar Graph Ppt PowerPoint Presentation Good
This is a bar graph ppt powerpoint presentation good. This is a four stage process. The stages in this process are bar graph, growth, business, marketing, management, percentage.
Bar Graph Ppt PowerPoint Presentation Icon Diagrams
This is a bar graph ppt powerpoint presentation icon diagrams. This is a nine stage process. The stages in this process are product, bar graph, marketing, success.
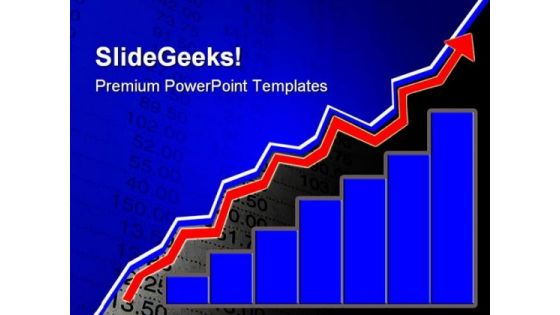
Financial Growth Business PowerPoint Templates And PowerPoint Backgrounds 0711
Microsoft PowerPoint Template and Background with finance graph depicting growth Our Financial Growth Business PowerPoint Templates And PowerPoint Backgrounds 0711 stay away from farce. They treat every event correctly.
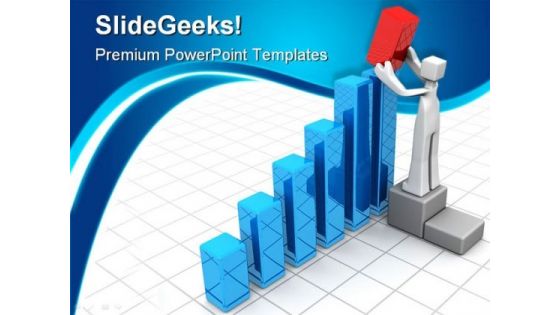
Growth Graph Finance PowerPoint Templates And PowerPoint Backgrounds 0511
Microsoft PowerPoint Template and Background with businessman adding a red bar chart to increase financial growth Transition to a better presentation with our Growth Graph Finance PowerPoint Templates And PowerPoint Backgrounds 0511. Download without worries with our money back guaranteee.

Financial Dashboard For Month Closing Income And Expenses Ideas PDF
This slide illustrates facts and figures related to month end financials of a corporation. It includes income statement graph, profit margin, income and expenditure graph etc.Showcasing this set of slides titled Financial Dashboard For Month Closing Income And Expenses Ideas PDF The topics addressed in these templates are Accounts Receivable, Income Statement, Expenditure All the content presented in this PPT design is completely editable. Download it and make adjustments in color, background, font etc. as per your unique business setting.

Building Financial Future PowerPoint Background And Template 1210
Microsoft PowerPoint Template and Background with Coins stacked as a rising graph on stock report Our Building Financial Future PowerPoint Background And Template 1210 pick up on many a fable. They contain the wisdom of business lore.
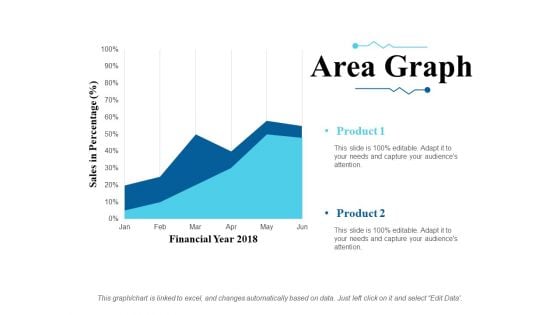
Area Graph Ppt PowerPoint Presentation Slides Ideas
This is a area graph ppt powerpoint presentation slides ideas. This is a two stage process. The stages in this process are sales in percentage, financial year, product.
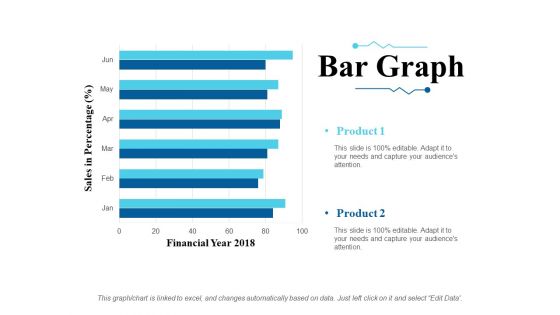
Bar Graph Ppt PowerPoint Presentation Inspiration Slides
This is a bar graph ppt powerpoint presentation inspiration slides. This is a six stage process. The stages in this process are sales in percentage, financial year, product.
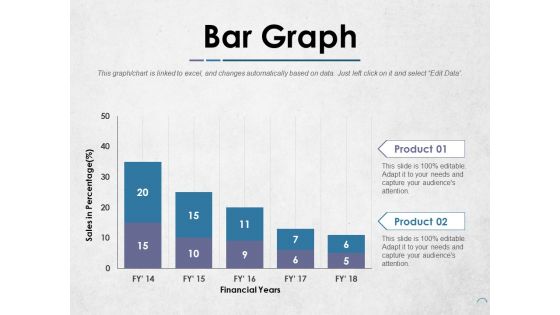
Bar Graph Ppt PowerPoint Presentation Infographics Templates
This is a bar graph ppt powerpoint presentation infographics templates. This is a two stage process. The stages in this process are product, financial years, sales in percentage.
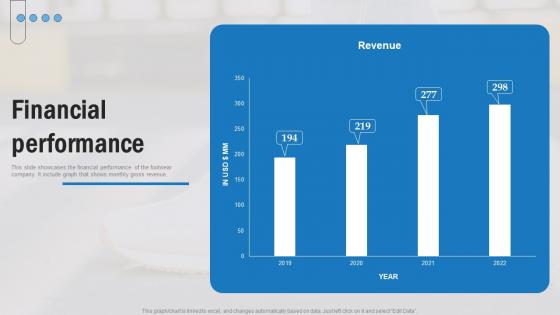
Financial Performance Footwear Company Funding Elevator Pitch Deck Background Pdf
This slide showcases the financial performance of the footwear company. It include graph that shows monthly gross revenue. From laying roadmaps to briefing everything in detail, our templates are perfect for you. You can set the stage with your presentation slides. All you have to do is download these easy-to-edit and customizable templates. Financial Performance Footwear Company Funding Elevator Pitch Deck Background Pdf will help you deliver an outstanding performance that everyone would remember and praise you for. Do download this presentation today. This slide showcases the financial performance of the footwear company. It include graph that shows monthly gross revenue.
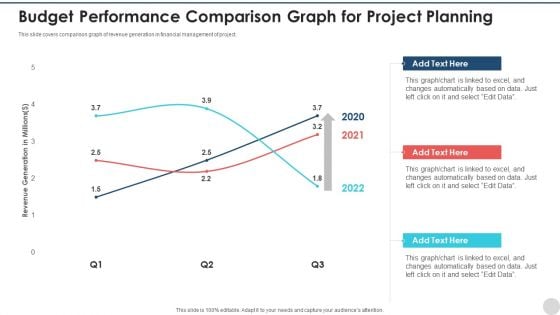
Budget Performance Comparison Graph For Project Planning Pictures PDF
This slide covers comparison graph of revenue generation in financial management of project. Showcasing this set of slides titled budget performance comparison graph for project planning pictures pdf. The topics addressed in these templates are budget performance comparison graph for project planning. All the content presented in this PPT design is completely editable. Download it and make adjustments in color, background, font etc. as per your unique business setting.
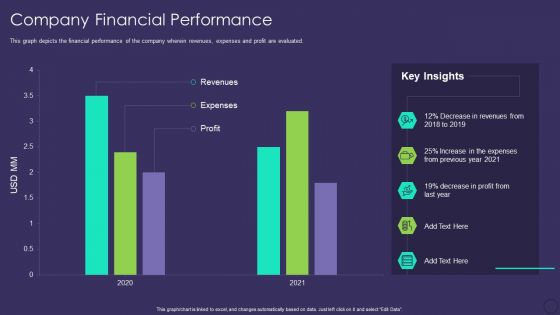
Comprehensive Business Digitization Deck Company Financial Performance Formats PDF
This graph depicts the financial performance of the company wherein revenues, expenses and profit are evaluated. Deliver and pitch your topic in the best possible manner with this comprehensive business digitization deck company financial performance formats pdf. Use them to share invaluable insights on revenues, expenses, profit and impress your audience. This template can be altered and modified as per your expectations. So, grab it now.
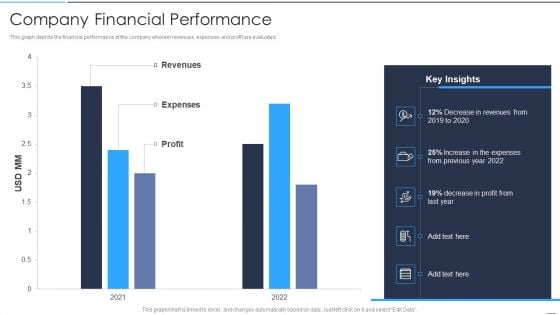
Accelerate Online Journey Now Company Financial Performance Topics PDF
This graph depicts the financial performance of the company wherein revenues, expenses and profit are evaluated.Deliver and pitch your topic in the best possible manner with this Accelerate Online Journey Now Company Financial Performance Topics PDF Use them to share invaluable insights on Decrease Revenues, Increase Expenses, Decrease Profit and impress your audience. This template can be altered and modified as per your expectations. So, grab it now.
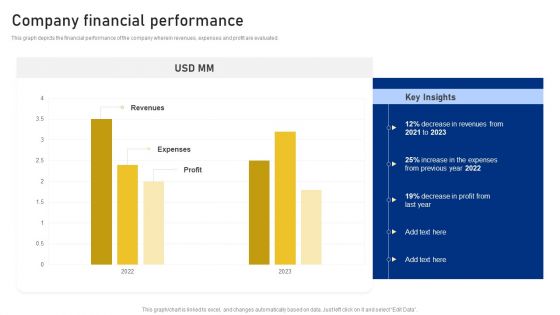
Reshaping Business In Digital Company Financial Performance Sample PDF
This graph depicts the financial performance of the company wherein revenues, expenses and profit are evaluated. Deliver and pitch your topic in the best possible manner with this Reshaping Business In Digital Company Financial Performance Sample PDF. Use them to share invaluable insights on Decrease Revenues, 2021 To 2023, Profit and impress your audience. This template can be altered and modified as per your expectations. So, grab it now.
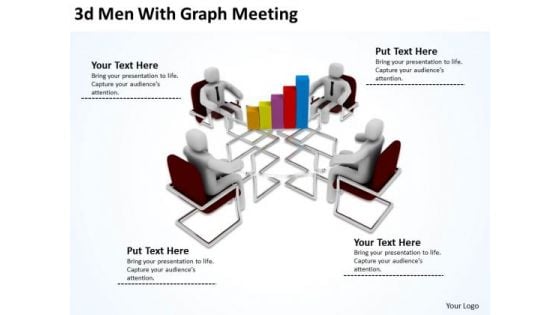
Successful Business Men 3d With Graph Meeting PowerPoint Slides
We present our successful business men 3d with graph meeting PowerPoint Slides.Present our Business PowerPoint Templates because You can Bask in the warmth of our PowerPoint Templates and Slides. Enjoy the heartfelt glowing response of your listeners. Download and present our Finance PowerPoint Templates because Our PowerPoint Templates and Slides has conjured up a web of all you need with the help of our great team. Use them to string together your glistening ideas. Use our Teamwork PowerPoint Templates because Our PowerPoint Templates and Slides provide you with a vast range of viable options. Select the appropriate ones and just fill in your text. Download our Leadership PowerPoint Templates because Our PowerPoint Templates and Slides will let you Hit the right notes. Watch your audience start singing to your tune. Download and present our Success PowerPoint Templates because Our PowerPoint Templates and Slides help you meet the demand of the Market. Just browse and pick the slides that appeal to your intuitive senses.Use these PowerPoint slides for presentations relating to 3d, administrative, boss, business, businessman, chair, chart, community, conference, discussion, finance, financial, graph, growth, human, leadership, manager, meeting, office, partnership, people, plan, professional, project, round, sitting, table, team, teamwork, white, women, work, worker. The prominent colors used in the PowerPoint template are Blue, Red, White. Professionals tell us our successful business men 3d with graph meeting PowerPoint Slides are effectively colour coded to prioritise your plans They automatically highlight the sequence of events you desire. People tell us our business PowerPoint templates and PPT Slides will impress their bosses and teams. We assure you our successful business men 3d with graph meeting PowerPoint Slides will impress their bosses and teams. Presenters tell us our businessman PowerPoint templates and PPT Slides are specially created by a professional team with vast experience. They diligently strive to come up with the right vehicle for your brilliant Ideas. We assure you our successful business men 3d with graph meeting PowerPoint Slides help you meet deadlines which are an element of today's workplace. Just browse and pick the slides that appeal to your intuitive senses. PowerPoint presentation experts tell us our boss PowerPoint templates and PPT Slides will help you be quick off the draw. Just enter your specific text and see your points hit home. Give your thoughts an elixir with our Successful Business Men 3d With Graph Meeting PowerPoint Slides. They will reamain forever chic and charming.
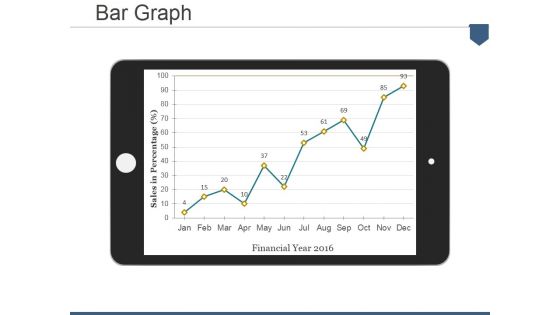
Bar Graph Ppt PowerPoint Presentation Pictures Display
This is a bar graph ppt powerpoint presentation pictures display. This is a one stage process. The stages in this process are sales in percentage, financial year.
Bar Graph With Five Icons Powerpoint Slides
This PowerPoint slide contains diagram bar graph with icons. This PPT slide helps to exhibit concepts of financial deal and planning. Use this business slide to make impressive presentations.
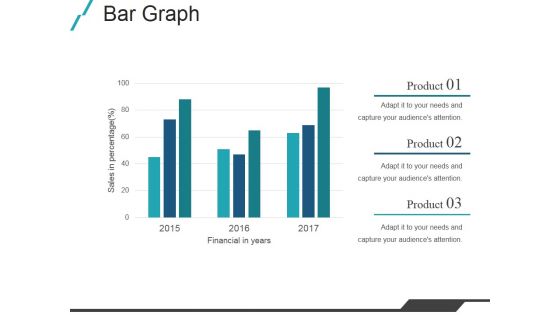
Bar Graph Ppt PowerPoint Presentation Slides Deck
This is a bar graph ppt powerpoint presentation slides deck. This is a three stage process. The stages in this process are financial in years, product, sales in percentage.
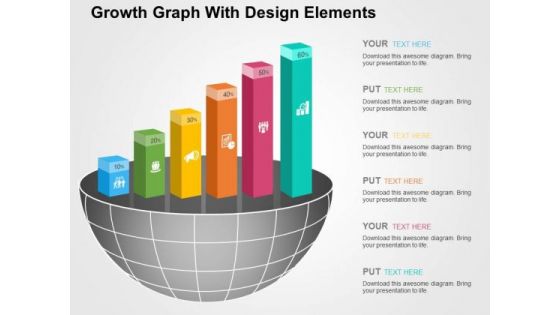
Growth Graph With Design Elements PowerPoint Templates
The above template displays growth bar graph. This PowerPoint template signifies the concept of business and financial planning. Adjust the above diagram in your business presentations to visually support your content.
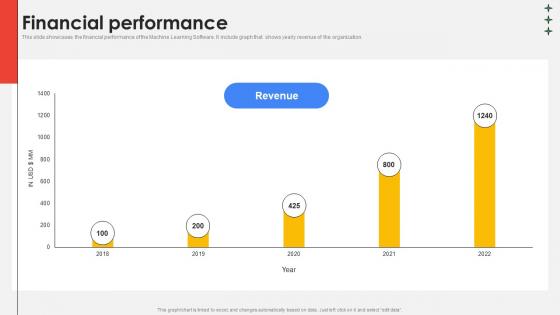
Financial Performance Cloud Platform Provider Investor Funding Elevator Ideas Pdf
This slide showcases the financial performance of the Machine Learning Software. It include graph that shows yearly revenue of the organization. From laying roadmaps to briefing everything in detail, our templates are perfect for you. You can set the stage with your presentation slides. All you have to do is download these easy-to-edit and customizable templates. Financial Performance Cloud Platform Provider Investor Funding Elevator Ideas Pdf will help you deliver an outstanding performance that everyone would remember and praise you for. Do download this presentation today. This slide showcases the financial performance of the Machine Learning Software. It include graph that shows yearly revenue of the organization.
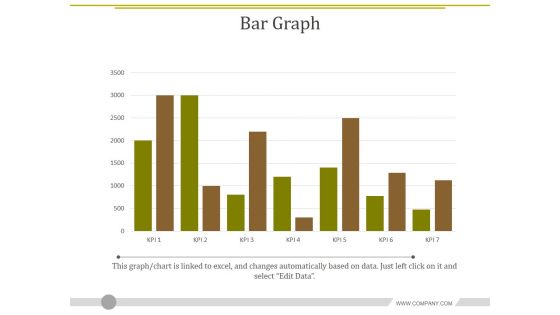
Bar Graph Ppt PowerPoint Presentation Gallery Good
This is a bar graph ppt powerpoint presentation gallery good. This is a seven stage process. The stages in this process are graph, finance, business, marketing.
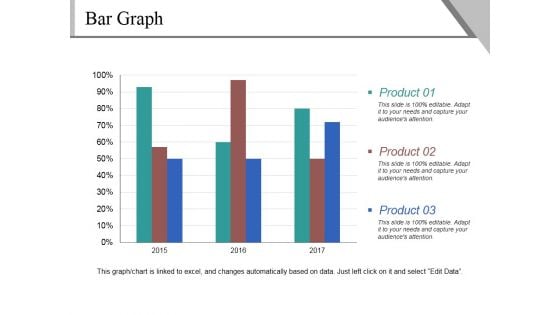
Bar Graph Ppt PowerPoint Presentation Ideas Show
This is a bar graph ppt powerpoint presentation ideas show. This is a three stage process. The stages in this process are product, percentage, business, year, graph.
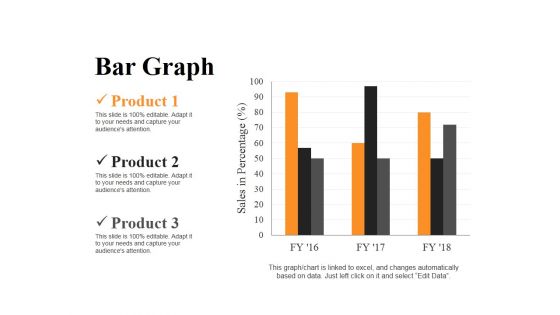
Bar Graph Ppt PowerPoint Presentation Infographics Clipart
This is a bar graph ppt powerpoint presentation infographics clipart. This is a three stage process. The stages in this process are product, graph, finance, business, marketing.
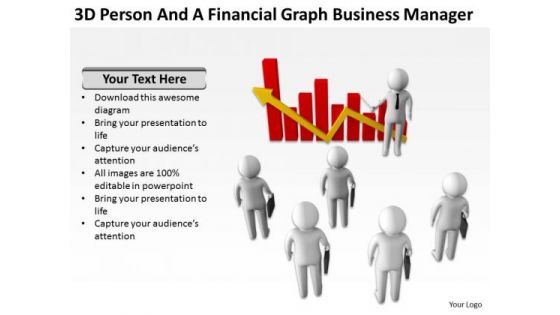
Young Business People Graph PowerPoint Templates Download Manager
We present our young business people graph powerpoint templates download manager.Present our People PowerPoint Templates because Our PowerPoint Templates and Slides offer you the widest possible range of options. Download and present our Teamwork PowerPoint Templates because Our PowerPoint Templates and Slides will let you Illuminate the road ahead to Pinpoint the important landmarks along the way. Use our Business PowerPoint Templates because Your ideas provide food for thought. Our PowerPoint Templates and Slides will help you create a dish to tickle the most discerning palate. Use our Marketing PowerPoint Templates because Your audience will believe you are the cats whiskers. Use our Future PowerPoint Templates because Our PowerPoint Templates and Slides team portray an attitude of elegance. Personify this quality by using them regularly.Use these PowerPoint slides for presentations relating to 3d, administrative, arrow, boss, business, businessman, chart, colleague,community, conference, cooperation, director, discussion, finance, financial,graph, growth, human, leader, leadership, man, manager, meeting, occupation,office, organization, partnership, people, person, plan, presentation, problem,professional, project, round, session, slump, staff, stockholder, talking, team, teamwork, thinking, white, work, worker. The prominent colors used in the PowerPoint template are Red, Yellow, White. Get a blue-chip client list with your ideas. Attract the best customers with our Young Business People Graph PowerPoint Templates Download Manager.
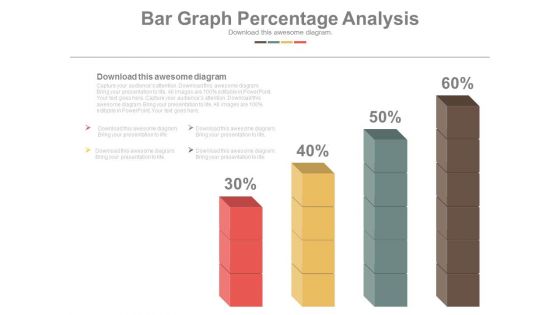
Bar Graph Displaying Profit Growth Powerpoint Slides
This PowerPoint template has been designed with six point?s bar graph with icons. This PPT slide can be used to prepare presentations for marketing reports and also for financial data analysis. You can download finance PowerPoint template to prepare awesome presentations.
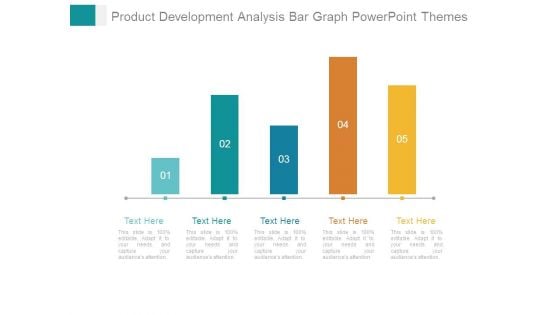
Product Development Analysis Bar Graph Powerpoint Themes
This is a product development analysis bar graph powerpoint themes. This is a five stage process. The stages in this process are business, growth, strategy, management, pretention.
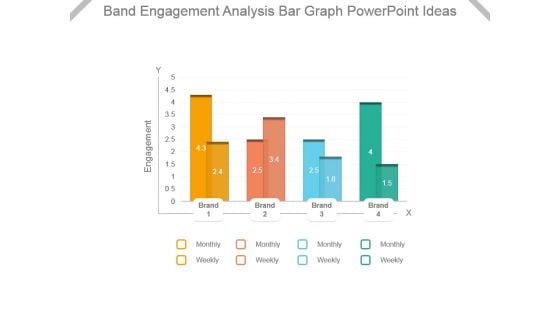
Band Engagement Analysis Bar Graph Powerpoint Ideas
This is a band engagement analysis bar graph powerpoint ideas. This is a four stage process. The stages in this process are engagement, brand, monthly, weekly.
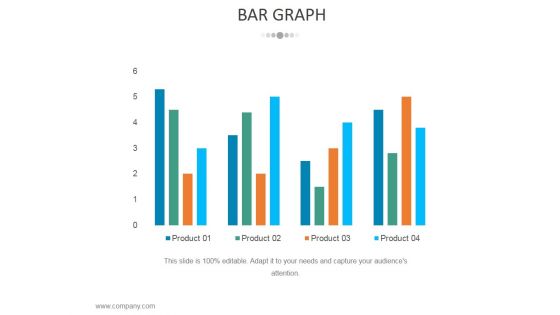
Bar Graph Ppt PowerPoint Presentation Ideas Sample
This is a bar graph ppt powerpoint presentation ideas sample. This is a four stage process. The stages in this process are business, strategy, marketing, analysis, chart and graph, bar graph.

 Home
Home