Financial Graphs
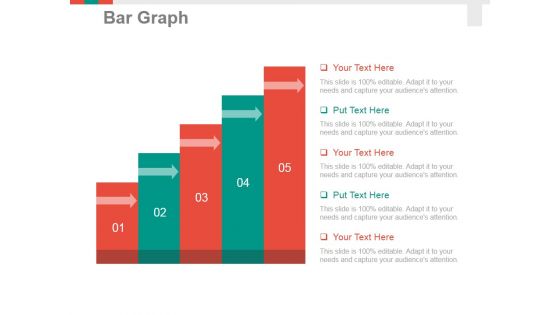
Bar Graph Ppt PowerPoint Presentation Pictures Tips
This is a bar graph ppt powerpoint presentation pictures tips. This is a five stage process. The stages in this process are bar graph, finance, marketing, strategy, analysis, business.
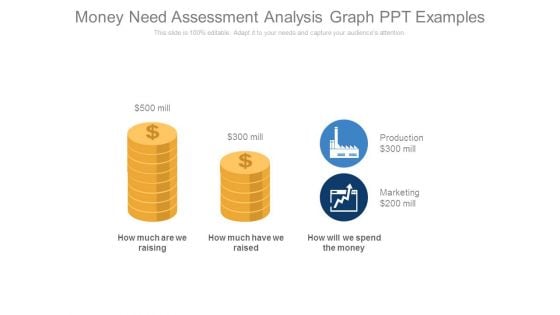
Money Need Assessment Analysis Graph Ppt Examples
This is a money need assessment analysis graph ppt examples. This is a two stage process. The stages in this process are production, marketing, need, money, finance.
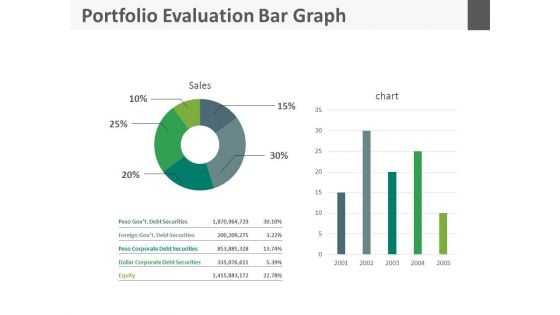
Portfolio Evaluation Bar Graph Ppt Slides
This is a portfolio evaluation bar graph ppt slides. This is a five stage process. The stages in this process are business, finance, marketing.
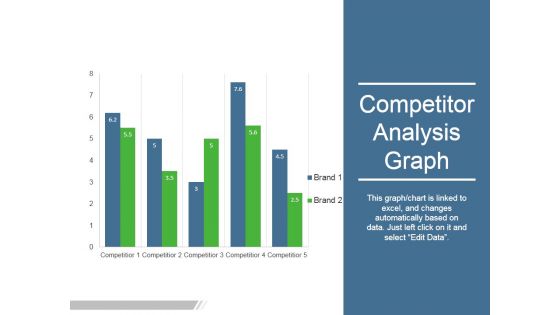
Competitor Analysis Graph Ppt PowerPoint Presentation Graphics
This is a competitor analysis graph ppt powerpoint presentation graphics. This is a five stage process. The stages in this process are competitor, business, marketing.
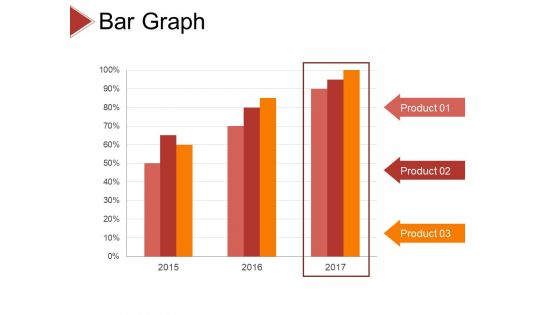
Bar Graph Ppt PowerPoint Presentation Layouts Gridlines
This is a bar graph ppt powerpoint presentation layouts gridlines. this is a three stage process. The stages in this process are product, percentage, business, marketing, management.

Bar Graph Ppt PowerPoint Presentation Gallery Inspiration
This is a bar graph ppt powerpoint presentation gallery inspiration. This is a three stage process. The stages in this process are product, sales in percentage, finance, success.
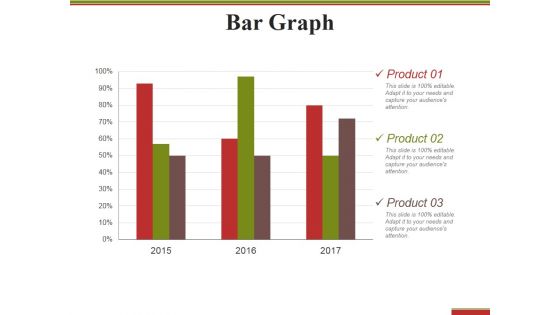
Bar Graph Ppt PowerPoint Presentation Outline Structure
This is a bar graph ppt powerpoint presentation outline structure. This is a three stage process. The stages in this process are product, percentage, finance, business.
Bar Graph Ppt PowerPoint Presentation Icon
This is a bar graph ppt powerpoint presentation icon. This is a three stage process. The stages in this process are business, finance, marketing, strategy, analysis.
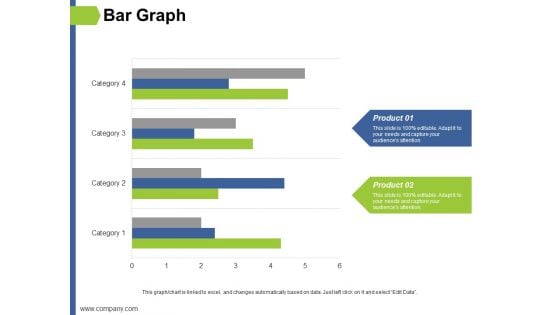
Bar Graph Ppt PowerPoint Presentation Show Slides
This is a bar graph ppt powerpoint presentation show slides. This is a two stage process. The stages in this process are finance, marketing, management, investment, analysis.
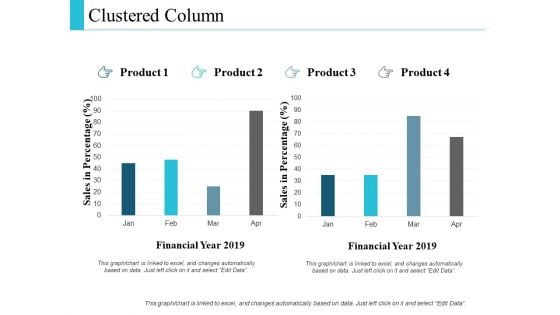
Clustered Column Graph Ppt PowerPoint Presentation Layouts
This is a clustered column graph ppt powerpoint presentation layouts. This is a two stage process. The stages in this process are finance, marketing, management, investment, analysis.
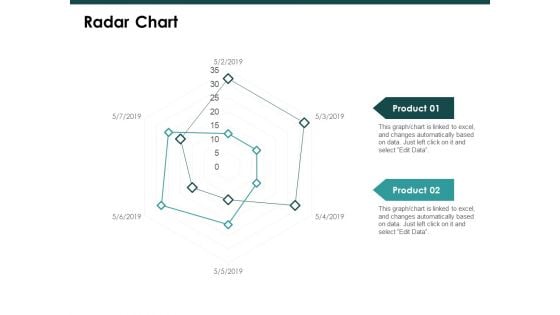
Radar Chart Graph Ppt PowerPoint Presentation Slide
This is a radar chart graph ppt powerpoint presentation slide. This is a two stage process. The stages in this process are finance, marketing, management, investment, analysis.
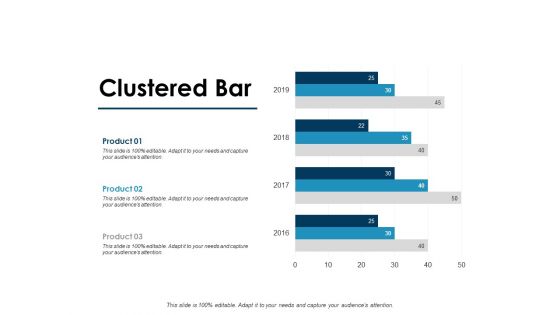
Clustered Bar Graph Ppt PowerPoint Presentation Templates
This is a clustered bar graph ppt powerpoint presentation templates. This is a three stage process. The stages in this process are finance, marketing, management, investment, analysis.
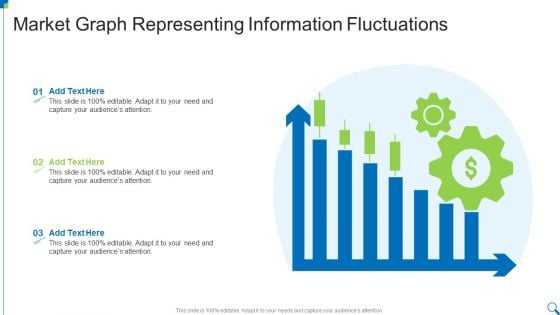
Market Graph Representing Information Fluctuations Diagrams PDF
Presenting Market Graph Representing Information Fluctuations Diagrams PDF to dispense important information. This template comprises three stages. It also presents valuable insights into the topics including Market Graph, Representing, Information Fluctuations This is a completely customizable PowerPoint theme that can be put to use immediately. So, download it and address the topic impactfully.
Investment Portfolio Advantages Graph Icon Rules PDF
Presenting Investment Portfolio Advantages Graph Icon Rules PDF to dispense important information. This template comprises three stages. It also presents valuable insights into the topics including Investment Portfolio, Advantages Graph Icon. This is a completely customizable PowerPoint theme that can be put to use immediately. So, download it and address the topic impactfully.
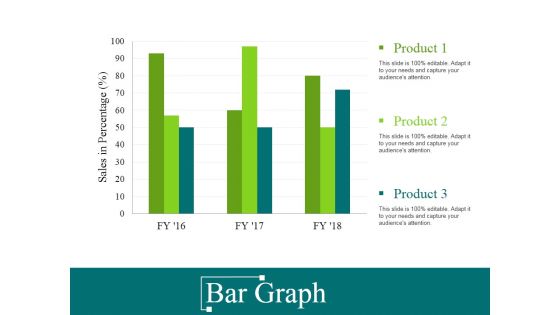
Bar Graph Ppt PowerPoint Presentation Gallery Grid
This is a bar graph ppt powerpoint presentation gallery grid. This is a three stage process. The stages in this process are sales in percentage, product, finance, business, marketing.
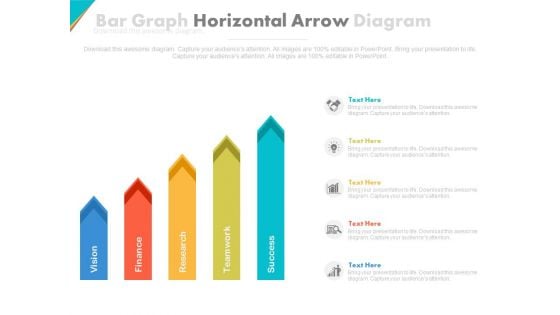
Five Horizontal Arrows Bar Graph Powerpoint Slides
This PowerPoint template contains five horizontal arrows bra graph. You may download this PPT slide design to display steps of strategic planning. You can easily customize this template to make it more unique as per your need.
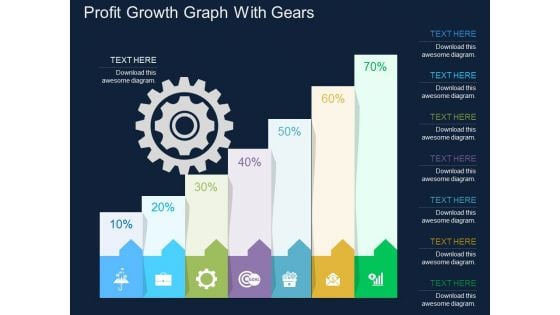
Profit Growth Graph With Gears Powerpoint Template
This business slide contains profit growth graph with gears. This PowerPoint template helps to display outline of business plan. Use this diagram to impart more clarity to data and to create more sound impact on viewers.
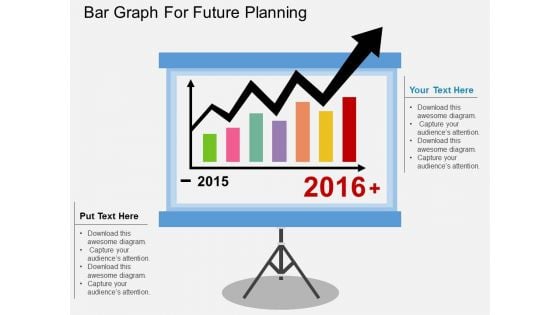
Bar Graph For Future Planning Powerpoint Template
This business diagram display bar graph for years 2015 and 2016. You may use this slide to display statistical analysis. This diagram provides an effective way of displaying information you can edit text, color, shade and style as per you need.
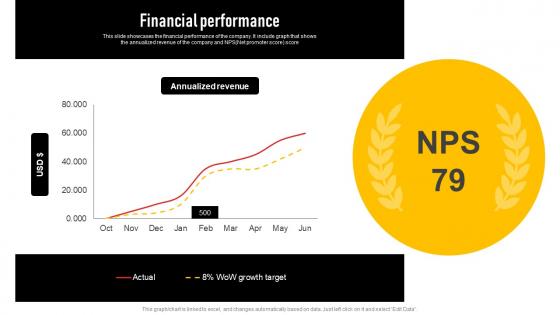
Financial Performance Insurance Investor Funding Elevator Pitch Deck Slides Pdf
This slide showcases the financial performance of the company. It include graph that shows the annualized revenue of the company and NPSNet promoter score score Do you know about Slidesgeeks Financial Performance Insurance Investor Funding Elevator Pitch Deck Slides Pdf These are perfect for delivering any kind od presentation. Using it, create PowerPoint presentations that communicate your ideas and engage audiences. Save time and effort by using our pre designed presentation templates that are perfect for a wide range of topic. Our vast selection of designs covers a range of styles, from creative to business, and are all highly customizable and easy to edit. Download as a PowerPoint template or use them as Google Slides themes. This slide showcases the financial performance of the company. It include graph that shows the annualized revenue of the company and NPSNet promoter score score
Bar Graph Business PowerPoint Template 1110
Abstract vector background with bar graphs and dollar sign Detail goals with our Bar Graph Business PowerPoint Template 1110. Download without worries with our money back guaranteee.
Business People Vector Templates Download Graph PowerPoint
We present our business people vector templates download graph PowerPoint.Download our Computer PowerPoint Templates because You have the co-ordinates for your destination of success. Let our PowerPoint Templates and Slides map out your journey. Download and present our Business PowerPoint Templates because Our PowerPoint Templates and Slides will give good value for money. They also have respect for the value of your time. Use our People PowerPoint Templates because Watching this your Audience will Grab their eyeballs, they wont even blink. Use our Technology PowerPoint Templates because You canTake a leap off the starting blocks with our PowerPoint Templates and Slides. They will put you ahead of the competition in quick time. Use our Circle Charts PowerPoint Templates because They will Put your wonderful verbal artistry on display. Our PowerPoint Templates and Slides will provide you the necessary glam and glitter.Use these PowerPoint slides for presentations relating to 3d, abstract, action, background, business, businessman, career, carpet, cartoon,challenge, color, communication, company, competition, concept, corporate,design, finance, graph, graphic,growth, high, human, idea, illustration,individual, isolated, leader, man, motion, occupation, organization, people, person,red, render, shape, stair, step, success, symbol, top, up, white, winner, work,workforce. The prominent colors used in the PowerPoint template are Pink, Green, Yellow. Our Business People Vector Templates Download Graph PowerPoint put in an earnest attempt. They put in hard hours to assist you.
Graph With Money PowerPoint Icon C
3D colored graph with paper currency.High quality render Our Graph With Money PowerPoint Icon C cover a broad ambit. They help you articulate on an array of aspects.
Graph With Money PowerPoint Icon S
3D colored graph with paper currency.High quality render Our Graph With Money PowerPoint Icon S make excellent accessories. Your thoughts will don that designer look.
Bar Graph Business PowerPoint Template 0810
3d illustration of growing graph and arrow Close deals with our Bar Graph Business PowerPoint Template 0810. Download without worries with our money back guaranteee.
Abstract Business Graph PowerPoint Icon R
Microsoft PowerPoint Template and Background with business graph with profits rising off the chart. Graph on a white reflective backgroun Distribute tasks with our Abstract Business Graph PowerPoint Icon R. Download without worries with our money back guaranteee.
Abstract Business Graph PowerPoint Icon C
Microsoft PowerPoint Template and Background with business graph with profits rising off the chart. Graph on a white reflective backgroun Expedite growth with our Abstract Business Graph PowerPoint Icon C. Download without worries with our money back guaranteee.
Business Graph With Arrow PowerPoint Icon F
Microsoft PowerPoint Template and Background with business graph Demonstrate ability with our Business Graph With Arrow PowerPoint Icon F. Download without worries with our money back guaranteee.
Profit Graph Business PowerPoint Presentation Slides C
Microsoft PowerPoint Slides and Background with colorful upward profit graph with blue background Our Profit Graph Business PowerPoint Presentation Slides C are a business development asset. They advertise the value you deliver.
Profit Graph Business PowerPoint Presentation Slides Cc
Microsoft PowerPoint Slides and Background with colorful upward profit graph with blue background Our Profit Graph Business PowerPoint Presentation Slides Cc believe in being consistent. The are designed to maintain a standard.
Profit Graph Business PowerPoint Presentation Slides F
Microsoft PowerPoint Slides and Background with colorful upward profit graph with blue background Excellence is an article of faith with our Profit Graph Business PowerPoint Presentation Slides F team. They give their all and more to achieve it.
Profit Graph Business PowerPoint Presentation Slides R
Microsoft PowerPoint Slides and Background with colorful upward profit graph with blue background Recieve adulatory feedback with our Profit Graph Business PowerPoint Presentation Slides R. The audience will give an enthusiastic response.
Profit Graph Business PowerPoint Presentation Slides S
Microsoft PowerPoint Slides and Background with colorful upward profit graph with blue background Stitch together the fabric of your thoughts. Thread through with our Profit Graph Business PowerPoint Presentation Slides S.
Coin Graph Finance PowerPoint Presentation Slides C
Microsoft PowerPoint Slides and Backgrounds with bar graph made of gold coins Deliver education with our Coin Graph Finance PowerPoint Presentation Slides C. Cover the course in a systematic manner.
Coin Graph Finance PowerPoint Presentation Slides Cc
Microsoft PowerPoint Slides and Backgrounds with bar graph made of gold coins Let your ideas grow in their minds. Our Coin Graph Finance PowerPoint Presentation Slides Cc will act like a fertilizer.
Coin Graph Finance PowerPoint Presentation Slides F
Microsoft PowerPoint Slides and Backgrounds with bar graph made of gold coins Be a cross-functional expertise with our Coin Graph Finance PowerPoint Presentation Slides F. They will make you look good.
Coin Graph Finance PowerPoint Presentation Slides R
Microsoft PowerPoint Slides and Backgrounds with bar graph made of gold coins Distill your thoughts with our Coin Graph Finance PowerPoint Presentation Slides R. They will draw outthe essence of it all.
Coin Graph Finance PowerPoint Presentation Slides S
Microsoft PowerPoint Slides and Backgrounds with bar graph made of gold coins Become an orator with our Coin Graph Finance PowerPoint Presentation Slides S. You will come out on top.

Dollar Graph Business PowerPoint Template 0610
Business Diagram it is isolated on a white background Recruit leaders with our Dollar Graph Business PowerPoint Template 0610. Download without worries with our money back guaranteee.
Bar Graph Business PowerPoint Presentation Slides R
Microsoft PowerPoint Slides and Backgrounds with style of a vector bar graph Examine plans with our Bar Graph Business PowerPoint Presentation Slides R. Download without worries with our money back guaranteee.
Success Graph Business PowerPoint Presentation Slides F
Microsoft Powerpoint Slides and Backgrounds with three dimensional shape of bussiness graph on a white background Mastermind plans with our Success Graph Business PowerPoint Presentation Slides F. Download without worries with our money back guaranteee.
Success Graph Business PowerPoint Presentation Slides S
Microsoft Powerpoint Slides and Backgrounds with three dimensional shape of bussiness graph on a white background Test boundaries of presenting with our Success Graph Business PowerPoint Presentation Slides S. Download without worries with our money back guaranteee.
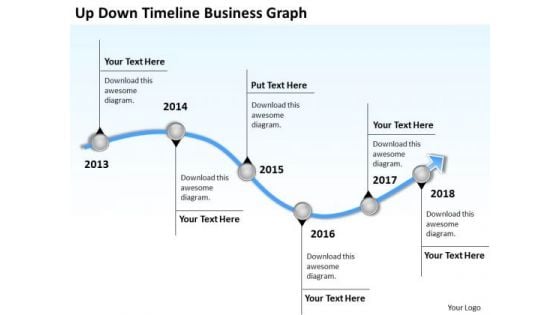
Business Analysis Diagrams PowerPoint Presentations Graph Templates
We present our business analysis diagrams powerpoint presentations graph templates.Download and present our Curves and Lines PowerPoint Templates because Your audience will believe you are the cats whiskers. Present our Business PowerPoint Templates because Our PowerPoint Templates and Slides will effectively help you save your valuable time. They are readymade to fit into any presentation structure. Present our Business PowerPoint Templates because Our PowerPoint Templates and Slides will give good value for money. They also have respect for the value of your time. Use our Arrows PowerPoint Templates because It will get your audience in sync. Present our Process and Flows PowerPoint Templates because It can Conjure up grand ideas with our magical PowerPoint Templates and Slides. Leave everyone awestruck by the end of your presentation.Use these PowerPoint slides for presentations relating to 3d, account, accounting, annual, balance, business, chart, commerce, crisis, data,earnings, economics, economy, exchange, figures, finance, financial, graph,graphic, growth, illustration, index, information, investment, list, line,management,market, marketing, money, monitoring, numbers, office, paperwork, plan, price,printout, report, research, sale, statistical, statistics, stock, success, tax, trade,work. The prominent colors used in the PowerPoint template are Blue light, Gray, White. Examine the causes with our Business Analysis Diagrams PowerPoint Presentations Graph Templates. Let everyone know what's behind it all.
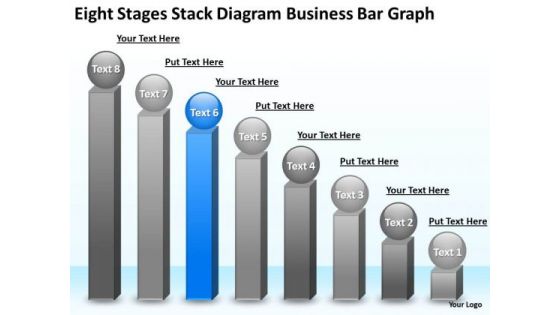
Business PowerPoint Presentations Bar Graph Plan Slides
We present our business powerpoint presentations bar graph plan Slides.Present our Business PowerPoint Templates because It will Raise the bar of your Thoughts. They are programmed to take you to the next level. Download our Spheres PowerPoint Templates because You can Channelise the thoughts of your team with our PowerPoint Templates and Slides. Urge them to focus on the goals you have set. Download our Competition PowerPoint Templates because Our PowerPoint Templates and Slides will let you Leave a lasting impression to your audiences. They possess an inherent longstanding recall factor. Present our Shapes PowerPoint Templates because It will get your audience in sync. Use our Success PowerPoint Templates because Our PowerPoint Templates and Slides will let you Leave a lasting impression to your audiences. They possess an inherent longstanding recall factor.Use these PowerPoint slides for presentations relating to bar, graph, statistics, economy, render, success, representation, diagram, graphic, achievment, obstruction, chevron, accounting, finances, energy eco, steps, figure, tall, barrier, strategy, ladder, up, planning, high, climb, stripes, growth, maintenance, profit, successful, repair, return, gradient, sustainability, financial, construction, upwards, increasing. The prominent colors used in the PowerPoint template are Blue, Gray, White. Get fab and cool with our Business PowerPoint Presentations Bar Graph Plan Slides. Be the trendsetter with your thoughts.
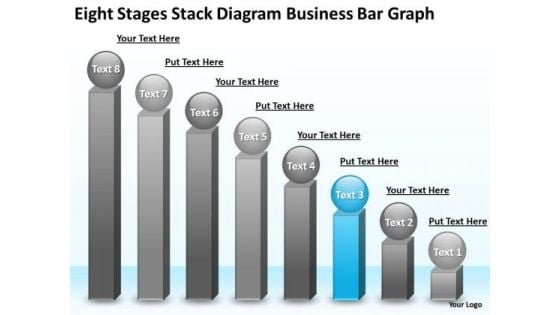
PowerPoint Presentations Bar Graph Business Plan Templates
We present our powerpoint presentations bar graph business plan templates.Use our Finance PowerPoint Templates because Our PowerPoint Templates and Slides are created by a hardworking bunch of busybees. Always flitting around with solutions gauranteed to please. Download our Leadership PowerPoint Templates because Our PowerPoint Templates and Slides are endowed to endure. Ideas conveyed through them will pass the test of time. Use our Business PowerPoint Templates because Your ideas provide food for thought. Our PowerPoint Templates and Slides will help you create a dish to tickle the most discerning palate. Use our Success PowerPoint Templates because Our PowerPoint Templates and Slides will provide you a launch platform. Give a lift off to your ideas and send them into orbit. Use our Spheres PowerPoint Templates because You can Bait your audience with our PowerPoint Templates and Slides. They will bite the hook of your ideas in large numbers.Use these PowerPoint slides for presentations relating to Concepts, Leadership, Success, Human, Achievement, Wink, Business, Ball, Three-Dimensional, Sign, Template, Diagram, Change, Character, Graphic, Stock, Development, Shape, Graph, Finances, Steps, Chart, Sphere, Examining, Up, Nice, Planning, Face, Growth, Person, Progress, Increases, Improvement, Image, Mimicry, Financial, Staircase. The prominent colors used in the PowerPoint template are Blue, Gray, Black. Clear the dust with our PowerPoint Presentations Bar Graph Business Plan Templates. Deliver your ideas in a clear environment.
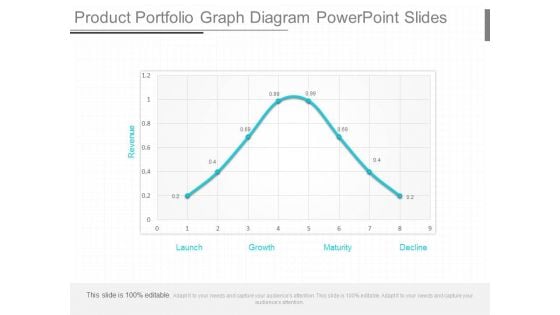
Product Portfolio Graph Diagram Powerpoint Slides
This is a product portfolio graph diagram powerpoint slides. This is a eight stage process. The stages in this process are revenue, launch, growth, maturity, decline.
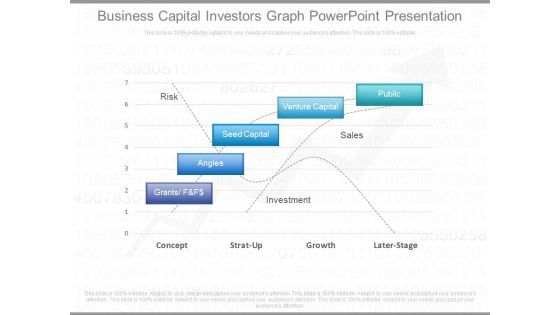
Business Capital Investors Graph Powerpoint Presentation
This is a business capital investors graph powerpoint presentation. This is a five stage process. The stages in this process are public, venture capital, seed capital, angles, grants f and f$.
Statistics Graph Business PowerPoint Presentation Slides F
Microsoft Powerpoint Slides and Backgrounds with business statistics in white with a green arrow Double your growth with our Statistics Graph Business PowerPoint Presentation Slides F. Download without worries with our money back guaranteee.
Statistics Graph Business PowerPoint Presentation Slides R
Microsoft Powerpoint Slides and Backgrounds with business statistics in white with a green arrow Motivate teams with our Statistics Graph Business PowerPoint Presentation Slides R. Download without worries with our money back guaranteee.
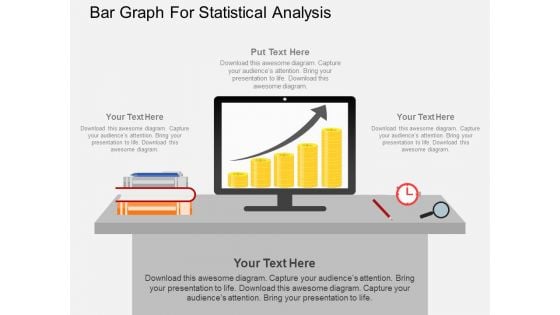
Bar Graph For Statistical Analysis Powerpoint Template
Our above PPT slide contains computer screen on a desk displaying bar graph. This PowerPoint template may be used to display statistical analysis. This template is designed to attract the attention of your audience.
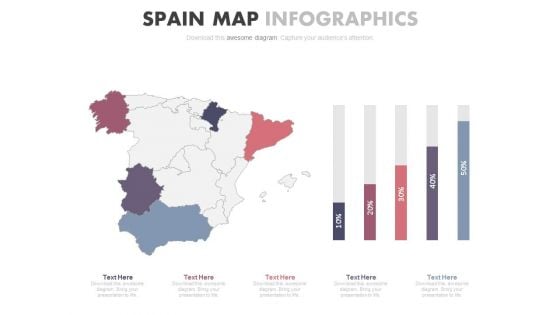
Spain Map With Growth Graph Powerpoint Slides
This PowerPoint template displays Spain map with growth graph. This PPT template can be used in business presentations to depict economic growth of country. This slide can also be used by school students for educational projects.
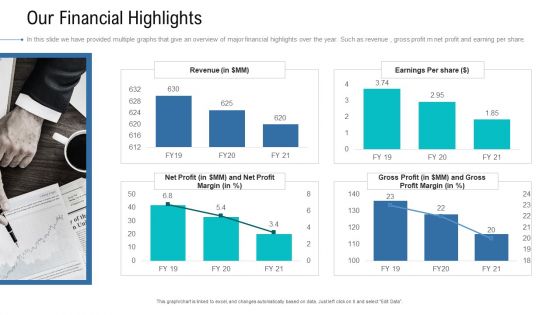
Organizational Development And Promotional Plan Our Financial Highlights Ideas PDF
In this slide we have provided multiple graphs that give an overview of major financial highlights over the year. Such as revenue , gross profit m net profit and earning per share. Deliver an awe inspiring pitch with this creative organizational development and promotional plan our financial highlights ideas pdf bundle. Topics like revenue, gross profit, net profit can be discussed with this completely editable template. It is available for immediate download depending on the needs and requirements of the user.
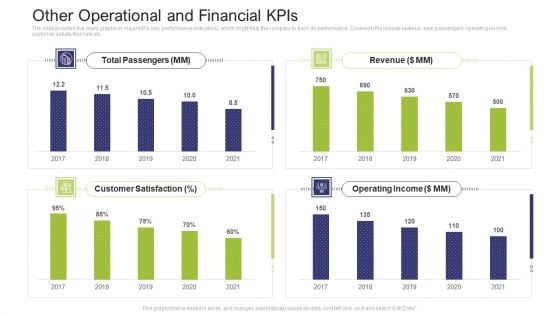
Other Operational And Financial Kpis Inspiration PDF
The slide provides five years graphs of major KPIs key performance indicators, which might help the company to track its performance. Covered KPIs include revenue, total passengers, operating income, customer satisfaction rate etc.Deliver an awe-inspiring pitch with this creative other operational and financial KPIs inspiration pdf. bundle. Topics like total passengers, operating income, revenue, 2017 to 2021 can be discussed with this completely editable template. It is available for immediate download depending on the needs and requirements of the user.
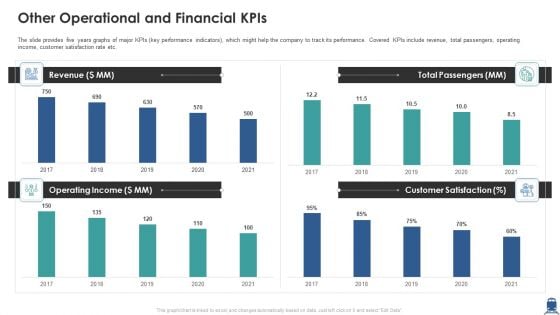
Other Operational And Financial Kpis Information PDF
The slide provides five years graphs of major KPIs key performance indicators, which might help the company to track its performance. Covered KPIs include revenue, total passengers, operating income, customer satisfaction rate etc. Deliver an awe inspiring pitch with this creative other operational and financial kpis information pdf bundle. Topics like revenue, operating income, customer satisfaction can be discussed with this completely editable template. It is available for immediate download depending on the needs and requirements of the user.
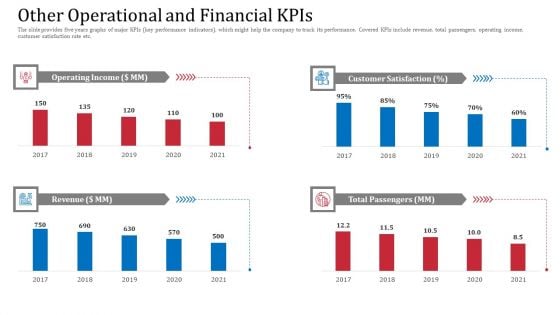
Other Operational And Financial Kpis Demonstration PDF
The slide provides five years graphs of major KPIs key performance indicators, which might help the company to track its performance. Covered KPIs include revenue, total passengers, operating income, customer satisfaction rate etc.Deliver and pitch your topic in the best possible manner with this other operational and financial kpis demonstration pdf. Use them to share invaluable insights on customer satisfaction, operating income, total passengers and impress your audience. This template can be altered and modified as per your expectations. So, grab it now.
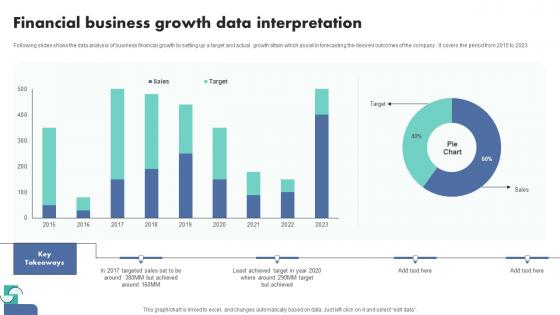
Financial Business Growth Data Interpretation Themes Pdf
Following slides shows the data analysis of business financial growth by setting up a target and actual growth attain which assist in forecasting the desired outcomes of the company . It covers the period from 2015 to 2023.Pitch your topic with ease and precision using this Financial Business Growth Data Interpretation Themes Pdf This layout presents information on Financial Business, Growth Data Interpretation It is also available for immediate download and adjustment. So, changes can be made in the color, design, graphics or any other component to create a unique layout. Following slides shows the data analysis of business financial growth by setting up a target and actual growth attain which assist in forecasting the desired outcomes of the company . It covers the period from 2015 to 2023.
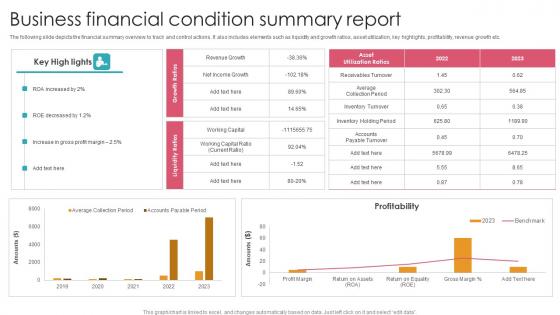
Business Financial Condition Summary Report Graphics Pdf
The following slide depicts the financial summary overview to track and control actions. It also includes elements such as liquidity and growth ratios, asset utilization, key highlights, profitability, revenue growth etc. Pitch your topic with ease and precision using this Business Financial Condition Summary Report Graphics Pdf. This layout presents information on Profitability, Increase Gross Profit Margin, Roe Decreased. It is also available for immediate download and adjustment. So, changes can be made in the color, design, graphics or any other component to create a unique layout. The following slide depicts the financial summary overview to track and control actions. It also includes elements such as liquidity and growth ratios, asset utilization, key highlights, profitability, revenue growth etc.
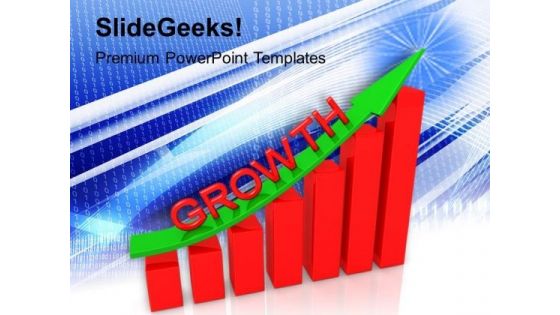
Business Graph Up PowerPoint Templates And PowerPoint Themes 1012
Business Graph Up PowerPoint Templates And PowerPoint Themes 1012-This PowerPoint Template shows the Bar Graph with increasing percentage which signifies the Financial Growth. The Template signifies the concept of Team Work, Team Leader etc. The structure of our templates allows you to effectively highlight the key issues concerning the growth of your business.-Business Graph Up PowerPoint Templates And PowerPoint Themes 1012-This PowerPoint template can be used for presentations relating to-Business graph, success, arrows, business, signs, shapes Disentangle the web with our Business Graph Up PowerPoint Templates And PowerPoint Themes 1012. Seperate the various strands of thought.

Growth Graph Moving Up PowerPoint Templates And PowerPoint Themes 1012
Growth Graph Moving Up PowerPoint Templates And PowerPoint Themes 1012-This PowerPoint Template shows the Bar Graph with increasing percentage which signifies the Financial Growth. The Template signifies the concept of Team Work, Team Leader etc. The structure of our templates allows you to effectively highlight the key issues concerning the growth of your business.-Growth Graph Moving Up PowerPoint Templates And PowerPoint Themes 1012-This PowerPoint template can be used for presentations relating to-Business graph with rising arrow, success, business, arrows, marketing, finance Our Growth Graph Moving Up PowerPoint Templates And PowerPoint Themes 1012 are clear to even the farthest. They are designed for distance.
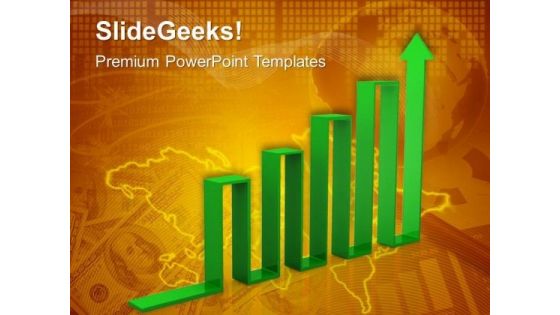
Arrow Graph Success PowerPoint Templates And PowerPoint Themes 1012
Arrow Graph Success PowerPoint Templates And PowerPoint Themes 1012-This PowerPoint Template shows arrow graph with increase. This image signifies the Financial or Business Growth. The Template assumes business concept. Use this template for Global Business. The structure of our templates allows you to effectively highlight the key issues concerning the growth of your business.-Arrow Graph Success PowerPoint Templates And PowerPoint Themes 1012-This PowerPoint template can be used for presentations relating to-Arrow to success, business, marketing, finance, arrows, success Guard against boring presentations with our Arrow Graph Success PowerPoint Templates And PowerPoint Themes 1012. Try us out and see what a difference our templates make.
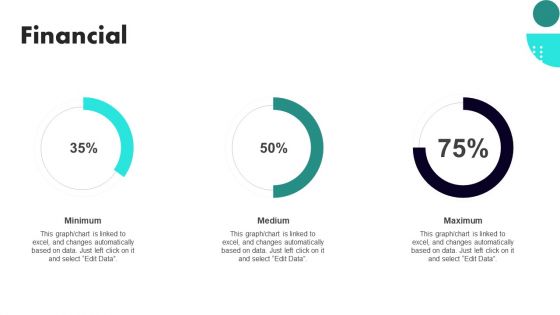
Implementing Client Onboarding Process Financial Topics PDF
Whether you have daily or monthly meetings, a brilliant presentation is necessary. Implementing Client Onboarding Process Financial Topics PDF can be your best option for delivering a presentation. Represent everything in detail using Implementing Client Onboarding Process Financial Topics PDF and make yourself stand out in meetings. The template is versatile and follows a structure that will cater to your requirements. All the templates prepared by Slidegeeks are easy to download and edit. Our research experts have taken care of the corporate themes as well. So, give it a try and see the results.

 Home
Home