Financial Graphs
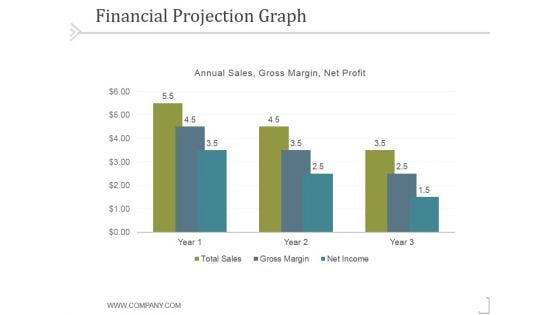
Financial Projection Graph Template 2 Ppt PowerPoint Presentation Template
This is a financial projection graph template 2 ppt powerpoint presentation template. This is a three stage process. The stages in this process are business, strategy, marketing, success, analysis.
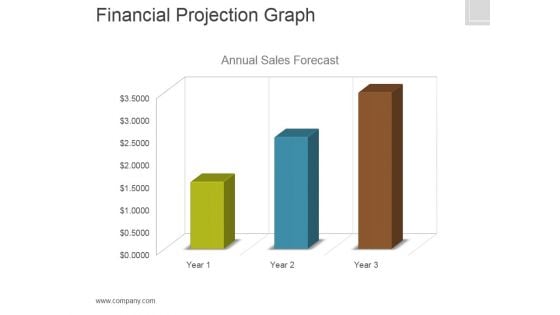
Financial Projection Graph Template 1 Ppt PowerPoint Presentation Clipart
This is a financial projection graph template 1 ppt powerpoint presentation clipart. This is a three stage process. The stages in this process are annual, sales, forecast, finance, marketing.
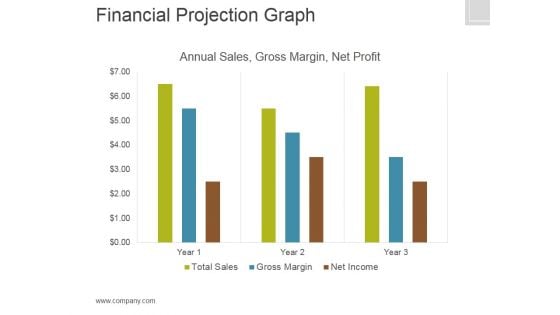
Financial Projection Graph Template 2 Ppt PowerPoint Presentation Graphics
This is a financial projection graph template 2 ppt powerpoint presentation graphics. This is a three stage process. The stages in this process are annual sales, gross margin, net profit, finance.
Financial Growth Graph Vector Icon Ppt PowerPoint Presentation Summary Shapes
Presenting this set of slides with name financial growth graph vector icon ppt powerpoint presentation summary shapes. This is a three stage process. The stages in this process are financial growth graph vector icon. This is a completely editable PowerPoint presentation and is available for immediate download. Download now and impress your audience.
Financial Projection Graph Template 1 Ppt PowerPoint Presentation Icon Summary
This is a financial projection graph template 1 ppt powerpoint presentation icon summary. This is a three stage process. The stages in this process are annual sales forecast, years, business, marketing, management.
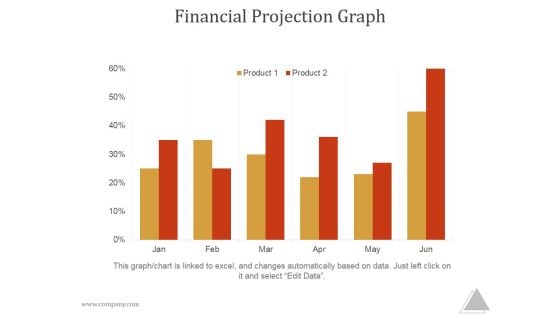
Financial Projection Graph Slide2 Ppt PowerPoint Presentation Themes
This is a financial projection graph slide2 ppt powerpoint presentation themes. This is a five stage process. The stages in this process are year, total sales, gross, margin, net income
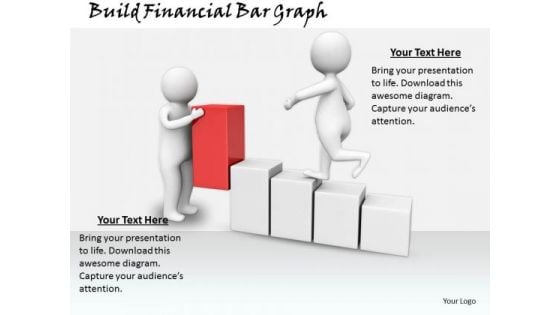
Total Marketing Concepts Build Financial Bar Graph Business Statement
Drink To The Success Of Your Campaign. Our Total Marketing Concepts Build Financial Bar Graph Business Statement Powerpoint Templates Will Raise A Toast. Pass It Around On Our People Powerpoint Templates. Your Audience Will Lap It Up.
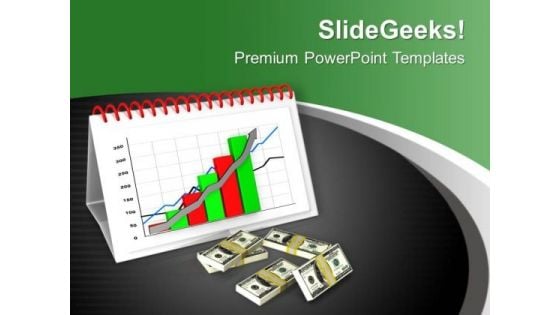
Financial Growth Graph PowerPoint Templates Ppt Backgrounds For Slides 0713
Motivate the disheartened with our Financial Growth Graph PowerPoint Templates PPT Backgrounds For Slides. Inspire them with the goodness in you. Discover decisive moments with our Arrows PowerPoint Templates. They help make that crucial difference. Our Money PowerPoint Templates will help make your dreams come true. Your thoughts will weave the magic for you. Satisfy enquiring minds with our Financial Growth Graph PowerPoint Templates Ppt Backgrounds For Slides 0713. They help you clarify every lingering doubt.
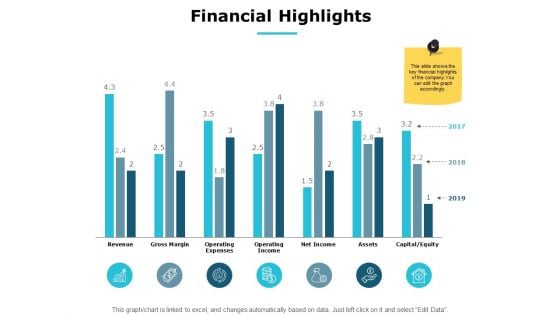
Financial Highlights Graph Ppt PowerPoint Presentation Ideas Good
Presenting this set of slides with name financial highlights graph ppt powerpoint presentation ideas good. This is a six stage process. The stages in this process are finance, marketing, management, investment, analysis. This is a completely editable PowerPoint presentation and is available for immediate download. Download now and impress your audience.
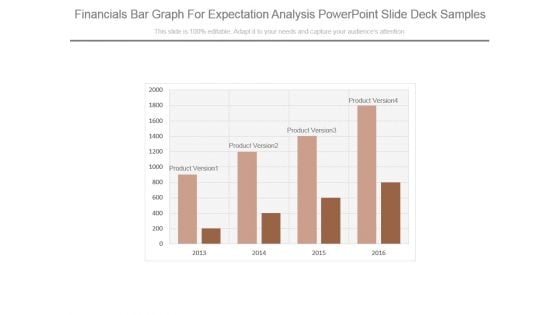
Financials Bar Graph For Expectation Analysis Powerpoint Slide Deck Samples
This is a financials bar graph for expectation analysis powerpoint slide deck samples. This is a four stage process. The stages in this process are product version.
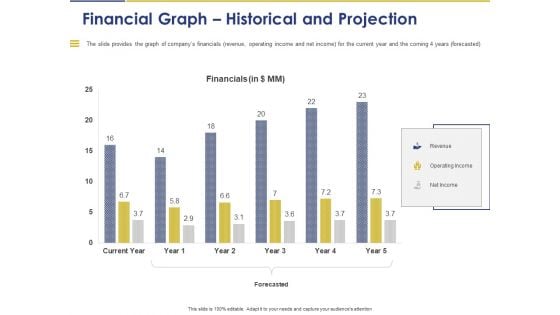
Convertible Note Pitch Deck Funding Strategy Financial Graph Historical And Projection Ppt PowerPoint Presentation Infographics Layouts PDF
Presenting this set of slides with name convertible note pitch deck funding strategy financial graph historical and projection ppt powerpoint presentation infographics layouts pdf. The topics discussed in these slides are financials, revenue, operating income, net income, forecasted. This is a completely editable PowerPoint presentation and is available for immediate download. Download now and impress your audience.
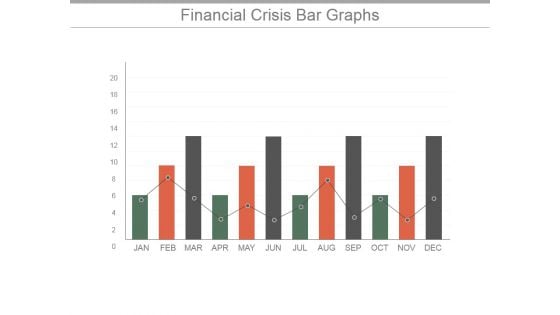
Financial Crisis Bar Graphs Ppt PowerPoint Presentation Background Images
This is a financial crisis bar graphs ppt powerpoint presentation background images. This is a twelve stage process. The stages in this process are business, analysis, strategy, finance, success, management.
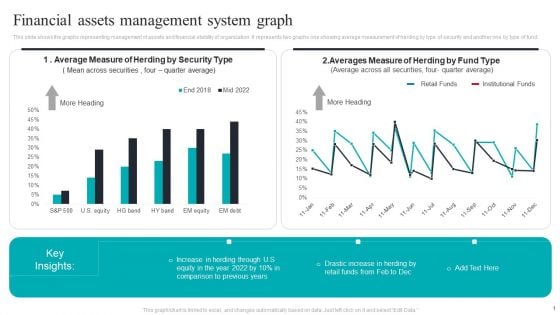
Financial Assets Management System Graph Structure PDF
This slide shows the graphs representing management of assets and financial stability of organization. It represents two graphs one showing average measurement of herding by type of security and another one by type of fund. Pitch your topic with ease and precision using this Financial Assets Management System Graph Structure PDF. This layout presents information on Financial Assets, Management System Graph. It is also available for immediate download and adjustment. So, changes can be made in the color, design, graphics or any other component to create a unique layout.
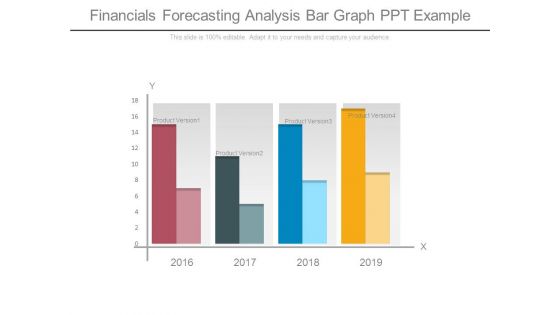
Financials Forecasting Analysis Bar Graph Ppt Example
This is a financials forecasting analysis bar graph ppt example. This is a four stage process. The stages in this process are product version.
Bar Graph Financial Sales Product Ppt PowerPoint Presentation Icon Vector
This is a bar graph financial sales product ppt powerpoint presentation icon vector. This is a five stage process. The stages in this process are business, management, financial, marketing, sales.

Bar Graph Financial Success PowerPoint Templates And PowerPoint Themes 0412
Microsoft Powerpoint Templates and Background with bar graph Experience the striking graphics of our Bar Graph Financial Success PowerPoint Templates And PowerPoint Themes 0412. They bring good quality to the table.
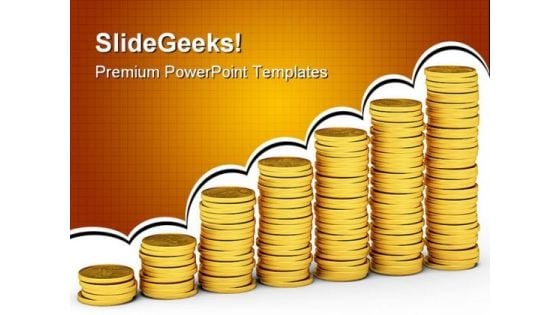
Money Graph Financial Business PowerPoint Templates And PowerPoint Backgrounds 0111
Microsoft PowerPoint Template and Background with many gold coins lying in piles They say appropriate facial expressions aid communication. Our Money Graph Financial Business PowerPoint Templates And PowerPoint Backgrounds 0111 can be effective too.
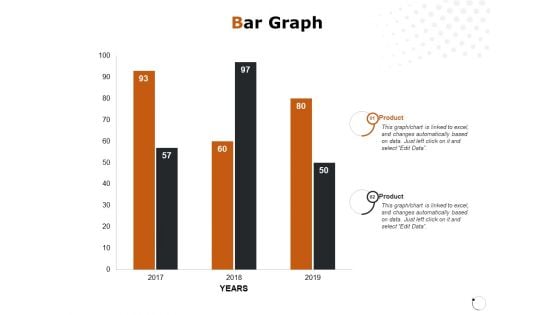
Bar Graph Financial Ppt PowerPoint Presentation Professional Master Slide
Presenting this set of slides with name bar graph financial ppt powerpoint presentation professional master slide. The topics discussed in these slides are bar graph, product, year, finance, marketing. This is a completely editable PowerPoint presentation and is available for immediate download. Download now and impress your audience.
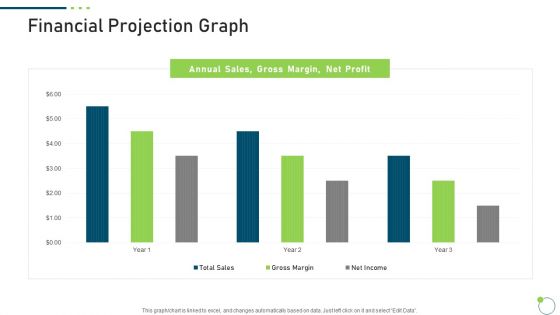
Investor Pitch Deck New Venture Capital Raising Financial Projection Graph Demonstration PDF
Deliver an awe inspiring pitch with this creative investor pitch deck new venture capital raising financial projection graph demonstration pdf bundle. Topics like financial projection graph can be discussed with this completely editable template. It is available for immediate download depending on the needs and requirements of the user.
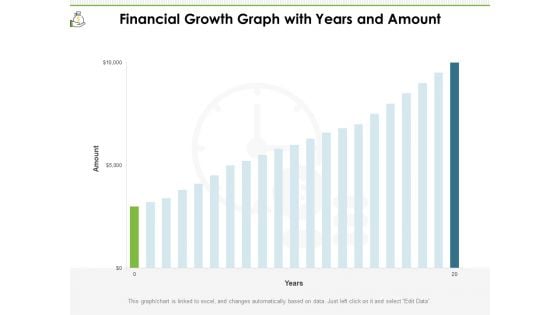
Financial Growth Graph With Years And Amount Ppt PowerPoint Presentation File Microsoft PDF
Presenting this set of slides with name financial growth graph with years and amount ppt powerpoint presentation file microsoft pdf. The topics discussed in these slide is financial growth graph with years and amount. This is a completely editable PowerPoint presentation and is available for immediate download. Download now and impress your audience.
Financial Line Graph Vector Icon Ppt PowerPoint Presentation Infographic Template Mockup
Presenting this set of slides with name financial line graph vector icon ppt powerpoint presentation infographic template mockup. This is a three stage process. The stages in this process are financial line graph vector icon. This is a completely editable PowerPoint presentation and is available for immediate download. Download now and impress your audience.
Financial Loss Graph Vector Icon Ppt PowerPoint Presentation Infographic Template Layouts PDF
Presenting this set of slides with name financial loss graph vector icon ppt powerpoint presentation infographic template layouts pdf. This is a three stage process. The stages in this process are financial loss graph vector icon. This is a completely editable PowerPoint presentation and is available for immediate download. Download now and impress your audience.
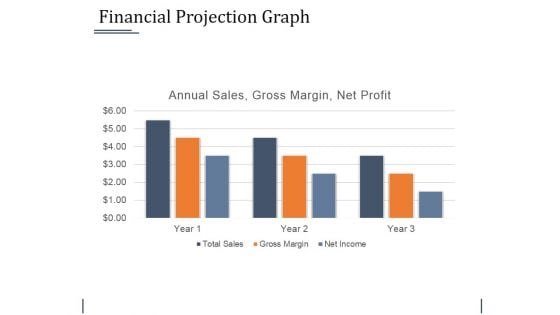
Financial Projection Graph Template 1 Ppt PowerPoint Presentation Professional Example Introduction
This is a financial projection graph template 1 ppt powerpoint presentation professional example introduction. This is a three stage process. The stages in this process are business, bar graph, finance, marketing, strategy, analysis.
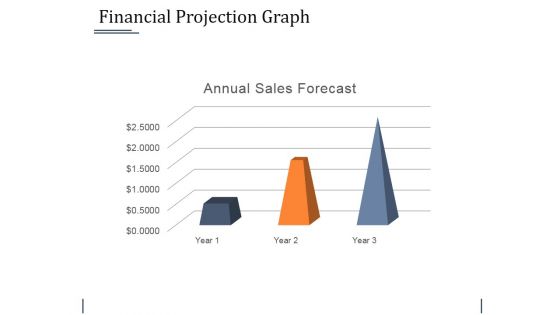
Financial Projection Graph Template 2 Ppt PowerPoint Presentation Infographic Template Gallery
This is a financial projection graph template 2 ppt powerpoint presentation infographic template gallery. This is a three stage process. The stages in this process are business, bar graph, finance, marketing, strategy, analysis.

Stock Photo Modern Marketing Concepts See The Financial Bar Graph Business Images
Be The Dramatist With Our Stock Photo Modern Marketing Concepts See The Financial Bar Graph Business Images Powerpoint Templates. Script Out The Play Of Words. Put Our sales Powerpoint Templates Into The Draw. Your Thoughts Will Win The Lottery.

Financial Bar Graph Discussion With Team PowerPoint Templates Ppt Backgrounds For Slides 0513
Draw on the experience of our Financial Bar Graph Discussion With Team PowerPoint Templates PPT Backgrounds For Slides. They imbibe from past masters. Drink the nectar of our people PowerPoint Templates. Give your thoughts a long life. Draw it out on our teamwork PowerPoint Templates. Provide inspiration to your colleagues. You've found a treasure for presentations. Get goingwith our Financial Bar Graph Discussion With Team PowerPoint Templates Ppt Backgrounds For Slides 0513. You'll deliver your best presentation yet.
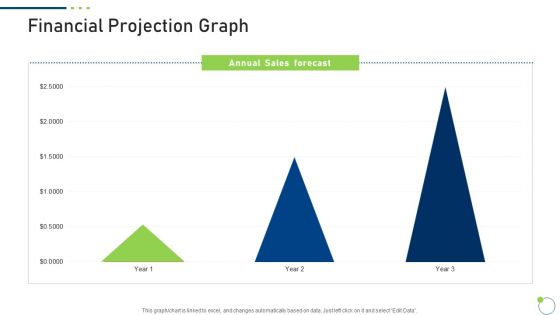
Investor Pitch Deck New Venture Capital Raising Financial Projection Graph Slide2 Portrait PDF
Deliver and pitch your topic in the best possible manner with this investor pitch deck new venture capital raising financial projection graph slide2 portrait pdf. Use them to share invaluable insights on annual sales, gross margin, net profit and impress your audience. This template can be altered and modified as per your expectations. So, grab it now.
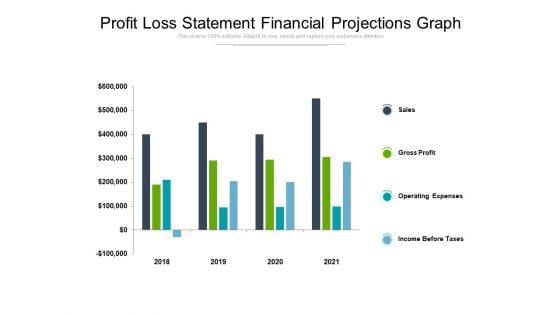
Profit Loss Statement Financial Projections Graph Ppt PowerPoint Presentation Summary Slides
Presenting this set of slides with name profit loss statement financial projections graph ppt powerpoint presentation summary slides. The topics discussed in these slides are sales, gross profit, operating expenses, income before taxes. This is a completely editable PowerPoint presentation and is available for immediate download. Download now and impress your audience.
Gold Investment And Financial Growth Graph Ppt PowerPoint Presentation Pictures Background
Presenting this set of slides with name gold investment and financial growth graph ppt powerpoint presentation pictures background. This is a one stage process. The stages in this process are gold bar, gold investment, financial growth. This is a completely editable PowerPoint presentation and is available for immediate download. Download now and impress your audience.
Stock Photo Business Strategy Plan Build New Financial Bar Graph Success Images
Your Grasp Of Economics Is Well Known. Help Your Audience Comprehend Issues With Our Stock Photo Business Strategy Plan Build New Financial Bar Graph Success Images Powerpoint Templates. Strike A Bargain With Our sales Powerpoint Templates. Your Thoughts Will Get A Winning Deal.
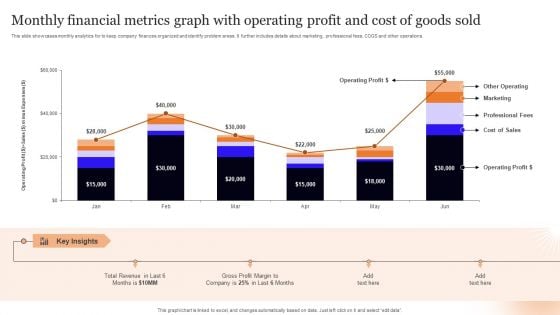
Monthly Financial Metrics Graph With Operating Profit And Cost Of Goods Sold Pictures PDF
This slide showcases monthly analytics for to keep company finances organized and identify problem areas. It further includes details about marketing, professional fees, COGS and other operations. Pitch your topic with ease and precision using this Monthly Financial Metrics Graph With Operating Profit And Cost Of Goods Sold Pictures PDF. This layout presents information on Key Insights, Operating Profit, Total Revenue. It is also available for immediate download and adjustment. So, changes can be made in the color, design, graphics or any other component to create a unique layout.
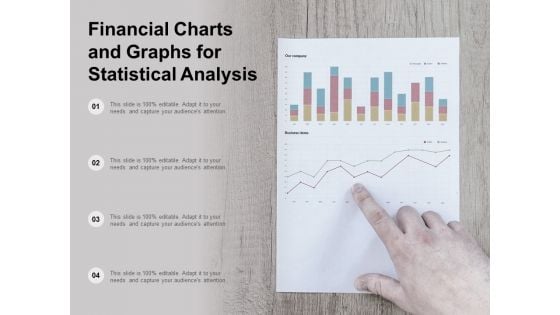
Financial Charts And Graphs For Statistical Analysis Ppt Powerpoint Presentation Show Layout
This is a financial charts and graphs for statistical analysis ppt powerpoint presentation show layout. This is a four stage process. The stages in this process are business metrics, business kpi, business dashboard.
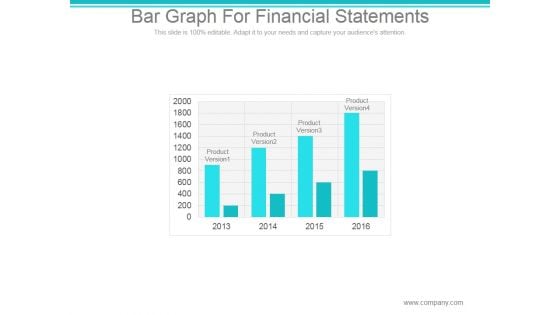
Bar Graph For Financial Statements Ppt PowerPoint Presentation Example
This is a bar graph for financial statements ppt powerpoint presentation example. This is a four stage process. The stages in this process are product version, finance, year.
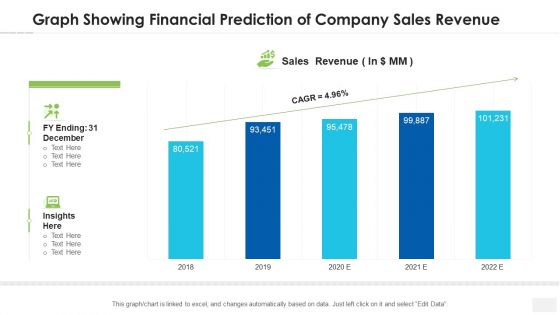
Graph Showing Financial Prediction Of Company Sales Revenue Topics PDF
Pitch your topic with ease and precision using this graph showing financial prediction of company sales revenue topics pdf. This layout presents information on graph showing financial prediction of company sales revenue. It is also available for immediate download and adjustment. So, changes can be made in the color, design, graphics or any other component to create a unique layout.
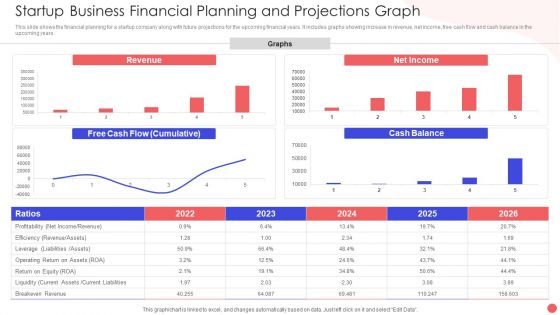
Startup Business Financial Planning And Projections Graph Slides PDF
This slide shows the financial planning for a startup company along with future projections for the upcoming financial years. It includes graphs showing increase in revenue, net income, free cash flow and cash balance in the upcoming years. Pitch your topic with ease and precision using this Startup Business Financial Planning And Projections Graph Slides PDF. This layout presents information on Revenue Graphs Operating, Free Cash Flow, Net Income Ration. It is also available for immediate download and adjustment. So, changes can be made in the color, design, graphics or any other component to create a unique layout.
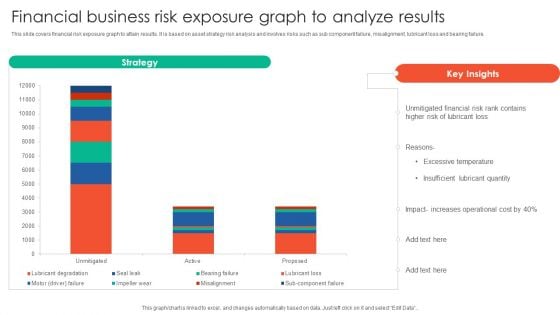
Financial Business Risk Exposure Graph To Analyze Results Elements PDF
This slide covers financial risk exposure graph to attain results. It is based on asset strategy risk analysis and involves risks such as sub component failure, misalignment, lubricant loss and bearing failure. Pitch your topic with ease and precision using this Financial Business Risk Exposure Graph To Analyze Results Elements PDF. This layout presents information on Strategy, Unmitigated Financial, Risk Rank Contains. It is also available for immediate download and adjustment. So, changes can be made in the color, design, graphics or any other component to create a unique layout.
Bar Graph With Financial Ratio And Icons Powerpoint Template
Visually support your presentation with our above template containing bar graph with icons. This diagram slide helps to exhibit financial ratio analysis. Etch your views in the brains of your audience with this diagram slide.
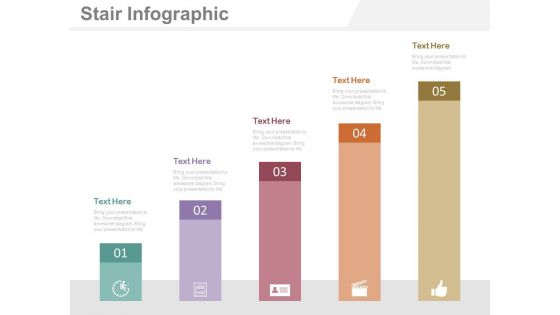
Five Steps Bar Graph For Financial Management Powerpoint Slides
This PowerPoint template has been designed with five steps bar graph and icons. This diagram is useful to exhibit financial management. This diagram slide can be used to make impressive presentations.
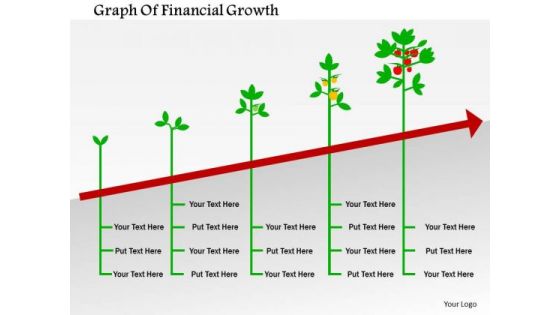
Business Diagram Graph Of Financial Growth Presentation Template
Tree design bar graph has been used to craft this power point template diagram. This PPT contains the concept of financial growth. Use this PPT diagram for finance and business related presentations.
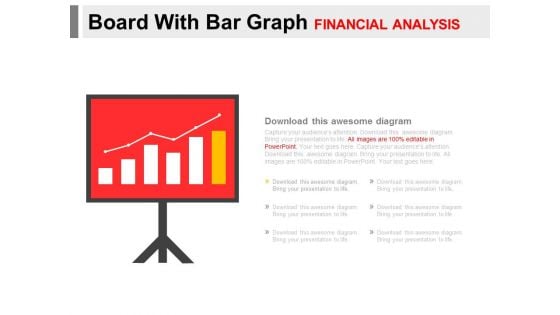
Board With Bar Graph For Financial Analysis Powerpoint Slides
You can download this PowerPoint template to display statistical data and analysis. This PPT slide contains display board with bar graph. Draw an innovative business idea using this professional diagram.
Financial Yearly Forecast Icon With Graph And Checklist Summary PDF
Presenting Financial Yearly Forecast Icon With Graph And Checklist Summary PDF to dispense important information. This template comprises Three stages. It also presents valuable insights into the topics including Financial Yearly Forecast, Graph And Checklist . This is a completely customizable PowerPoint theme that can be put to use immediately. So, download it and address the topic impactfully.
Statistical Data Graph Icon Showing Financial Forecast Rules PDF
Presenting statistical data graph icon showing financial forecast rules pdf to dispense important information. This template comprises four stages. It also presents valuable insights into the topics including statistical data graph icon showing financial forecast. This is a completely customizable PowerPoint theme that can be put to use immediately. So, download it and address the topic impactfully.
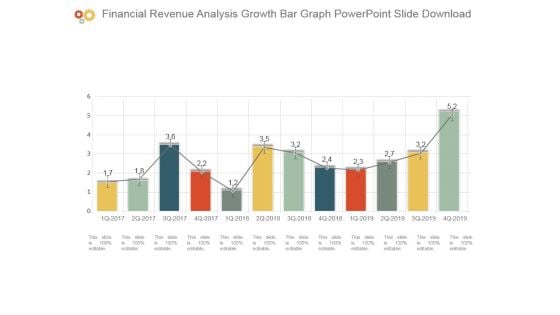
Financial Revenue Analysis Growth Bar Graph Powerpoint Slide Download
This is a financial revenue analysis growth bar graph powerpoint slide download. This is a twelve stage process. The stages in this process are bar graph, business, marketing, growth, success.
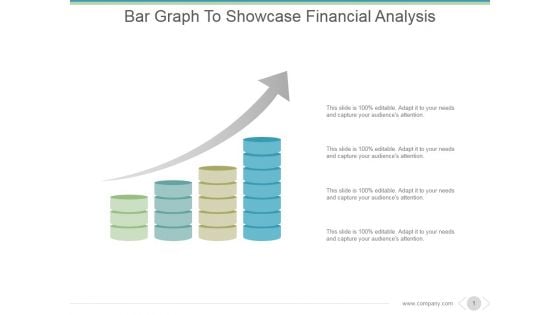
Bar Graph To Showcase Financial Analysis Ppt PowerPoint Presentation Professional
This is a bar graph to showcase financial analysis ppt powerpoint presentation professional. This is a four stage process. The stages in this process are business, marketing, growth, success, arrows.
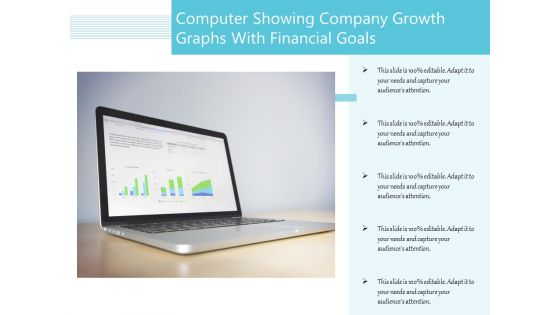
Computer Showing Company Growth Graphs With Financial Goals Ppt PowerPoint Presentation File Design Ideas PDF
Presenting this set of slides with name computer showing company growth graphs with financial goals ppt powerpoint presentation file design ideas pdf. This is a one stage process. The stages in this process are computer showing company growth graphs with financial goals. This is a completely editable PowerPoint presentation and is available for immediate download. Download now and impress your audience.
Financial Market Fluctuations Graph Vector Icon Ppt PowerPoint Presentation Summary Inspiration
Presenting this set of slides with name financial market fluctuations graph vector icon ppt powerpoint presentation summary inspiration. This is a one stage process. The stages in this process are financial market fluctuations graph vector icon. This is a completely editable PowerPoint presentation and is available for immediate download. Download now and impress your audience.
Business Financial Growth Bar Graph With Dollar Symbol Icon Ppt PowerPoint Presentation File Ideas PDF
Persuade your audience using this business financial growth bar graph with dollar symbol icon ppt powerpoint presentation file ideas pdf. This PPT design covers one stages, thus making it a great tool to use. It also caters to a variety of topics including business financial growth bar graph with dollar symbol icon. Download this PPT design now to present a convincing pitch that not only emphasizes the topic but also showcases your presentation skills.
Financial Gain Growth Graph Vector Icon Ppt Powerpoint Presentation File Show
This is a financial gain growth graph vector icon ppt powerpoint presentation file show. The topics discussed in this diagram are increase icon, improved icon, growth icon. This is a completely editable PowerPoint presentation, and is available for immediate download.
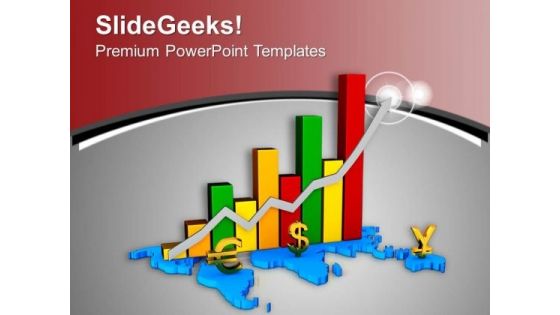
Global Financial Growth Bar Graph PowerPoint Templates Ppt Backgrounds For Slides 0713
Highlight your drive with our Global Financial Growth Bar Graph PowerPoint Templates PPT Backgrounds For Slides. Prove the fact that you have control. Go the distance with our Arrows PowerPoint Templates. Maintain the pace till the end. Draw on the energy of our Success PowerPoint Templates. Your thoughts will perk up. Perfect your presentations with our Global Financial Growth Bar Graph PowerPoint Templates Ppt Backgrounds For Slides 0713. Download without worries with our money back guaranteee.
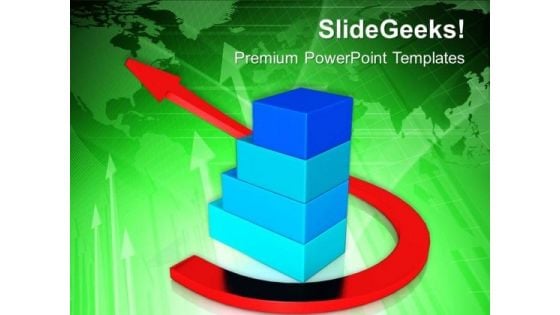
Growing Bar Graph Financial Business Strategy PowerPoint Templates Ppt Backgrounds For Slides 0313
We present our Growing Bar Graph Financial Business Strategy PowerPoint Templates PPT Backgrounds For Slides 0313.Present our Finance PowerPoint Templates because You are an avid believer in ethical practices. Highlight the benefits that accrue with our PowerPoint Templates and Slides. Present our Business PowerPoint Templates because They will bring a lot to the table. Their alluring flavours will make your audience salivate. Download our Marketing PowerPoint Templates because Our PowerPoint Templates and Slides are focused like a searchlight beam. They highlight your ideas for your target audience. Use our Arrows PowerPoint Templates because You have gained great respect for your brilliant ideas. Use our PowerPoint Templates and Slides to strengthen and enhance your reputation. Use our Success PowerPoint Templates because Our PowerPoint Templates and Slides ensures Effective communication. They help you put across your views with precision and clarity.Use these PowerPoint slides for presentations relating to Bar graph business financial concept, finance, business, marketing, success, arrows. The prominent colors used in the PowerPoint template are Red, Blue, Green. With our Growing Bar Graph Financial Business Strategy PowerPoint Templates Ppt Backgrounds For Slides 0313 fear is never a factor. Do not allow adversity to effect you.
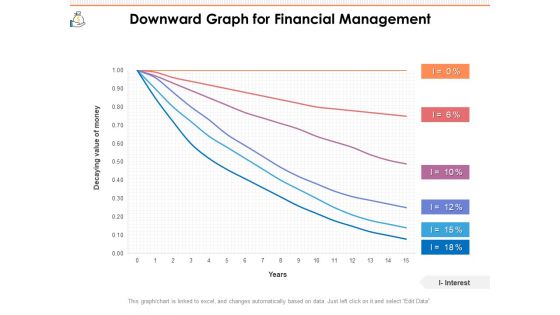
Downward Graph For Financial Management Ppt PowerPoint Presentation File Picture PDF
Presenting this set of slides with name downward graph for financial management ppt powerpoint presentation file picture pdf. The topics discussed in these slide is downward graph for financial management. This is a completely editable PowerPoint presentation and is available for immediate download. Download now and impress your audience.
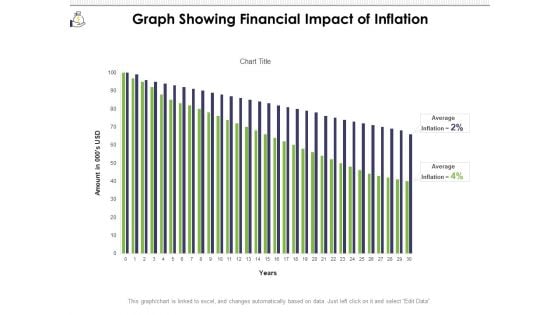
Graph Showing Financial Impact Of Inflation Ppt PowerPoint Presentation File Graphics Tutorials PDF
Presenting this set of slides with name graph showing financial impact of inflation ppt powerpoint presentation file graphics tutorials pdf. The topics discussed in these slide is graph showing financial impact of inflation. This is a completely editable PowerPoint presentation and is available for immediate download. Download now and impress your audience.
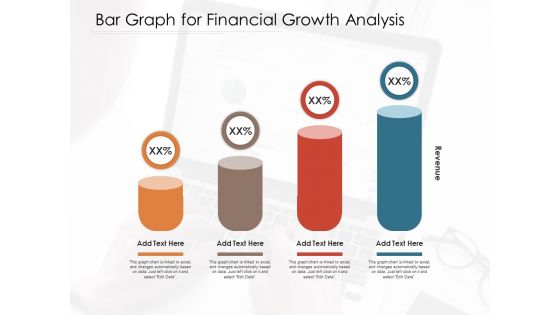
Bar Graph For Financial Growth Analysis Ppt PowerPoint Presentation Gallery Background Images PDF
Presenting this set of slides with name bar graph for financial growth analysis ppt powerpoint presentation gallery background images pdf. The topics discussed in these slide is bar graph for financial growth analysis. This is a completely editable PowerPoint presentation and is available for immediate download. Download now and impress your audience.
Financial R2R Icon With Graph And Chart Ppt PowerPoint Presentation Slides Design Inspiration PDF
Presenting Financial R2R Icon With Graph And Chart Ppt PowerPoint Presentation Slides Design Inspiration PDF to dispense important information. This template comprises three stages. It also presents valuable insights into the topics including Financial R2r Icon, Graph Chart. This is a completely customizable PowerPoint theme that can be put to use immediately. So, download it and address the topic impactfully.
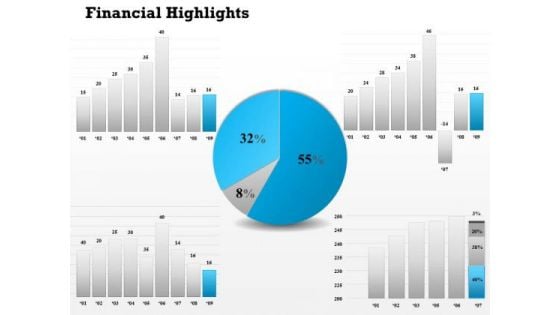
Consulting Diagram Financial Pie And Bar Graph Diagram Business Cycle Diagram
Doll Up Your Thoughts With Our Consulting Diagram Financial Pie And Bar Graph Diagram Business Cycle Diagram Powerpoint Templates. They Will Make A Pretty Picture. They Say A Dog Is Man's Best Friend. Our Consulting Diagram Financial Pie And Bar Graph Diagram Business Cycle Diagram Powerpoint Templates Come A Close Second.
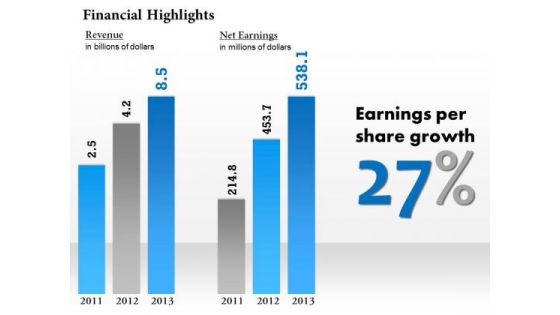
Sales Diagram Financial Result Display Bar Graph Diagram Business Framework Model
Our Sales Diagram Financial Result Display Bar Graph Diagram Business Framework Model Powerpoint Templates Deliver At Your Doorstep. Let Them In For A Wonderful Experience. Dig Out The Dope With Our Sales Diagram Financial Result Display Bar Graph Diagram Business Framework Model Powerpoint Templates. Your Thoughts Will Expose The Truth.
Financial Document With Bar Graph Vector Icon Ppt PowerPoint Presentation Model Layout PDF
Presenting this set of slides with name financial document with bar graph vector icon ppt powerpoint presentation model layout pdf. This is a three stage process. The stages in this process are financial document with bar graph vector icon. This is a completely editable PowerPoint presentation and is available for immediate download. Download now and impress your audience.
Good Financial Position Shown With Graph Ppt PowerPoint Presentation Model Elements PDF
Presenting good financial position shown with graph ppt powerpoint presentation model elements pdf to dispense important information. This template comprises two stages. It also presents valuable insights into the topics including good financial position shown with graph. This is a completely customizable PowerPoint theme that can be put to use immediately. So, download it and address the topic impactfully.
Bar Chart And Pie Graph For Financial Planning Ppt PowerPoint Presentation Infographics Graphics Example PDF
Presenting bar chart and pie graph for financial planning ppt powerpoint presentation infographics graphics example pdf. to dispense important information. This template comprises four stages. It also presents valuable insights into the topics including bar chart and pie graph for financial planning. This is a completely customizable PowerPoint theme that can be put to use immediately. So, download it and address the topic impactfully.
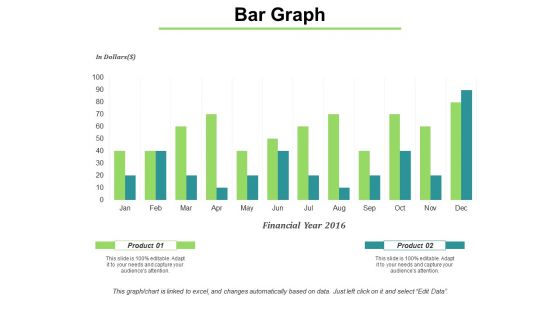
Bar Graph Shows Financial Values Ppt PowerPoint Presentation Infographic Template Gridlines
This is a bar graph shows financial values ppt powerpoint presentation infographic template gridlines. This is a two stage process. The stages in this process are bar, marketing, strategy, finance, planning.

 Home
Home