Fishbone Timeline
The Fishbone Analysis Tool Timeline Ppt Show Guidelines PDF
This is a the fishbone analysis tool timeline ppt show guidelines pdf template with various stages. Focus and dispense information on five stages using this creative set, that comes with editable features. It contains large content boxes to add your information on topics like timeline, 2016 to 2020. You can also showcase facts, figures, and other relevant content using this PPT layout. Grab it now.
Fishbone Ishikawa Cause And Effect Analysis Timeline Ppt PowerPoint Presentation Layouts Graphics PDF
Presenting this set of slides with name fishbone ishikawa cause and effect analysis timeline ppt powerpoint presentation layouts graphics pdf. This is a five stage process. The stages in this process are timeline, 2016 to 2020. This is a completely editable PowerPoint presentation and is available for immediate download. Download now and impress your audience.
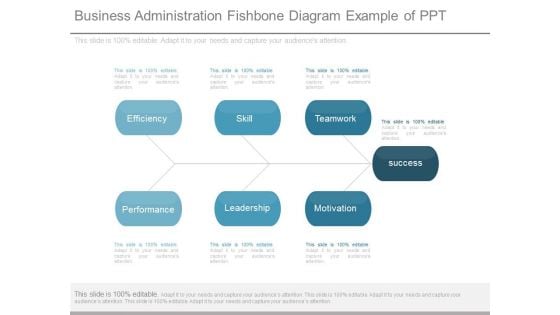
Business Administration Fishbone Diagram Example Of Ppt
This is a business administration fishbone diagram example of ppt. This is a seven stage process. The stages in this process are efficiency, skill, teamwork, performance, leadership, motivation, success.
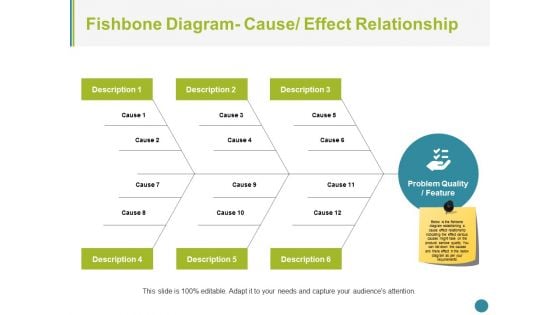
Fishbone Diagram Cause Effect Relationship Ppt PowerPoint Presentation Styles Files
This is a Fishbone Diagram Cause Effect Relationship Ppt PowerPoint Presentation Styles Files. This is a six stage process. The stages in this process are fishbone, management, strategy, analysis, business.
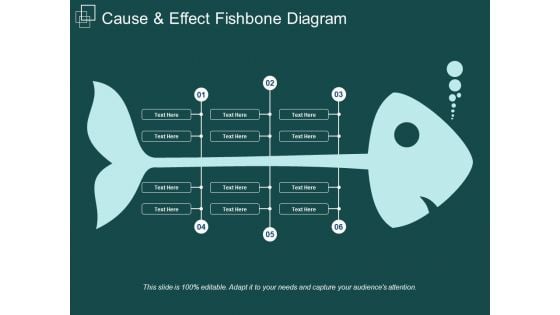
Cause And Effect Fishbone Diagram Ppt Powerpoint Presentation Images
This is a cause and effect fishbone diagram ppt powerpoint presentation images. This is a six stage process. The stages in this process are action and reaction, causality, causes and effects.
Fishbone Diagram Cause Effective Relationship Ppt PowerPoint Presentation Icon Portrait
This is a fishbone diagram cause effective relationship ppt powerpoint presentation icon portrait. This is a six stage process. The stages in this process are description, cause, problem quality feature.
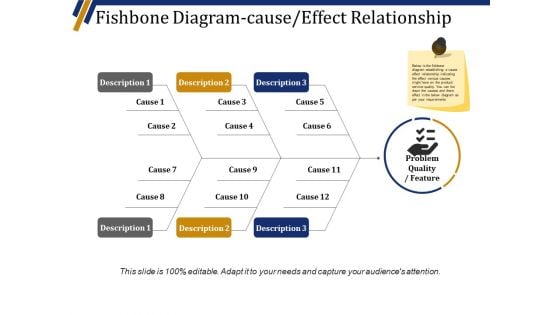
Fishbone Diagram Cause Effect Relationship Ppt PowerPoint Presentation Layouts Maker
This is a fishbone diagram cause effect relationship ppt powerpoint presentation layouts maker. This is a three stage process. The stages in this process are description, cause, problem quality feature, business, management.
Fishbone Diagram Cause Effect Relationship Ppt PowerPoint Presentation Slides Icon
This is a fishbone diagram cause effect relationship ppt powerpoint presentation slides icon. This is a six stage process. The stages in this process are description, cause, problem quality feature, icon, business.
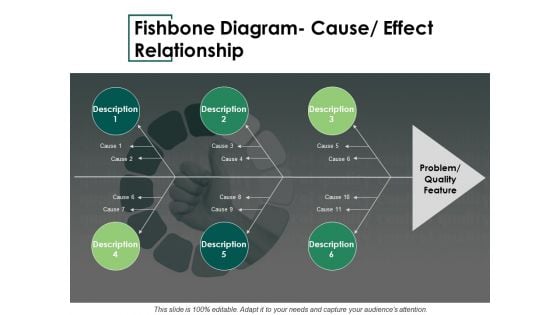
Fishbone Diagram Cause Effect Relationship Ppt PowerPoint Presentation Infographics Slideshow
This is a fishbone diagram cause effect relationship ppt powerpoint presentation infographics slideshow. This is a six stage process. The stages in this process are description, cause, problem quality feature.
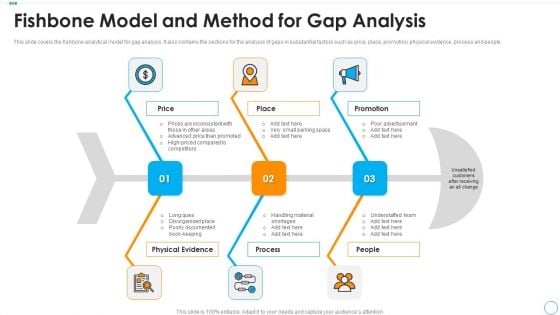
Fishbone Model And Method For Gap Analysis Elements PDF
This slide covers the fishbone analytical model for gap analysis. It also contains the sections for the analysis of gaps in substantial factors such as price, place, promotion, physical evidence, process and people. Persuade your audience using this fishbone model and method for gap analysis elements pdf. This PPT design covers three stages, thus making it a great tool to use. It also caters to a variety of topics including physical evidence, process, people. Download this PPT design now to present a convincing pitch that not only emphasizes the topic but also showcases your presentation skills.
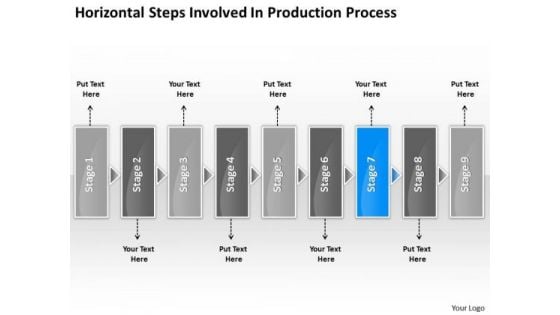
Horizontal Steps Involved Production Processs Fishbone Chart PowerPoint Templates
We present our horizontal steps involved production processs fishbone chart PowerPoint templates.Download and present our Arrows PowerPoint Templates because they are the stepping stones of our journey till date. Download our Shapes PowerPoint Templates because this business powerpoint template helps expound on the logic of your detailed thought process to take your company forward. Use our Business PowerPoint Templates because they highlight the depth of your thought process. Download our Boxes PowerPoint Templates because you can enlighten your skills with the help of our topical templates. Download and present our Communication PowerPoint Templates because the plans are in your head, stage by stage, year by year.Use these PowerPoint slides for presentations relating to abstract, arrow, blank, business, chart, circular, circulation, concept, conceptual, design, diagram, executive, flow, horizontal, icon, idea, illustration, management, model, numbers, organization, process, progression, resource, sequence, stages, steps, strategy. The prominent colors used in the PowerPoint template are Blue, Gray, Black. The feedback we get is that our horizontal steps involved production processs fishbone chart PowerPoint templates are Wonderful. PowerPoint presentation experts tell us our conceptual PowerPoint templates and PPT Slides are Fabulous. People tell us our horizontal steps involved production processs fishbone chart PowerPoint templates are visually appealing. Professionals tell us our concept PowerPoint templates and PPT Slides are Exuberant. You can be sure our horizontal steps involved production processs fishbone chart PowerPoint templates are Wonderful. We assure you our business PowerPoint templates and PPT Slides are Beautiful. Concentrate on the assignment with our Horizontal Steps Involved Production Processs Fishbone Chart PowerPoint Templates. Don't give a fig about other issues.
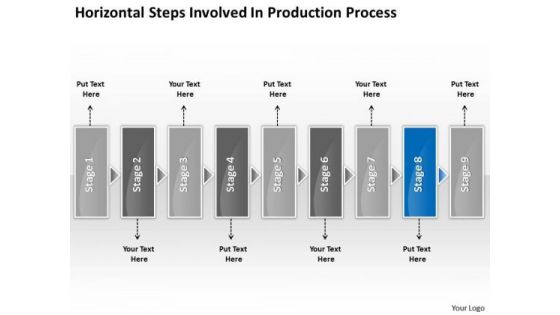
Horizontal Steps Involved Production Processs Business Fishbone Chart PowerPoint Templates
We present our horizontal steps involved production processs business fishbone chart PowerPoint templates.Download and present our Arrows PowerPoint Templates because this layout helps you to see satisfaction spread across the room as they unravel your gifted views. Use our Shapes PowerPoint Templates because you should take your team soaring to the pinnacle they crave. Present our Business PowerPoint Templates because this is the unerring accuracy in reaching the target. the effortless ability to launch into flight. Use our Boxes PowerPoint Templates because your listeners do not have to put on their thinking caps. Download our Communication PowerPoint Templates because you can gain the success to desired levels in one go.Use these PowerPoint slides for presentations relating to abstract, arrow, blank, business, chart, circular, circulation, concept, conceptual, design, diagram, executive, flow, horizontal, icon, idea, illustration, management, model, numbers, organization, process, progression, resource, sequence, stages, steps, strategy. The prominent colors used in the PowerPoint template are Blue, Gray, Black. The feedback we get is that our horizontal steps involved production processs business fishbone chart PowerPoint templates are Magnificent. PowerPoint presentation experts tell us our chart PowerPoint templates and PPT Slides are Elegant. People tell us our horizontal steps involved production processs business fishbone chart PowerPoint templates are Nice. Professionals tell us our circulation PowerPoint templates and PPT Slides are Colorful. You can be sure our horizontal steps involved production processs business fishbone chart PowerPoint templates are Fun. We assure you our concept PowerPoint templates and PPT Slides are designed by a team of presentation professionals. Present top flight leadership competencies with our Horizontal Steps Involved Production Processs Business Fishbone Chart PowerPoint Templates. They will make you look good.
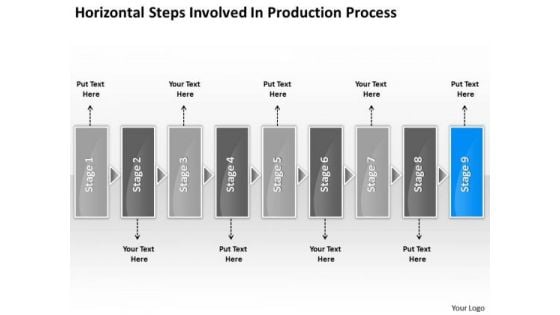
Horizontal Steps Involved Production Processs Flowchart Fishbone Chart PowerPoint Templates
We present our horizontal steps involved production processs flowchart fishbone chart PowerPoint templates.Download our Arrows PowerPoint Templates because the gears of youthful minds are useful, therefore set them in motion. Download and present our Shapes PowerPoint Templates because this is Aesthetically designed to make a great first impression this template highlights . Download our Business PowerPoint Templates because you can Flutter your wings and enchant the world. Impress them with the innate attractiveness of your thoughts and words. Download and present our Boxes PowerPoint Templates because you will be able to Highlight the various ways in which we can maintain its efficiency. Present our Communication PowerPoint Templates because if making a mark is your obsession, then let others get Obsessed with you.Use these PowerPoint slides for presentations relating to abstract, arrow, blank, business, chart, circular, circulation, concept, conceptual, design, diagram, executive, flow, horizontal, icon, idea, illustration, management, model, numbers, organization, process, progression, resource, sequence, stages, steps, strategy. The prominent colors used in the PowerPoint template are Blue, Gray, Black. The feedback we get is that our horizontal steps involved production processs flowchart fishbone chart PowerPoint templates are Tasteful. PowerPoint presentation experts tell us our business PowerPoint templates and PPT Slides are Second to none. People tell us our horizontal steps involved production processs flowchart fishbone chart PowerPoint templates are Fun. Professionals tell us our blank PowerPoint templates and PPT Slides are Tasteful. You can be sure our horizontal steps involved production processs flowchart fishbone chart PowerPoint templates are specially created by a professional team with vast experience. They diligently strive to come up with the right vehicle for your brilliant Ideas. We assure you our chart PowerPoint templates and PPT Slides are Reminiscent. Our Horizontal Steps Involved Production Processs Flowchart Fishbone Chart PowerPoint Templates will give you the right feeling. You will be sure you have made the right choice.
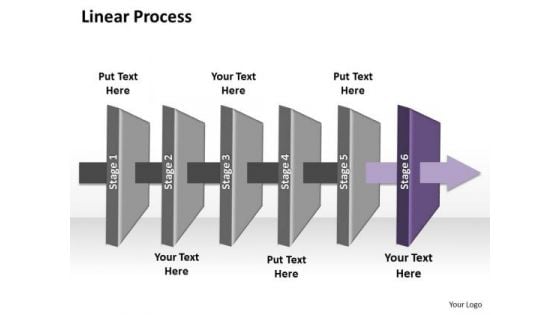
Ppt Linear Process Marketing Startegy Free Fishbone Diagram PowerPoint Template Templates
PPT linear process marketing startegy free fishbone diagram powerpoint template Templates-Use this linear process diagram to show stages in marketing Process. Clarity of thought has been the key to your growth. Use our template to illustrate your ability-PPT linear process marketing startegy free fishbone diagram powerpoint template Templates-3d, Air, Arrow, Art, Business, Chart, Clip, Clipart, Cooling, Diagram, Drip, Drop, Dry, Energy, Eps10, Evaporate, Evaporating, Evaporation, Graphic, Heat, Icon, Illustration, Isolated, Isometric, Layers, Material, Moisture, Process Field your thoughts with our Ppt Linear Process Marketing Startegy Free Fishbone Diagram PowerPoint Template Templates. They will make an enormous contribution to your effort.
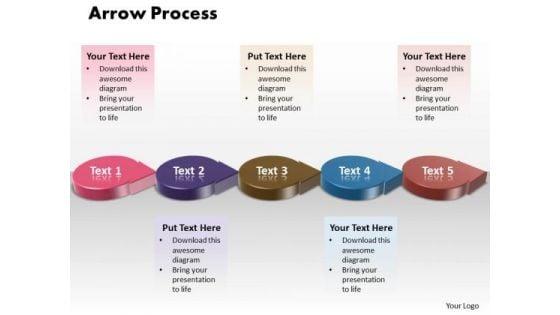
Ppt 3d Circle Arrow Process Flow Free Fishbone Diagram PowerPoint Template Templates
PPT 3d circle arrow process flow free fishbone diagram powerpoint template Templates-Use this 3D PowerPoint Diagram to represent the five stages of Sequential Process. It portrays beeline, continuous, even, horizontal, in bee line, in straight line, linear , nonstop, not crooked, point-blank, right, shortest, straight, straightaway, through, true, unbroken etc.-PPT 3d circle arrow process flow free fishbone diagram powerpoint template Templates-3d, Advertisement, Advertising, Arrow, Border, Business, Circles, Collection, Customer, Design, Element, Icon, Idea, Illustration, Info, Information, Isolated, Label, Light, Location, Needle, New, Notification, Notify, Point, Pointer, Promotion, Role, Rounded Motivate your team to excellent performances. Nurture their abilities through our Ppt 3d Circle Arrow Process Flow Free Fishbone Diagram PowerPoint Template Templates.
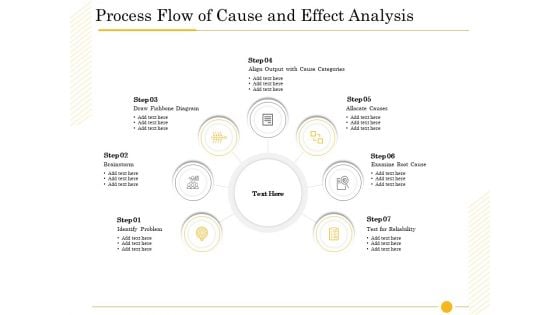
The Fishbone Analysis Tool Process Flow Of Cause And Effect Analysis Diagrams PDF
This is a the fishbone analysis tool process flow of cause and effect analysis diagrams pdf template with various stages. Focus and dispense information on seven stages using this creative set, that comes with editable features. It contains large content boxes to add your information on topics like align output cause categories, examine root cause, test reliability, draw fishbone diagram, identify problem. You can also showcase facts, figures, and other relevant content using this PPT layout. Grab it now.
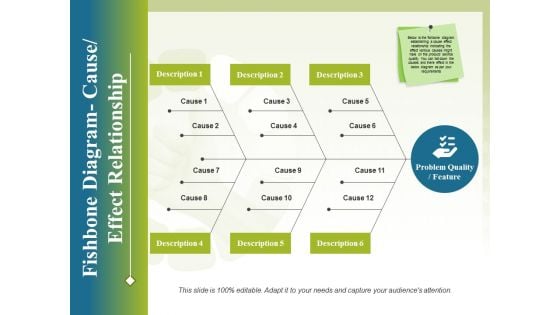
Fishbone Diagram Cause Effect Relationship Ppt PowerPoint Presentation Styles Design Inspiration
This is a fishbone diagram cause effect relationship ppt powerpoint presentation styles design inspiration. This is a three stage process. The stages in this process are business, process, analysis, strategy, management.

Cause And Effect Diagram Fishbone Diagram Ppt PowerPoint Presentation Layouts Designs Download
This is a cause and effect diagram fishbone diagram ppt powerpoint presentation layouts designs download. This is a three stage process. The stages in this process are measurement, materials, method, environment, manpower, machine.
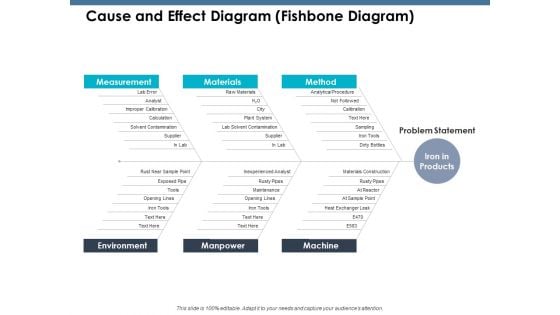
Cause And Effect Diagram Fishbone Diagram Ppt PowerPoint Presentation Outline Portrait
This is a cause and effect diagram fishbone diagram ppt powerpoint presentation outline portrait. This is a three stage process. The stages in this process are measurement, materials, method, environment, manpower.
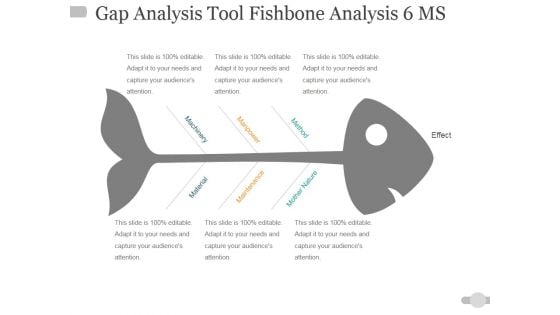
Gap Analysis Tool Fishbone Analysis 6 Ms Ppt PowerPoint Presentation Infographic Template Information
This is a gap analysis tool fishbone analysis 6 ms ppt powerpoint presentation infographic template information. This is a one stage process. The stages in this process are material, maintenance, mother nature, machinery, manpower, method, effect.
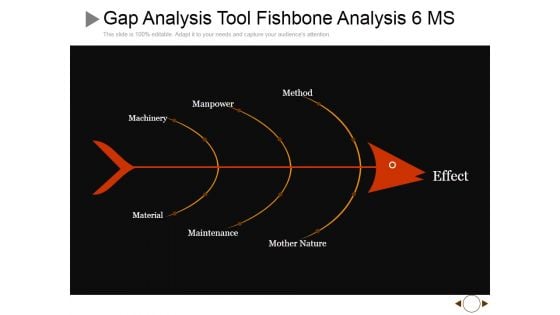
Gap Analysis Tool Fishbone Analysis 6 MS Ppt PowerPoint Presentation Summary Graphic Images
This is a gap analysis tool fishbone analysis 6 ms ppt powerpoint presentation summary graphic images. This is a three stage process. The stages in this process are machinery, manpower, method, effect, maintenance.
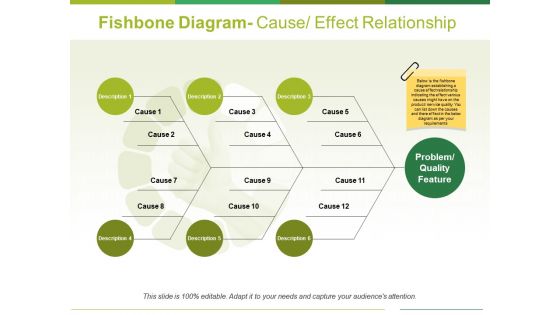
Fishbone Diagram Cause Effect Relationship Ppt PowerPoint Presentation Professional Background Designs
This is a fishbone diagram cause effect relationship ppt powerpoint presentation professional background designs. This is a twelve stage process. The stages in this process are description, cause, problem quality feature.
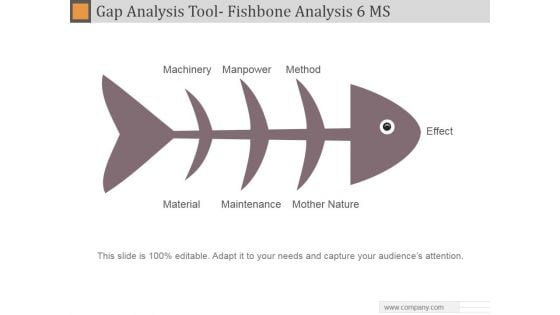
Gap Analysis Tool Fishbone Analysis 6 MS Ppt PowerPoint Presentation Inspiration
This is a gap analysis tool fishbone analysis 6 ms ppt powerpoint presentation inspiration. This is a three stage process. The stages in this process are machinery, manpower, method, material, maintenance, mother nature, effect.
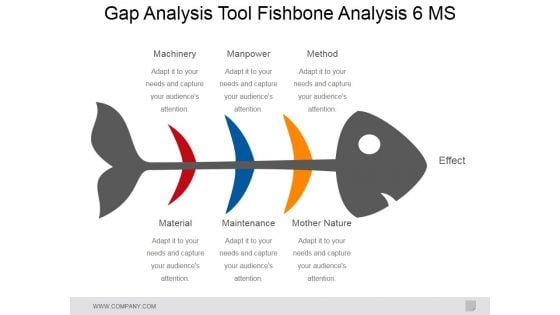
Gap Analysis Tool Fishbone Analysis 6 Ms Ppt PowerPoint Presentation Ideas Slides
This is a gap analysis tool fishbone analysis 6 ms ppt powerpoint presentation ideas slides. This is a six stage process. The stages in this process are machinery, manpower, method, material, maintenance, mother nature, effect.

Gap Analysis Tool Fishbone Analysis 6 Ms Ppt Powerpoint Presentation Summary Samples
This is a gap analysis tool fishbone analysis 6 ms ppt powerpoint presentation summary samples. This is a three stage process. The stages in this process are machinery, manpower, method, effect.
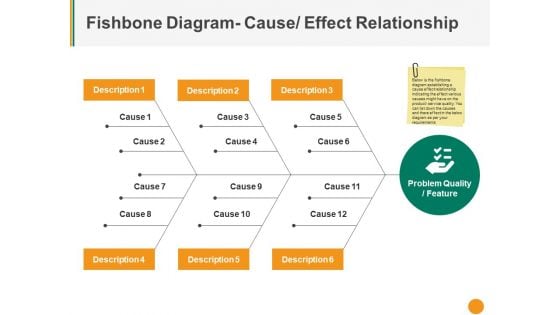
Fishbone Diagram Cause Effect Relationship Ppt PowerPoint Presentation Slides Master Slide
This is a fishbone diagram cause effect relationship ppt powerpoint presentation slides master slide. This is a three stage process. The stages in this process are description, cause, problem quality feature, management, strategy.
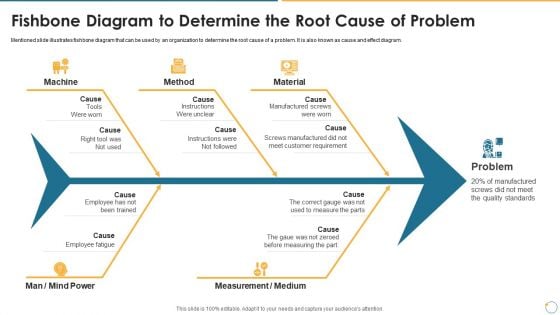
Collection Of Quality Assurance PPT Fishbone Diagram To Determine The Root Cause Of Problem Formats PDF
Mentioned slide illustrates fishbone diagram that can be used by an organization to determine the root cause of a problem. It is also known as cause and effect diagram. This is a collection of quality assurance ppt fishbone diagram to determine the root cause of problem formats pdf template with various stages. Focus and dispense information on five stages using this creative set, that comes with editable features. It contains large content boxes to add your information on topics like quality standards, manufactured, measure, requirement. You can also showcase facts, figures, and other relevant content using this PPT layout. Grab it now.
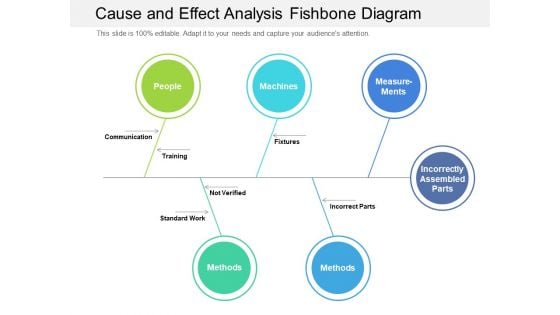
Cause And Effect Analysis Fishbone Diagram Ppt PowerPoint Presentation Gallery Designs PDF
Presenting this set of slides with name cause and effect analysis fishbone diagram ppt powerpoint presentation gallery designs pdf. This is a five stage process. The stages in this process are communication, training, fixtures. This is a completely editable PowerPoint presentation and is available for immediate download. Download now and impress your audience.
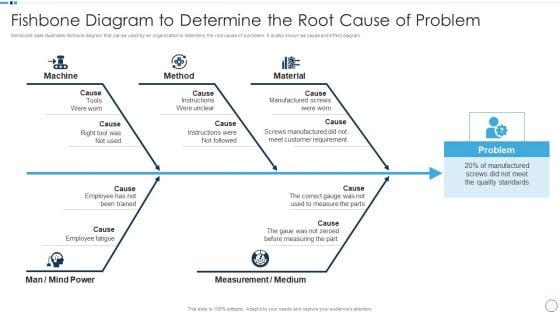
QA Plan Set 1 Fishbone Diagram To Determine The Root Cause Of Problem Professional PDF
This is a QA Plan Set 1 Fishbone Diagram To Determine The Root Cause Of Problem Professional PDF template with various stages. Focus and dispense information on five stages using this creative set, that comes with editable features. It contains large content boxes to add your information on topics like Method, Material, Measurement. You can also showcase facts, figures, and other relevant content using this PPT layout. Grab it now.
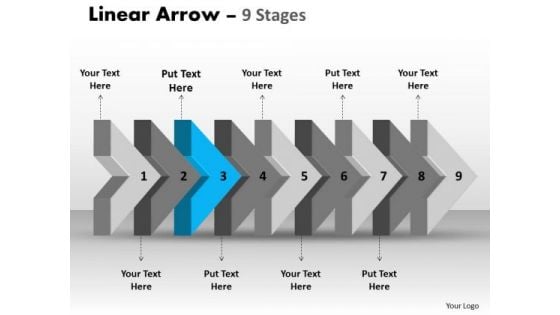
Ppt Template Beeline Flow Arrow Free Fishbone Diagram PowerPoint 4 Image
We present our PPT template beeline flow arrow free fishbone diagram PowerPoint 4 Image. Use our Symbol PowerPoint Templates because; enlighten them with your brilliant understanding of mental health. Use our Shapes PowerPoint Templates because, designed to attract the attention of your audience. Use our Signs PowerPoint Templates because, the lessons have been analyzed, studied and conclusions drawn. Use our Arrows PowerPoint Templates because, an occasion for gifting and giving. Use our Process and Flows PowerPoint Templates because, you have the moves to sway the market. Use these PowerPoint slides for presentations relating to Abstract, Age, Ancient, Antique, Arrows, Art, Artistic, Background, Colors, Decoration, Design, Dynamic, Elegant, Element, Future, Illustration, Index, Linear, Lines, Modern, Old, Paper, Pattern, Scratch, Text, Texture, Up, Vintage. The prominent colors used in the PowerPoint template are Blue, Gray, and Black Amaze yourself with our Ppt Template Beeline Flow Arrow Free Fishbone Diagram PowerPoint 4 Image. You will be astounded by what is on offer.
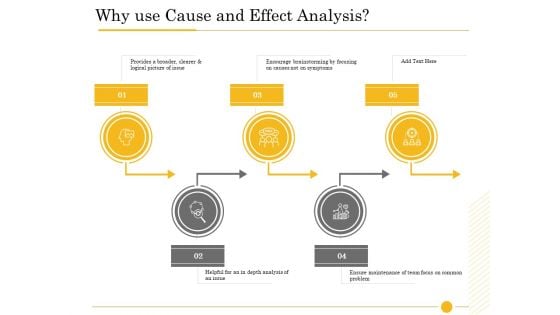
The Fishbone Analysis Tool Why Use Cause And Effect Analysis Template PDF
Presenting the fishbone analysis tool why use cause and effect analysis template pdf to provide visual cues and insights. Share and navigate important information on five stages that need your due attention. This template can be used to pitch topics like depth analysis, ensure maintenance, encourage brainstorming focusing, logical picture issue, why use cause effect analysis. In addtion, this PPT design contains high-resolution images, graphics, etc, that are easily editable and available for immediate download.
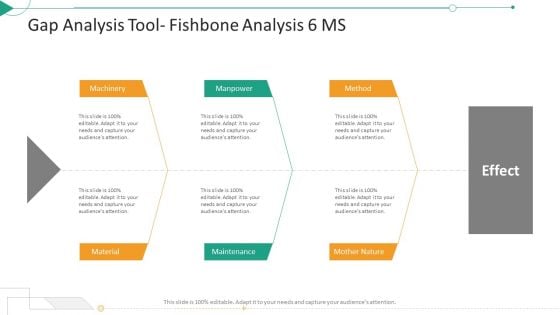
Strategic Planning Needs Evaluation Gap Analysis Tool Fishbone Analysis 6 MS Portrait PDF
Presenting strategic planning needs evaluation gap analysis tool fishbone analysis 6 ms portrait pdf to provide visual cues and insights. Share and navigate important information on three stages that need your due attention. This template can be used to pitch topics like machinery, material, maintenance, method. In addtion, this PPT design contains high resolution images, graphics, etc, that are easily editable and available for immediate download.
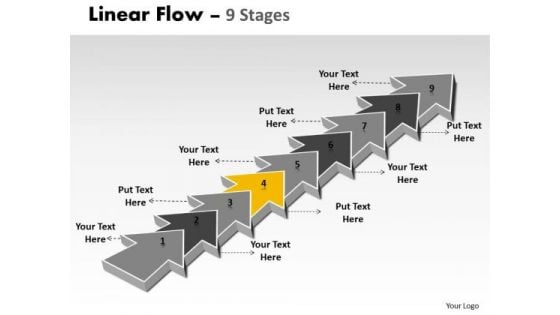
Ppt Background 9 Stages Linear Means Free Fishbone Diagram PowerPoint Template 5 Graphic
We present our PPT Background 9 stages linear means free fishbone diagram PowerPoint template 5 Graphic. Use our Arrows PowerPoint Templates because; Highlight the key components of your entire manufacturing/ business process. Use our Communication PowerPoint Templates because, Show how one can contribute to the overall feeling of wellbeing. Use our Shapes PowerPoint Templates because, your ideas are fundamentally stable with a broad base of workable possibilities. Use our Business PowerPoint Templates because; explain the contribution of each of the elements and how they provide impetus to the next phase. Use our Process and Flows PowerPoint Templates because, you have what it takes to grow. Use these PowerPoint slides for presentations relating to background, blog, business, chain, communication, connection, constructive, contact, design, diagonal, dialog, digital, flow, global, interaction, internet, line, linear, network, partner, pointer, reaction, social, stream, structure, system, team,. The prominent colors used in the PowerPoint template are Yellow, Gray, and White Catapult your thoughts with our Ppt Background 9 Stages Linear Means Free Fishbone Diagram PowerPoint Template 5 Graphic. They will travel a great distance.
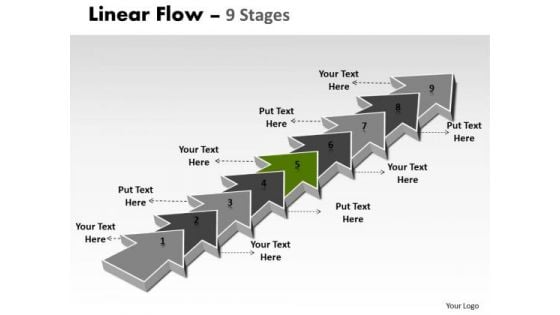
Ppt Background 9 Stages Linear Means Free Fishbone Diagram PowerPoint Template 6 Graphic
We present our PPT Background 9 stages linear means free fishbone diagram PowerPoint template 6 Graphic. Use our Arrows PowerPoint Templates because; motivate your team to cross all barriers. Use our Communication PowerPoint Templates because, our presentation designs are for those on the go. Use our Shapes PowerPoint Templates because, you have the plans ready for them to absorb and understand. Use our Business PowerPoint Templates because, Marketing Strategy Business Template: - Maximizing sales of your product is the intended destination. Use our Process and Flows PowerPoint Templates because, and watch them strengthen your companys sinews. Use these PowerPoint slides for presentations relating to background, blog, business, chain, communication, connection, constructive, contact, design, diagonal, dialog, digital, flow, global, interaction, internet, line, linear, network, partner, pointer, reaction, social, stream, structure, system, team,. The prominent colors used in the PowerPoint template are Green, Gray, and White Use our Ppt Background 9 Stages Linear Means Free Fishbone Diagram PowerPoint Template 6 Graphic to meet deadlines. They are readymade to fit into any presentation structure.
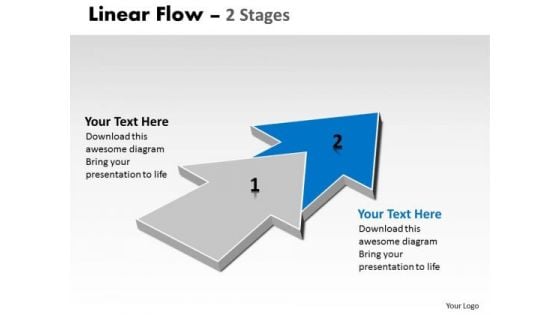
Ppt Background Progression Of 2 Stages Flow Free Fishbone Diagram PowerPoint Template 3 Design
We present our PPT Background progression of 2 stages flow free fishbone diagram PowerPoint template 3 design. Use our Arrows PowerPoint Templates because, The Venn graphic comprising interlinking circles geometrically demonstrate how various functions operating independently, to a large extent, are essentially interdependent. Use our Shapes PowerPoint Templates because, the ideas and plans are on your fingertips. Use our Business PowerPoint Templates because, Use our to enthuse your colleagues. Use our Signs PowerPoint Templates because, they are logical, accurate and to the point. Use our Process and Flows PowerPoint Templates because, we offer you a range of options to garner their interest. Use these PowerPoint slides for presentations relating to abstract, algorithm, arrow, business, chart, connection, design, development, diagram, direction, element, flow, graph, linear, linear diagram, management, organization, plan, process, section, segment, set, sign, solution, strategy, symbol, vector. The prominent colors used in the PowerPoint template are Blue, Gray, and White Clarify doubts with our Ppt Background Progression Of 2 Stages Flow Free Fishbone Diagram PowerPoint Template 3 Design. Download without worries with our money back guaranteee.
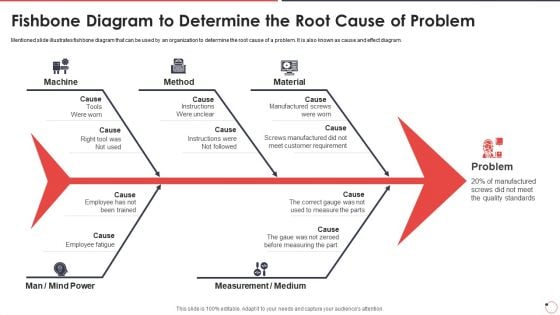
Quality Assurance Templates Set 1 Fishbone Diagram To Determine The Root Cause Of Problem Ppt Show Graphic Images PDF
Mentioned slide illustrates fishbone diagram that can be used by an organization to determine the root cause of a problem. It is also known as cause and effect diagram. Presenting quality assurance templates set 1 fishbone diagram to determine the root cause of problem ppt show graphic images pdf to provide visual cues and insights. Share and navigate important information on five stages that need your due attention. This template can be used to pitch topics like machine, method, material. In addtion, this PPT design contains high resolution images, graphics, etc, that are easily editable and available for immediate download.
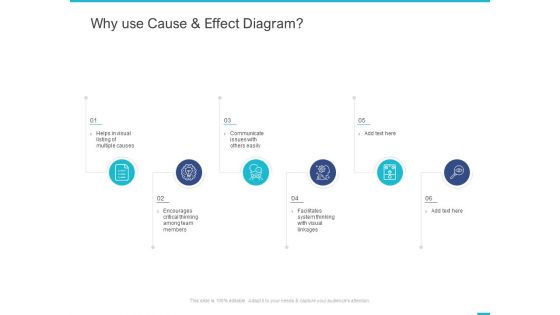
Fishbone Ishikawa Cause And Effect Analysis Why Use Cause And Effect Diagram Ppt PowerPoint Presentation Gallery Background PDF
Presenting this set of slides with name fishbone ishikawa cause and effect analysis why use cause and effect diagram ppt powerpoint presentation gallery background pdf. This is a six stage process. The stages in this process are facilitates system thinking, visual linkages, communicate. This is a completely editable PowerPoint presentation and is available for immediate download. Download now and impress your audience.

Fishbone Ishikawa Cause And Effect Analysis What Is A Cause And Effect Diagram Ppt PowerPoint Presentation Ideas Portfolio PDF
Presenting this set of slides with name fishbone ishikawa cause and effect analysis what is a cause and effect diagram ppt powerpoint presentation ideas portfolio pdf. This is a one stage process. The stages in this process are equipment, process, specify cause category here, materials, environment, specify cause category . This is a completely editable PowerPoint presentation and is available for immediate download. Download now and impress your audience.

Timeline Mind Map For Brainstorming And Problem Solving
Our Timeline Mind Map For Brainstorming And Problem Solving are the layers of your gourmet cake. Provide the icing of your ideas and produce a masterpiece. Use our Timeline Mind Map For Brainstorming And Problem Solving and and feel the difference. Right off they generate a surge of interest.
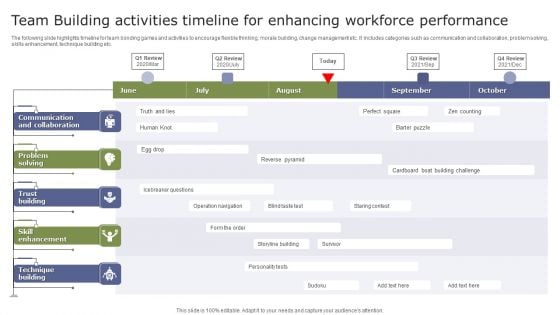
Team Building Activities Timeline For Enhancing Workforce Performance Infographics PDF
The following slide highlights timeline for team bonding games and activities to encourage flexible thinking, morale building, change management etc. It includes categories such as communication and collaboration, problem solving, skills enhancement, technique building etc. Pitch your topic with ease and precision using this Team Building Activities Timeline For Enhancing Workforce Performance Infographics PDF. This layout presents information on Communication And Collaboration, Skill Enhancement, Technique Building. It is also available for immediate download and adjustment. So, changes can be made in the color, design, graphics or any other component to create a unique layout.
Corporate Timeline Display 1 PowerPoint Slides And Ppt Diagram Templates
Corporate Timeline Display 1 PowerPoint Slides And PPT Diagram Templates-These high quality, editable pre-designed powerpoint slides have been carefully created by our professional team to help you impress your audience. Each graphic in every slide is vector based and is 100% editable in powerpoint. Each and every property of any slide - color, size, shading etc can be modified to build an effective powerpoint presentation. Use these slides to convey complex business concepts in a simplified manner. Any text can be entered at any point in the powerpoint slide. Simply DOWNLOAD, TYPE and PRESENT! Our Corporate Timeline Display 1 PowerPoint Slides And Ppt Diagram Templates will cause a celebration. Put your audience in a festive mood.
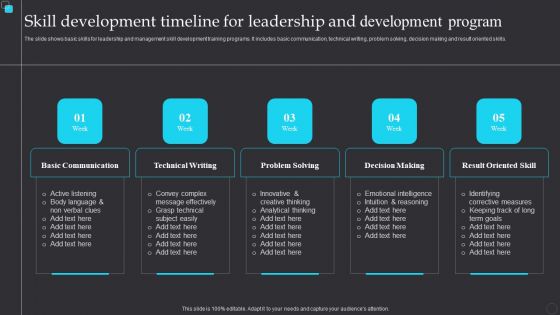
Skill Development Timeline For Leadership And Development Program Demonstration PDF
The slide shows basic skills for leadership and management skill development training programs. It includes basic communication, technical writing, problem solving, decision making and result oriented skills. Presenting Skill Development Timeline For Leadership And Development Program Demonstration PDF to dispense important information. This template comprises five stages. It also presents valuable insights into the topics including Technical Writing, Basic Communication, Decision Making. This is a completely customizable PowerPoint theme that can be put to use immediately. So, download it and address the topic impactfully.
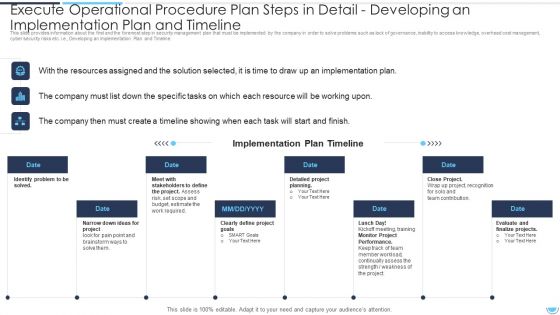
Execute Operational Procedure Plan Steps In Detail Developing An Implementation Plan And Timeline Pictures PDF
This slide provides information about the Fifth and the foremost step in security management plan that must be implemented by the company in order to solve problems such as lack of governance, inability to access knowledge, overhead cost management, cyber security risks etc. i.e., Developing an Implementation Plan and Timeline.This is a execute operational procedure plan steps in detail developing an implementation plan and timeline pictures pdf template with various stages. Focus and dispense information on eight stages using this creative set, that comes with editable features. It contains large content boxes to add your information on topics like implementation plan, stakeholders to define, identify problem to be solved. You can also showcase facts, figures, and other relevant content using this PPT layout. Grab it now.
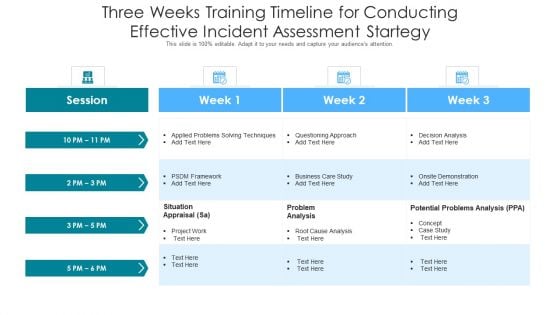
Three Weeks Training Timeline For Conducting Effective Incident Assessment Startegy Graphics PDF
Showcasing this set of slides titled three weeks training timeline for conducting effective incident assessment startegy graphics pdf. The topics addressed in these templates are business care study, decision analysis, problems solving techniques. All the content presented in this PPT design is completely editable. Download it and make adjustments in color, background, font etc. as per your unique business setting.
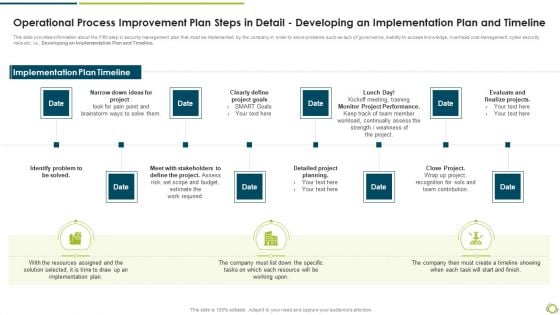
Operational Process Improvement Plan Steps In Detail Developing An Implementation Plan And Timeline Demonstration PDF
This slide provides information about the Fifth step in security management plan that must be implemented by the company in order to solve problems such as lack of governance, inability to access knowledge, overhead cost management, cyber security risks etc. i.e., Developing an Implementation Plan and Timeline.This is a operational process improvement plan steps in detail developing an implementation plan and timeline demonstration pdf template with various stages. Focus and dispense information on eight stages using this creative set, that comes with editable features. It contains large content boxes to add your information on topics like identify problem to be solved, clearly define project goals, monitor project performance. You can also showcase facts, figures, and other relevant content using this PPT layout. Grab it now.
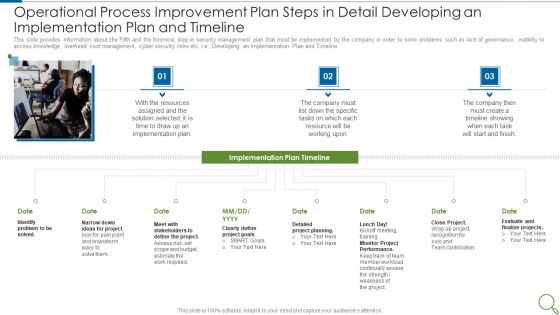
Operational Process Improvement Plan Steps In Detail Developing An Implementation Plan And Timeline Sample PDF
This slide provides information about the Fifth and the foremost step in security management plan that must be implemented by the company in order to solve problems such as lack of governance, inability to access knowledge, overhead cost management, cyber security risks etc. i.e., Developing an Implementation Plan and Timeline. This is a operational process improvement plan steps in detail developing an implementation plan and timeline sample pdf template with various stages. Focus and dispense information on three stages using this creative set, that comes with editable features. It contains large content boxes to add your information on topics like resources, implementation plan, project, goals, performance. You can also showcase facts, figures, and other relevant content using this PPT layout. Grab it now.
Enterprise Problem Solving And Intellect Timeline Ppt PowerPoint Presentation Icon PDF
Presenting this set of slides with name enterprise problem solving and intellect thank you ppt powerpoint presentation file gridlines pdf. This is a five stage process. The stages in this process are timeline, 2016 to 2020. This is a completely editable PowerPoint presentation and is available for immediate download. Download now and impress your audience.
Tools Of Quality Management Ppt PowerPoint Presentation Icon Grid
This is a tools of quality management ppt powerpoint presentation icon grid. This is a three stage process. The stages in this process are pareto chart, fishbone diagram, flow chart.
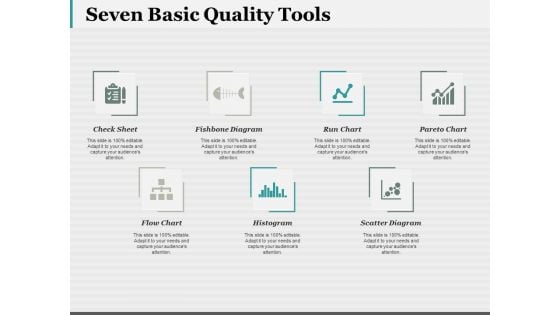
Seven Basic Quality Tools Ppt PowerPoint Presentation Outline Visual Aids
This is a seven basic quality tools ppt powerpoint presentation outline visual aids. This is a seven stage process. The stages in this process are fishbone diagram, run chart, pareto chart, histogram, flow chart.
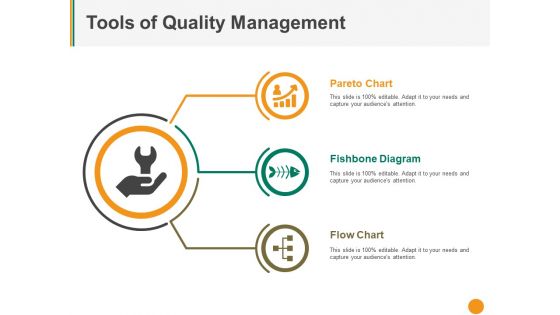
Tools Of Quality Management Ppt PowerPoint Presentation Gallery Show
This is a tools of quality management ppt powerpoint presentation gallery show. This is a three stage process. The stages in this process are pareto chart, fishbone diagram, flow chart, icons, business.
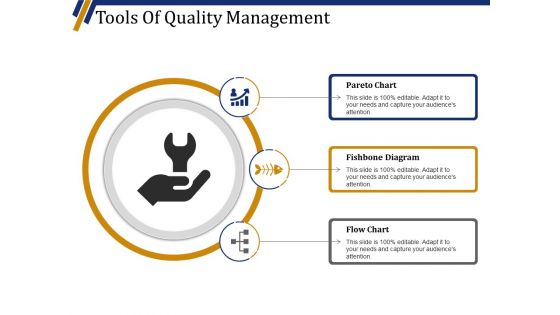
Tools Of Quality Management Ppt PowerPoint Presentation Summary Layout Ideas
This is a tools of quality management ppt powerpoint presentation summary layout ideas. This is a three stage process. The stages in this process are pareto chart, fishbone diagram, flow chart, icons, business.
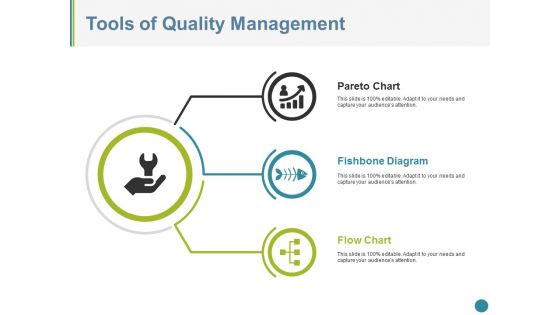
Tools Of Quality Management Ppt PowerPoint Presentation Inspiration Guide
This is a tools of quality management ppt powerpoint presentation inspiration guide. This is a three stage process. The stages in this process are pareto chart, fishbone diagram, flow chart.
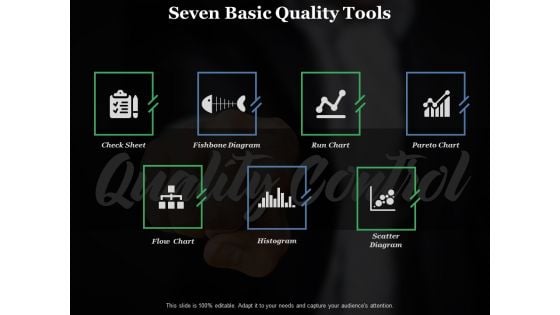
Seven Basic Quality Tools Ppt PowerPoint Presentation Show Grid
This is a seven basic quality tools ppt powerpoint presentation show grid. This is a seven stage process. The stages in this process are fishbone diagram, run chart, histogram, flow chart, scatter diagram.
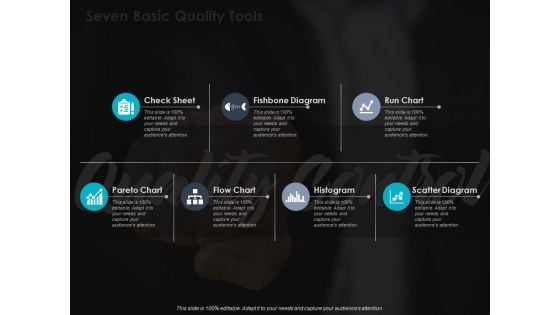
Seven Basic Quality Tools Ppt PowerPoint Presentation Layouts Example File
This is a seven basic quality tools ppt powerpoint presentation layouts example file. This is a seven stage process. The stages in this process are Check Sheet, Fishbone Diagram, Histogram, Run Chart.
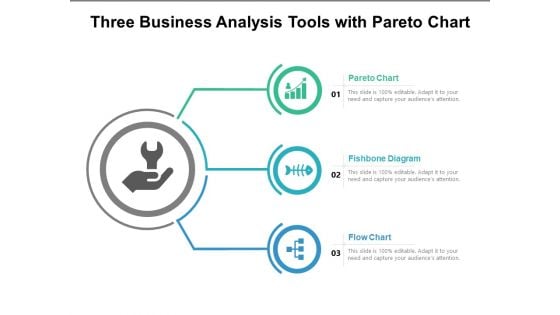
Three Business Analysis Tools With Pareto Chart Ppt PowerPoint Presentation Layouts Vector PDF
Presenting this set of slides with name three business analysis tools with pareto chart ppt powerpoint presentation layouts vector pdf. This is a three stage process. The stages in this process are pareto chart, fishbone diagram, flow chart. This is a completely editable PowerPoint presentation and is available for immediate download. Download now and impress your audience.
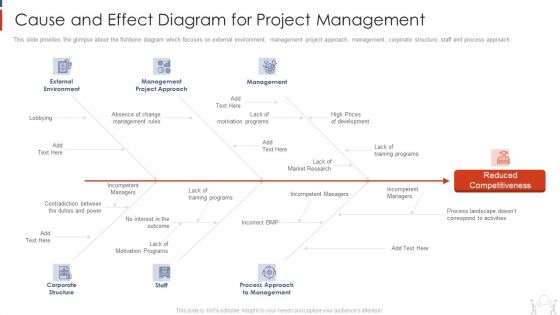
Project Management Modelling Techniques IT Cause And Effect Diagram For Project Management Information PDF
This slide provides the glimpse about the fishbone diagram which focuses on external environment, management project approach, management, corporate structure, staff and process approach. This is a project management modelling techniques it cause and effect diagram for project management information pdf template with various stages. Focus and dispense information on six stages using this creative set, that comes with editable features. It contains large content boxes to add your information on topics like external environment, management project approach, management, corporate structure, staff. You can also showcase facts, figures, and other relevant content using this PPT layout. Grab it now.
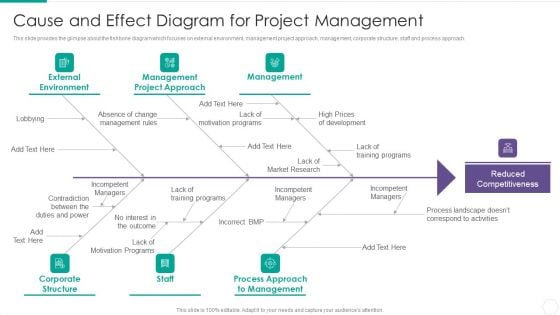
Quantitative Risk Assessment Cause And Effect Diagram For Project Management Rules PDF
This slide provides the glimpse about the fishbone diagram which focuses on external environment, management project approach, management, corporate structure, staff and process approach. This is a Quantitative Risk Assessment Cause And Effect Diagram For Project Management Rules PDF template with various stages. Focus and dispense information on six stages using this creative set, that comes with editable features. It contains large content boxes to add your information on topics like Management, External Environment, Corporate Structure, Market. You can also showcase facts, figures, and other relevant content using this PPT layout. Grab it now.
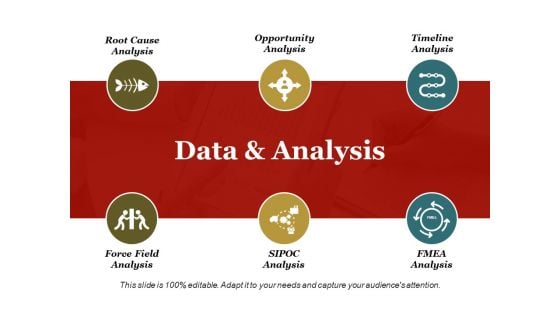
Data And Analysis Ppt PowerPoint Presentation Styles Show
This is a data and analysis ppt powerpoint presentation styles show. This is a six stage process. The stages in this process are root cause analysis, opportunity analysis, timeline analysis, force field analysis, sipoc analysis.
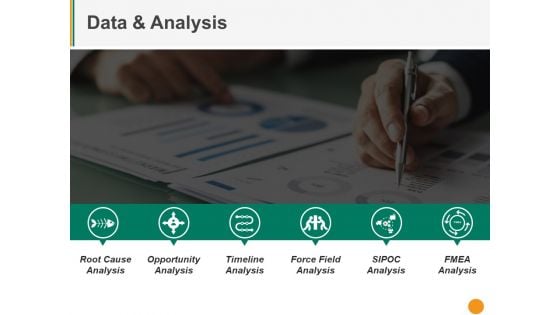
Data And Analysis Ppt PowerPoint Presentation Layouts Slideshow
This is a data and analysis ppt powerpoint presentation layouts slideshow. This is a six stage process. The stages in this process are root cause analysis, opportunity analysis, timeline analysis, force field analysis, fmea analysis.
Data And Analysis Ppt PowerPoint Presentation Icon Diagrams
This is a Data And Analysis Ppt PowerPoint Presentation Icon Diagrams. This is a six stage process. The stages in this process are root cause analysis, opportunity analysis, timeline analysis, force field analysis.

 Home
Home