Forecast Dashboard
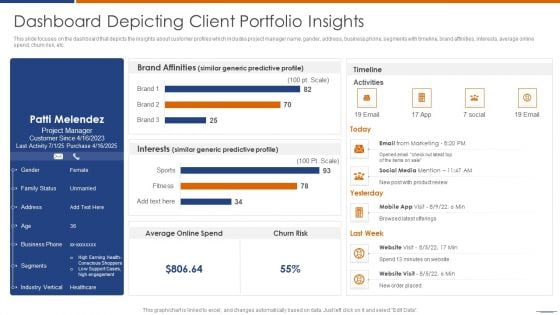
Dashboard Depicting Client Portfolio Insights Template PDF
This slide focuses on the dashboard that depicts the insights about customer profiles which includes project manager name, gander, address, business phone, segments with timeline, brand affinities, interests, average online spend, churn risk, etc.Showcasing this set of slides titled Dashboard Depicting Client Portfolio Insights Template PDF The topics addressed in these templates are Brand Affinities, Interests Similar, Average Spend All the content presented in this PPT design is completely editable. Download it and make adjustments in color, background, font etc. as per your unique business setting.
Devops Continuous Workflow Tracking Dashboard Slides PDF
This slide provides the glimpse of facts and figures related to continuous monitoring of project with DevOps. It includes planned vs. completed work items, work item priority wise, active bugs severity wise, etc. Showcasing this set of slides titled Devops Continuous Workflow Tracking Dashboard Slides PDF. The topics addressed in these templates are Continuous Workflow, Tracking Dashboard, Sprint Analysis By Assignee. All the content presented in this PPT design is completely editable. Download it and make adjustments in color, background, font etc. as per your unique business setting.
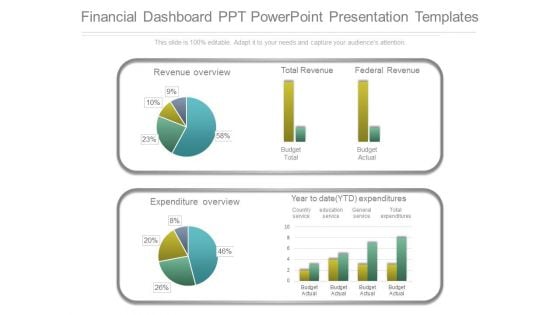
Financial Dashboard Ppt Powerpoint Presentation Templates
This is a financial dashboard ppt powerpoint presentation templates. This is a two stage process. The stages in this process are revenue overview, total revenue, federal revenue, budget total, budget actual, expenditure overview, year to date ytd expenditures, country service, education service, general service, total expenditures.
Project Tracking And Evaluation Dashboard Portrait PDF
This slide illustrates graphical representation and facts and figures relating to project management data. It includes budget by employee, overdue tasks, workload charts etc. Pitch your topic with ease and precision using this Project Tracking And Evaluation Dashboard Portrait PDF. This layout presents information on Employee Budget, Target, Design, Development. It is also available for immediate download and adjustment. So, changes can be made in the color, design, graphics or any other component to create a unique layout.
Project Tracking Cost Tracker Dashboard Elements PDF
The following slide highlights the cost analysis of various projects to perform feasibility analysis. It includes budgeted versus actual cost, project wise cost and revenue allocation etc. Showcasing this set of slides titled Project Tracking Cost Tracker Dashboard Elements PDF. The topics addressed in these templates are Budgeted Costs, Resource Allocation, Project Costs. All the content presented in this PPT design is completely editable. Download it and make adjustments in color, background, font etc. as per your unique business setting.
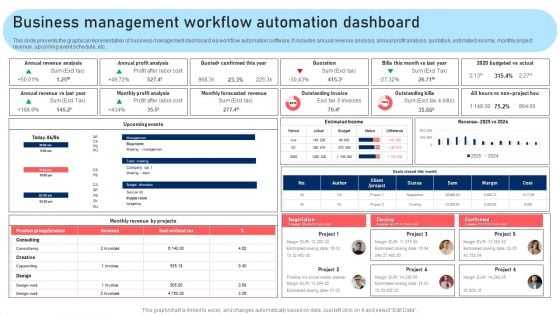
Business Management Workflow Automation Dashboard Pictures PDF
This slide presents the graphical representation of business management dashboard via workflow automation software. It includes annual revenue analysis, annual profit analysis, quotation, estimated income, monthly project revenue, upcoming event schedule, etc. Coming up with a presentation necessitates that the majority of the effort goes into the content and the message you intend to convey. The visuals of a PowerPoint presentation can only be effective if it supplements and supports the story that is being told. Keeping this in mind our experts created Business Management Workflow Automation Dashboard Pictures PDF to reduce the time that goes into designing the presentation. This way, you can concentrate on the message while our designers take care of providing you with the right template for the situation.
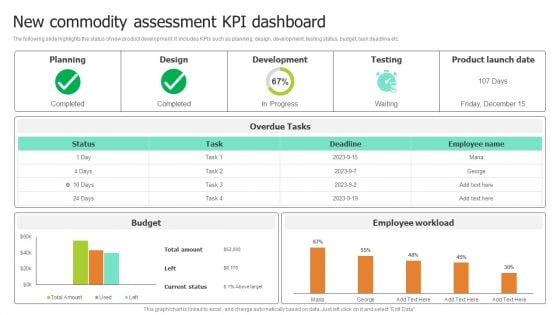
New Commodity Assessment Kpi Dashboard Pictures PDF
The following slide highlights the status of new product development. It includes KPIs such as planning, design, development, testing status, budget, task deadline etc.Showcasing this set of slides titled New Commodity Assessment Kpi Dashboard Pictures PDF. The topics addressed in these templates are Development, Product Launch Date, Overdue Tasks. All the content presented in this PPT design is completely editable. Download it and make adjustments in color, background, font etc. as per your unique business setting.
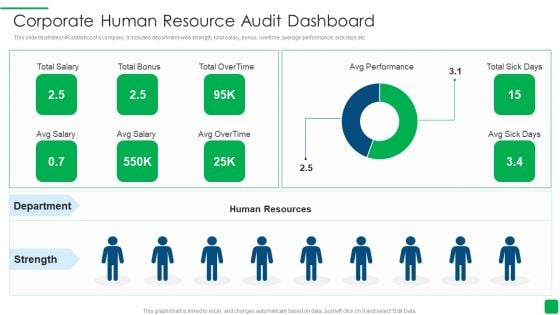
Corporate Human Resource Audit Dashboard Introduction PDF
This slide illustrates HR statistics of a company. it includes department-wise strength, total salary, bonus, overtime, average performance, sick days etc. Showcasing this set of slides titled Corporate Human Resource Audit Dashboard Introduction PDF. The topics addressed in these templates are Human Resources, Department, Strength. All the content presented in this PPT design is completely editable. Download it and make adjustments in color, background, font etc. as per your unique business setting.
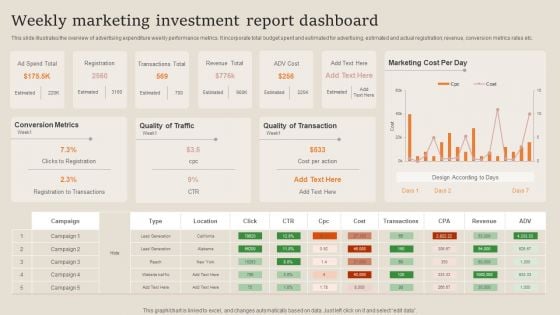
Weekly Marketing Investment Report Dashboard Ideas PDF
This slide illustrates the overview of advertising expenditure weekly performance metrics. It incorporate total budget spent and estimated for advertising, estimated and actual registration, revenue, conversion metrics rates etc. Showcasing this set of slides titled Weekly Marketing Investment Report Dashboard Ideas PDF. The topics addressed in these templates are Conversion Metrics, Quality Of Traffic, Quality Of Transaction. All the content presented in this PPT design is completely editable. Download it and make adjustments in color, background, font etc. as per your unique business setting.
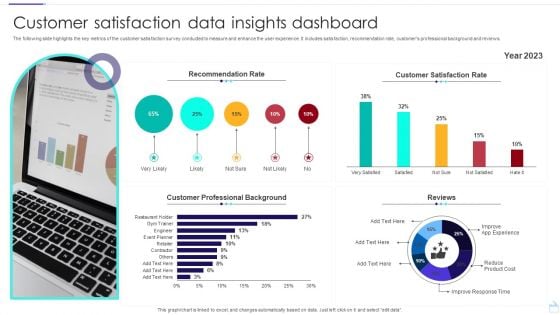
Customer Satisfaction Data Insights Dashboard Ideas PDF
The following slide highlights the key metrics of the customer satisfaction survey conducted to measure and enhance the user experience. It includes satisfaction, recommendation rate, customers professional background and reviews. Showcasing this set of slides titled Customer Satisfaction Data Insights Dashboard Ideas PDF. The topics addressed in these templates are Recommendation Rate, Customer Satisfaction Rate, Customer Professional Background. All the content presented in this PPT design is completely editable. Download it and make adjustments in color, background, font etc. as per your unique business setting.
Workforce Productivity Tracking Report Dashboard Background PDF
The given below slide depicts the KPIs of work stream status to assess progress and stagnation. It includes elements such as budget, risk, action plan, work stream timeline, highlights etc. Showcasing this set of slides titled Workforce Productivity Tracking Report Dashboard Background PDF. The topics addressed in these templates are High Technology Turnover, Workforce Health Safety Risk, Plan Employee Training. All the content presented in this PPT design is completely editable. Download it and make adjustments in color, background, font etc. as per your unique business setting.
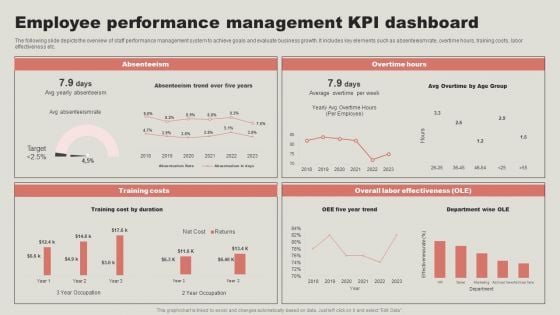
Employee Performance Management KPI Dashboard Structure PDF
The following slide depicts the overview of staff performance management system to achieve goals and evaluate business growth. It includes key elements such as absenteeism rate, overtime hours, training costs, labor effectiveness etc. Take your projects to the next level with our ultimate collection of Employee Performance Management KPI Dashboard Structure PDF. Slidegeeks has designed a range of layouts that are perfect for representing task or activity duration, keeping track of all your deadlines at a glance. Tailor these designs to your exact needs and give them a truly corporate look with your own brand colors they will make your projects stand out from the rest.
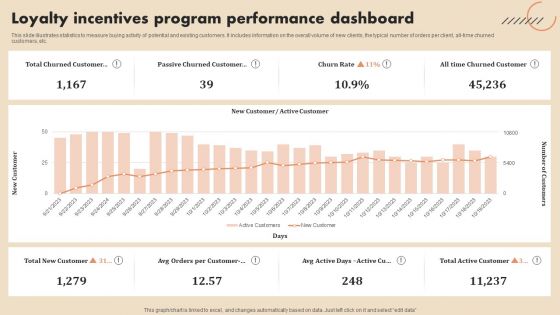
Loyalty Incentives Program Performance Dashboard Microsoft PDF
This slide illustrates statistics to measure buying activity of potential and existing customers. It includes information on the overall volume of new clients, the typical number of orders per client, all time churned customers, etc.Showcasing this set of slides titled Loyalty Incentives Program Performance Dashboard Microsoft PDF. The topics addressed in these templates are Total Churned Customer, Passive Churned Customer. All the content presented in this PPT design is completely editable. Download it and make adjustments in color, background, font etc. as per your unique business setting.
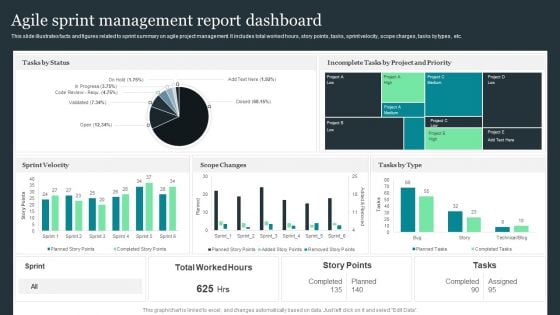
Agile Sprint Management Report Dashboard Pictures PDF
This slide illustrates facts and figures related to sprint summary on agile project management. It includes total worked hours, story points, tasks, sprint velocity, scope charges, tasks by types, etc. Pitch your topic with ease and precision using this Agile Sprint Management Report Dashboard Pictures PDF. This layout presents information on Tasks By Status, Sprint Velocity, Scope Changes. It is also available for immediate download and adjustment. So, changes can be made in the color, design, graphics or any other component to create a unique layout.
Five Years Sales Projection And Analysis Dashboard Icons PDF
This slide defines the dashboard for five years sales forecast and analysis . It includes information related to the estimated and actual sales. Pitch your topic with ease and precision using this Five Years Sales Projection And Analysis Dashboard Icons PDF. This layout presents information on Forecast Value, Forecast Accuracy, Won Opportunities. It is also available for immediate download and adjustment. So, changes can be made in the color, design, graphics or any other component to create a unique layout.

KPI Dashboard For Estimating Monthly Cash Flow Infographics Pdf
Following slide demonstrates KPI dashboard to forecast monthly business money flow for cash flow management planning. It includes components such as projected profit before tax, net operating cash flow, net financial cash flow, net investing cash flow, etc. Showcasing this set of slides titled KPI Dashboard For Estimating Monthly Cash Flow Infographics Pdf. The topics addressed in these templates are KPI Dashboard, Estimating Monthly Cash Flow, Net Financial Cash Flow. All the content presented in this PPT design is completely editable. Download it and make adjustments in color, background, font etc. as per your unique business setting. Following slide demonstrates KPI dashboard to forecast monthly business money flow for cash flow management planning. It includes components such as projected profit before tax, net operating cash flow, net financial cash flow, net investing cash flow, etc.
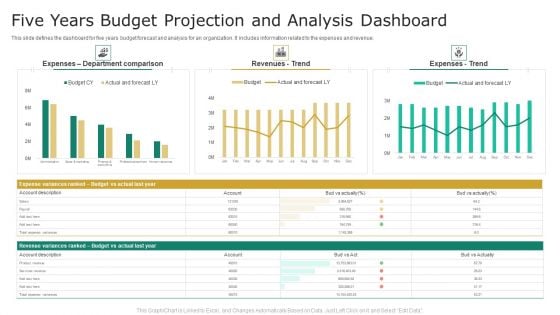
Five Years Budget Projection And Analysis Dashboard Graphics PDF
This slide defines the dashboard for five years budget forecast and analysis for an organization. It includes information related to the expenses and revenue. Showcasing this set of slides titled Five Years Budget Projection And Analysis Dashboard Graphics PDF. The topics addressed in these templates are Revenues, Expenses, Budget. All the content presented in this PPT design is completely editable. Download it and make adjustments in color, background, font etc. as per your unique business setting.
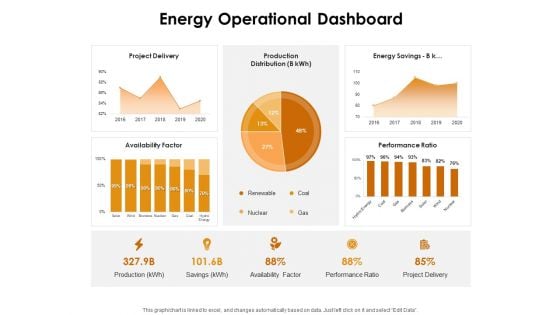
KPI Dashboards Per Industry Energy Operational Dashboard Ppt PowerPoint Presentation Outline Shapes PDF
Deliver and pitch your topic in the best possible manner with this kpi dashboards per industry energy operational dashboard ppt powerpoint presentation outline shapes pdf. Use them to share invaluable insights on project delivery, production distribution, energy savings, availability factor, coal, gas and impress your audience. This template can be altered and modified as per your expectations. So, grab it now.
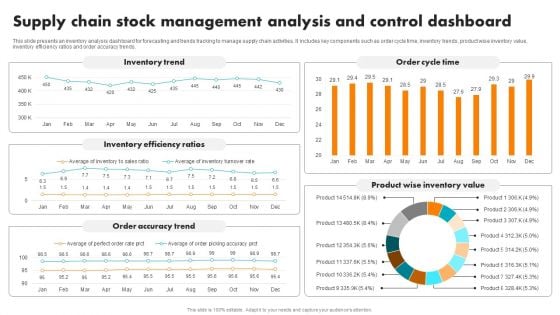
Supply Chain Stock Management Analysis And Control Dashboard Brochure PDF
This slide presents an inventory analysis dashboard for forecasting and trends tracking to manage supply chain activities. It includes key components such as order cycle time, inventory trends, product wise inventory value, inventory efficiency ratios and order accuracy trends. Pitch your topic with ease and precision using this Supply Chain Stock Management Analysis And Control Dashboard Brochure PDF. This layout presents information on Inventory Trend, Inventory Efficiency Ratios, Order Accuracy Trend, Order Cycle Time, Product Wise Inventory Value. It is also available for immediate download and adjustment. So, changes can be made in the color, design, graphics or any other component to create a unique layout.
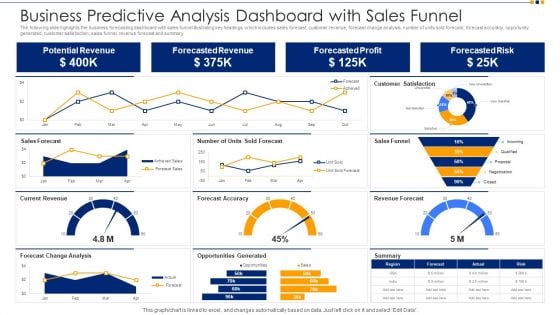
Business Predictive Analysis Dashboard With Sales Funnel Ppt Show Images PDF
The following slide highlights the business forecasting dashboard with sales funnel illustrating key headings which includes sales forecast, customer revenue, forecast change analysis, number of units sold forecast, forecast accuracy, opportunity generated, customer satisfaction, sales funnel, revenue forecast and summary. Pitch your topic with ease and precision using this business predictive analysis dashboard with sales funnel ppt show images pdf. This layout presents information on potential revenue, forecasted revenue, forecasted profit, forecasted risk. It is also available for immediate download and adjustment. So, changes can be made in the color, design, graphics or any other component to create a unique layout.
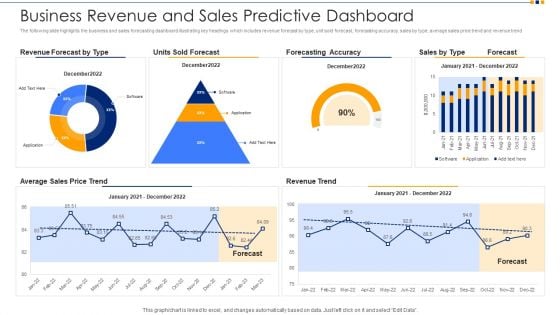
Business Revenue And Sales Predictive Dashboard Ppt Inspiration Background Designs PDF
The following slide highlights the business and sales forecasting dashboard illustrating key headings which includes revenue forecast by type, unit sold forecast, forecasting accuracy, sales by type, average sales price trend and revenue trend. Pitch your topic with ease and precision using this business revenue and sales predictive dashboard ppt inspiration background designs pdf. This layout presents information on revenue forecast by type, units sold forecast, forecasting accuracy, average sales price trend, revenue trend. It is also available for immediate download and adjustment. So, changes can be made in the color, design, graphics or any other component to create a unique layout.
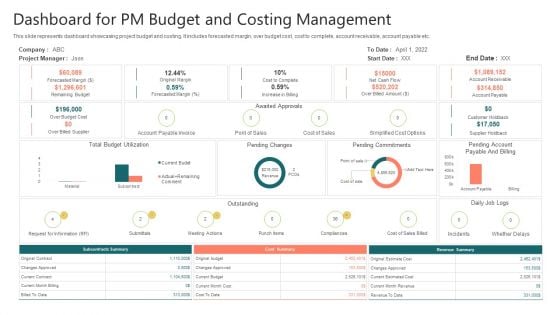
Dashboard For PM Budget And Costing Management Download PDF
This slide represents dashboard showcasing project budget and costing. It includes forecasted margin, over budget cost, cost to complete, account receivable, account payable etc. Showcasing this set of slides titled Dashboard For PM Budget And Costing Management Download PDF. The topics addressed in these templates are Original Margin, Cost To Complete, Account Payable. All the content presented in this PPT design is completely editable. Download it and make adjustments in color, background, font etc. as per your unique business setting.
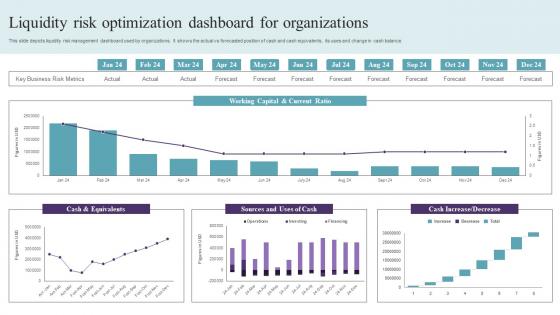
Liquidity Risk Optimization Dashboard For Organizations Graphics Pdf
This slide depicts liquidity risk management dashboard used by organizations. It shows the actual vs forecasted position of cash and cash equivalents, its uses and change in cash balance. Pitch your topic with ease and precision using this Liquidity Risk Optimization Dashboard For Organizations Graphics Pdf. This layout presents information on Cash And Equivalents, Working Capital, Current Ratio. It is also available for immediate download and adjustment. So, changes can be made in the color, design, graphics or any other component to create a unique layout. This slide depicts liquidity risk management dashboard used by organizations. It shows the actual vs forecasted position of cash and cash equivalents, its uses and change in cash balance.
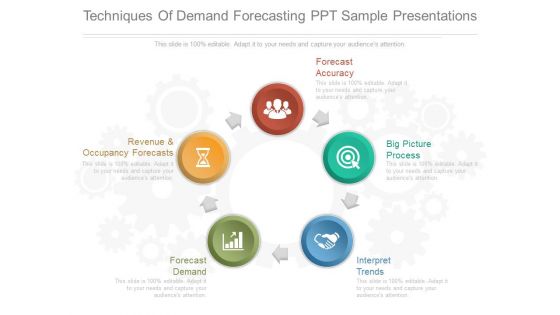
Techniques Of Demand Forecasting Ppt Sample Presentations
This is a techniques of demand forecasting ppt sample presentations. This is a five stage process. The stages in this process are revenue and occupancy forecasts, forecast accuracy, big picture process, interpret trends, forecast demand.
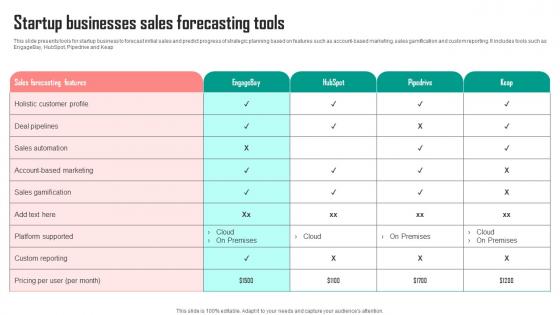
Startup Businesses Sales Forecasting Tools Rules Pdf
This slide presents tools for startup business to forecast initial sales and predict progress of strategic planning based on features such as account-based marketing, sales gamification and custom reporting. It includes tools such as EngageBay, HubSpot, Pipedrive and Keap Showcasing this set of slides titled Startup Businesses Sales Forecasting Tools Rules Pdf. The topics addressed in these templates are Forecasting Tools, Startup, Businesses. All the content presented in this PPT design is completely editable. Download it and make adjustments in color, background, font etc. as per your unique business setting. This slide presents tools for startup business to forecast initial sales and predict progress of strategic planning based on features such as account-based marketing, sales gamification and custom reporting. It includes tools such as EngageBay, HubSpot, Pipedrive and Keap
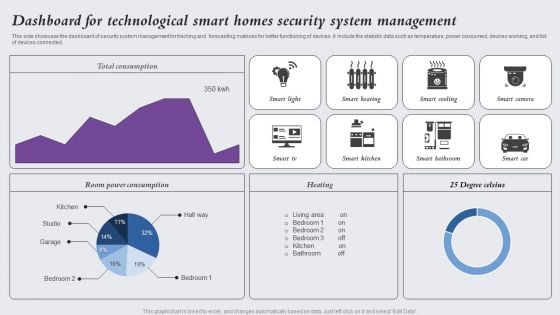
Dashboard For Technological Smart Homes Security System Management Designs PDF
This side showcase the dashboard of security system management for tracking and forecasting matrices for better functioning of devices. It include the statistic data such as temperature, power consumed, devices working, and list of devices connected. Showcasing this set of slides titled Dashboard For Technological Smart Homes Security System Management Designs PDF. The topics addressed in these templates are Smart Light, Smart Heating, Smart Cooling. All the content presented in this PPT design is completely editable. Download it and make adjustments in color, background, font etc. as per your unique business setting.
Startup Businesses Sales Forecasting Methods Demonstration Pdf
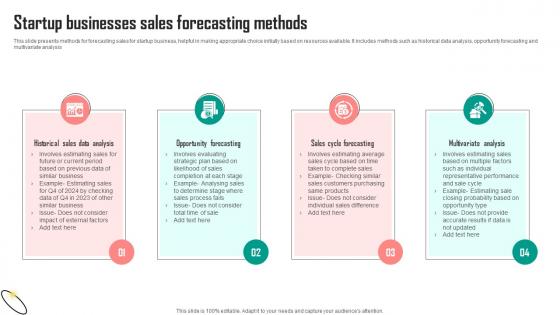
This slide presents methods for forecasting sales for startup business, helpful in making appropriate choice initially based on resources available. It includes methods such as historical data analysis, opportunity forecasting and multivariate analysis Showcasing this set of slides titled Startup Businesses Sales Forecasting Methods Demonstration Pdf. The topics addressed in these templates are Data Analysis, Opportunity Forecasting, Cycle Forecasting. All the content presented in this PPT design is completely editable. Download it and make adjustments in color, background, font etc. as per your unique business setting. This slide presents methods for forecasting sales for startup business, helpful in making appropriate choice initially based on resources available. It includes methods such as historical data analysis, opportunity forecasting and multivariate analysis
Startup Businesses Sales Forecasting Challenges Information Pdf
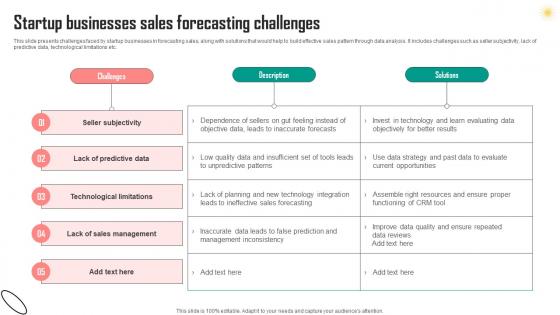
This slide presents challenges faced by startup businesses in forecasting sales, along with solutions that would help to build effective sales pattern through data analysis. It includes challenges such as seller subjectivity, lack of predictive data, technological limitations etc. Pitch your topic with ease and precision using this Startup Businesses Sales Forecasting Challenges Information Pdf. This layout presents information on Challenges, Description, Solutions. It is also available for immediate download and adjustment. So, changes can be made in the color, design, graphics or any other component to create a unique layout. This slide presents challenges faced by startup businesses in forecasting sales, along with solutions that would help to build effective sales pattern through data analysis. It includes challenges such as seller subjectivity, lack of predictive data, technological limitations etc.
Startup Businesses Sales Forecasting Process Mockup Pdf
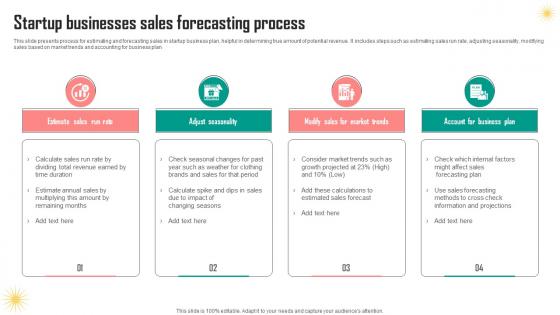
This slide presents process for estimating and forecasting sales in startup business plan, helpful in determining true amount of potential revenue. It includes steps such as estimating sales run rate, adjusting seasonality, modifying sales based on market trends and accounting for business plan Pitch your topic with ease and precision using this Startup Businesses Sales Forecasting Process Mockup Pdf. This layout presents information on Sales Run Rate, Adjust Seasonality, Trends. It is also available for immediate download and adjustment. So, changes can be made in the color, design, graphics or any other component to create a unique layout. This slide presents process for estimating and forecasting sales in startup business plan, helpful in determining true amount of potential revenue. It includes steps such as estimating sales run rate, adjusting seasonality, modifying sales based on market trends and accounting for business plan
Sales Forecasting Analysis Powerpoint Slide Ideas
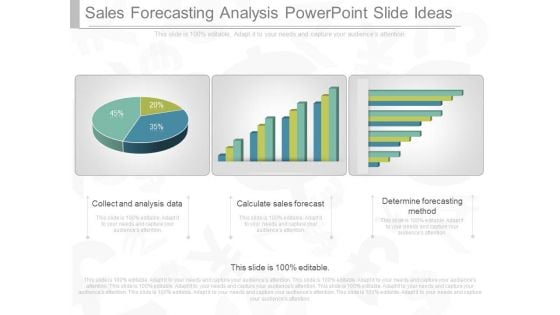
This is a sales forecasting analysis powerpoint slide ideas. This is a three stage process. The stages in this process are collect and analysis data, calculate sales forecast, determine forecasting method.
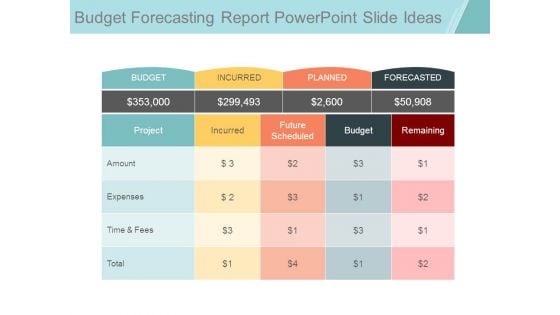
Budget Forecasting Report Powerpoint Slide Ideas
This is a budget forecasting report powerpoint slide ideas. This is a four stage process. The stages in this process are budget, incurred, planned, forecasted, project, future scheduled, remaining, amount, expenses, time and fees, total.

Demand Forecasting Ppt PowerPoint Presentation Guidelines
This is a demand forecasting ppt powerpoint presentation guidelines. This is a one stage process. The stages in this process are dynamic demand, trend, stable demand, demand quantity.
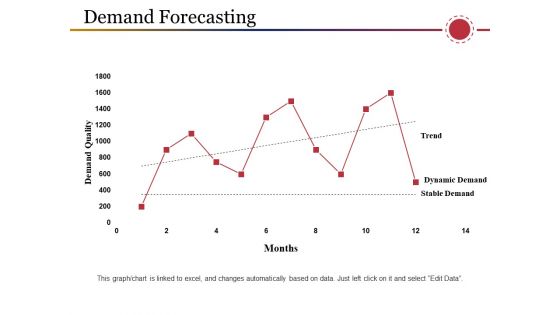
Demand Forecasting Ppt PowerPoint Presentation Outline Model
This is a demand forecasting ppt powerpoint presentation outline model. This is a one stage process. The stages in this process are demand quality, dynamic demand, stable demand, trend, finance.
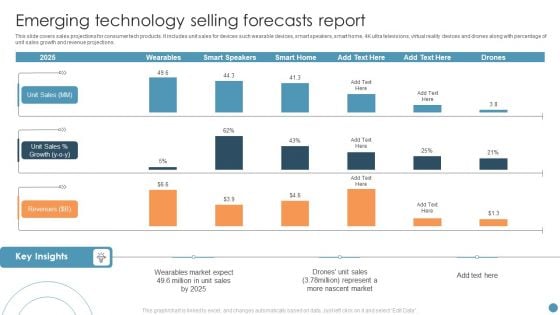
Emerging Technology Selling Forecasts Report Clipart PDF
This slide covers sales projections for consumer tech products. It includes unit sales for devices such wearable devices, smart speakers, smart home, 4K ultra televisions, virtual reality devices and drones along with percentage of unit sales growth and revenue projections. Showcasing this set of slides titled Emerging Technology Selling Forecasts Report Clipart PDF. The topics addressed in these templates are Emerging Technology Selling Forecasts, Market. All the content presented in this PPT design is completely editable. Download it and make adjustments in color, background, font etc. as per your unique business setting.
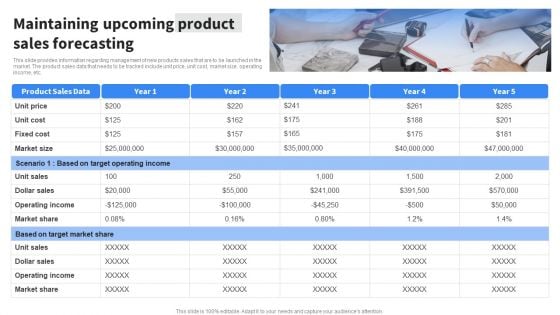
Maintaining Upcoming Product Sales Forecasting Demonstration PDF
This slide provides information regarding management of new products sales that are to be launched in the market. The product sales data that needs to be tracked include unit price, unit cost, market size, operating income, etc. Coming up with a presentation necessitates that the majority of the effort goes into the content and the message you intend to convey. The visuals of a PowerPoint presentation can only be effective if it supplements and supports the story that is being told. Keeping this in mind our experts created Maintaining Upcoming Product Sales Forecasting Demonstration PDF to reduce the time that goes into designing the presentation. This way, you can concentrate on the message while our designers take care of providing you with the right template for the situation.
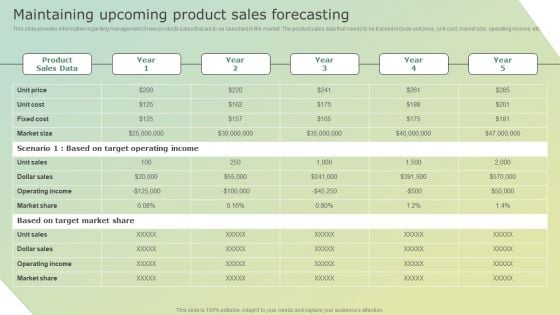
Maintaining Upcoming Product Sales Forecasting Rules PDF
This slide provides information regarding management of new products sales that are to be launched in the market. The product sales data that needs to be tracked include unit price, unit cost, market size, operating income, etc. Slidegeeks is here to make your presentations a breeze with Maintaining Upcoming Product Sales Forecasting Rules PDF With our easy to use and customizable templates, you can focus on delivering your ideas rather than worrying about formatting. With a variety of designs to choose from, you are sure to find one that suits your needs. And with animations and unique photos, illustrations, and fonts, you can make your presentation pop. So whether you are giving a sales pitch or presenting to the board, make sure to check out Slidegeeks first.
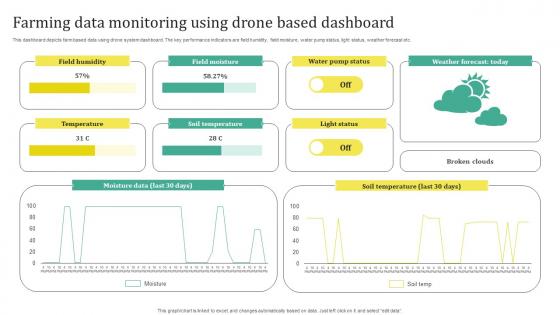
Farming Data Monitoring Using Drone Based Dashboard Sample Pdf
This dashboard depicts farm based data using drone system dashboard. The key performance indicators are field humidity, field moisture, water pump status, light status, weather forecast etc. Pitch your topic with ease and precision using this Farming Data Monitoring Using Drone Based Dashboard Sample Pdf. This layout presents information on Temperature, Soil Temperature, Light Status. It is also available for immediate download and adjustment. So, changes can be made in the color, design, graphics or any other component to create a unique layout. This dashboard depicts farm based data using drone system dashboard. The key performance indicators are field humidity, field moisture, water pump status, light status, weather forecast etc.
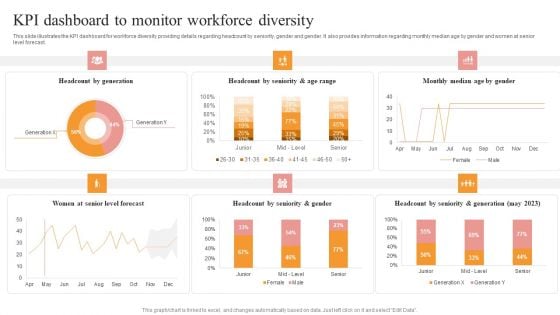
KPI Dashboard To Monitor Workforce Diversity Portrait PDF
This slide illustrates the KPI dashboard for workforce diversity providing details regarding headcount by seniority, gender and gender. It also provides information regarding monthly median age by gender and women at senior level forecast. Welcome to our selection of the KPI Dashboard To Monitor Workforce Diversity Portrait PDF. These are designed to help you showcase your creativity and bring your sphere to life. Planning and Innovation are essential for any business that is just starting out. This collection contains the designs that you need for your everyday presentations. All of our PowerPoints are 100 percent editable, so you can customize them to suit your needs. This multi purpose template can be used in various situations. Grab these presentation templates today.
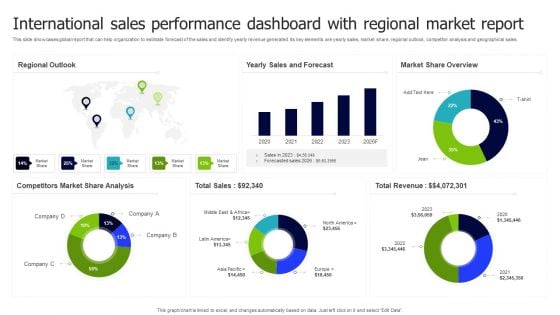
International Sales Performance Dashboard With Regional Market Report Inspiration PDF
This slide showcases global report that can help organization to estimate forecast of the sales and identify yearly revenue generated. Its key elements are yearly sales, market share, regional outlook, competitor analysis and geographical sales. Pitch your topic with ease and precision using this International Sales Performance Dashboard With Regional Market Report Inspiration PDF. This layout presents information on Regional Outlook, Sales And Forecast, Market Share Overview. It is also available for immediate download and adjustment. So, changes can be made in the color, design, graphics or any other component to create a unique layout.
Sales Techniques Playbook Sales Management Activities Tracking Dashboard Pictures PDF
This slide provides information regarding sales management activities tracking dashboard to measure closed business, sales pipeline, sales activity by sales rep, month over month growth, forecast by month, etc. Deliver and pitch your topic in the best possible manner with this sales techniques playbook sales management activities tracking dashboard pictures pdf Use them to share invaluable insights on sales management activities tracking dashboard and impress your audience. This template can be altered and modified as per your expectations. So, grab it now.
Scrum Master Dashboard For Project Management Priority Icons PDF
This slide provides information regarding scrum master dashboard for project management to track overall project progress. Deliver an awe-inspiring pitch with this creative scrum master dashboard for project management priority icons pdf bundle. Topics like projects, key resources, marketing sight, sales pipeline, forecast can be discussed with this completely editable template. It is available for immediate download depending on the needs and requirements of the user.
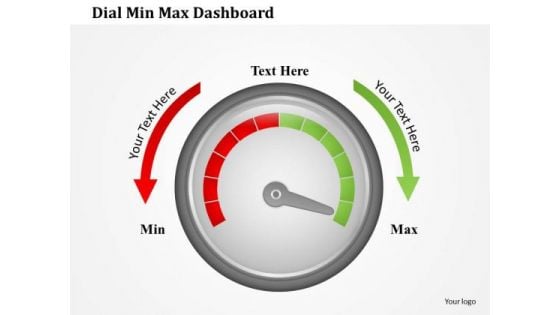
Business Framework Dial Min Max Dashboard PowerPoint Presentation
This professional power point template slide has been crafted with graphic of two funnels. These funnels are used to show any data calculation or process flow. Use this PPT for your business presentation and become a professional presenter.
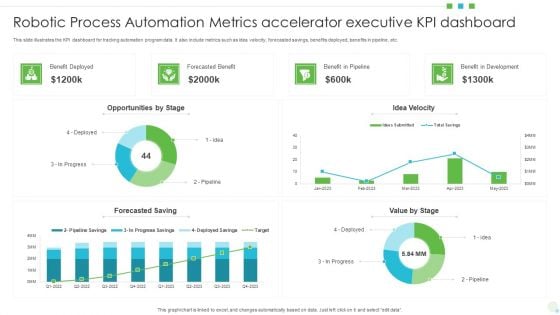
Robotic Process Automation Metrics Accelerator Executive KPI Dashboard Formats PDF
This slide illustrates the KPI dashboard for tracking automation program data. It also include metrics such as idea velocity, forecasted savings, benefits deployed, benefits in pipeline, etc. Showcasing this set of slides titled Robotic Process Automation Metrics Accelerator Executive KPI Dashboard Formats PDF. The topics addressed in these templates are Opportunities, Benefit In Development, Value. All the content presented in this PPT design is completely editable. Download it and make adjustments in color, background, font etc. as per your unique business setting.
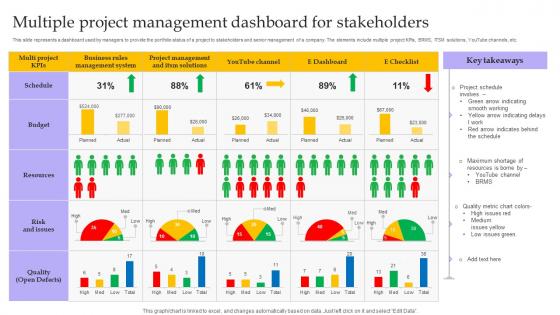
Multiple Project Management Dashboard For Stakeholders Portrait Pdf
This slide represents a dashboard used by managers to provide the portfolio status of a project to stakeholders and senior management of a company. The elements include multiple project KPIs, BRMS, ITSM solutions, YouTube channels, etc. Pitch your topic with ease and precision using this Multiple Project Management Dashboard For Stakeholders Portrait Pdf. This layout presents information on Multiple Project Management, Dashboard For Stakeholders, Youtube Channels. It is also available for immediate download and adjustment. So, changes can be made in the color, design, graphics or any other component to create a unique layout. This slide represents a dashboard used by managers to provide the portfolio status of a project to stakeholders and senior management of a company. The elements include multiple project KPIs, BRMS, ITSM solutions, YouTube channels, etc.
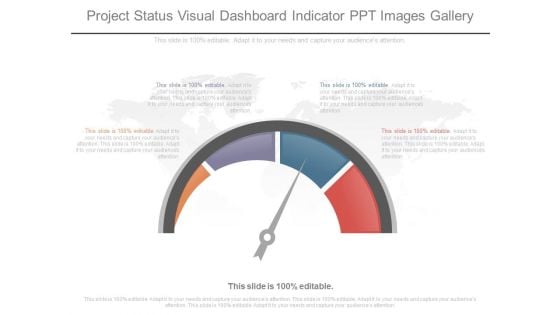
Project Status Visual Dashboard Indicator Ppt Images Gallery
This is a project status visual dashboard indicator ppt images gallery. This is a four stage process. The stages in this process are business, marketing, dashboard, measure, presentation.
3 Point Dashboard For Project Management Ppt PowerPoint Presentation Icon
This is a 3 point dashboard for project management ppt powerpoint presentation icon. This is a three stage process. The stages in this process are business, marketing, technology, measure, success.
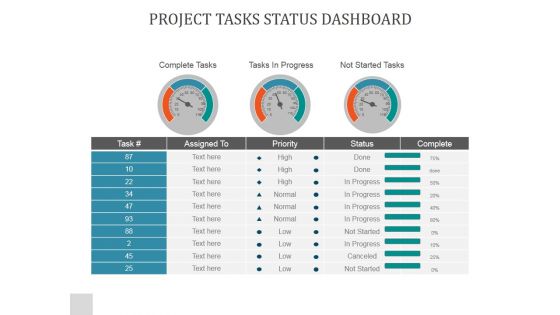
Project Tasks Status Dashboard Ppt PowerPoint Presentation Templates
This is a project tasks status dashboard ppt powerpoint presentation templates. This is a three stage process. The stages in this process are complete tasks, tasks in progress, not started tasks.
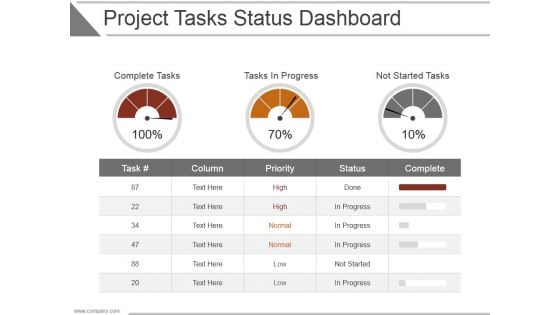
Project Tasks Status Dashboard Ppt PowerPoint Presentation Layouts
This is a project tasks status dashboard ppt powerpoint presentation layouts. This is a three stage process. The stages in this process are complete tasks, tasks in progress, not started tasks, complete, status.

Project Tasks Status Dashboard Ppt PowerPoint Presentation Professional Pictures
This is a project tasks status dashboard ppt powerpoint presentation professional pictures. This is a three stage process. The stages in this process are complete tasks, task in progress, not started tasks, task.
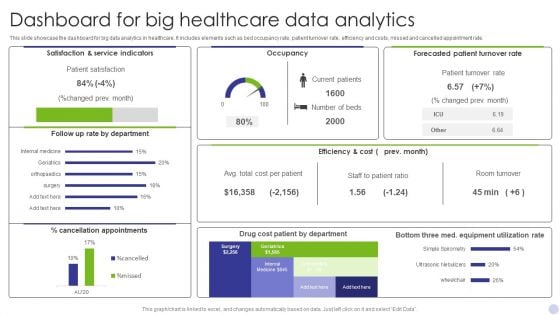
Dashboard For Big Healthcare Data Analytics Graphics PDF
This slide showcase the dashboard for big data analytics in healthcare. It includes elements such as bed occupancy rate, patient turnover rate, efficiency and costs, missed and cancelled appointment rate. Showcasing this set of slides titled Dashboard For Big Healthcare Data Analytics Graphics PDF. The topics addressed in these templates are Satisfaction Service Indicators, Occupancy, Forecasted Patient Turnover. All the content presented in this PPT design is completely editable. Download it and make adjustments in color, background, font etc. as per your unique business setting.
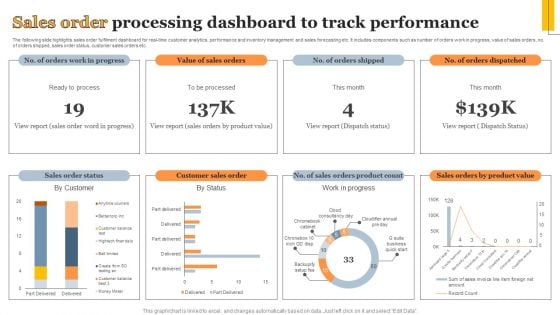
Sales Order Processing Dashboard To Track Performance Information PDF
The following slide highlights sales order fulfilment dashboard for real-time customer analytics, performance and inventory management and sales forecasting etc. It includes components such as number of orders work in progress, value of sales orders, no. of orders shipped, sales order status, customer sales orders etc. Showcasing this set of slides titled Sales Order Processing Dashboard To Track Performance Information PDF. The topics addressed in these templates are Sales Order Status, Customer Sales Order, Work Progress. All the content presented in this PPT design is completely editable. Download it and make adjustments in color, background, font etc. as per your unique business setting.
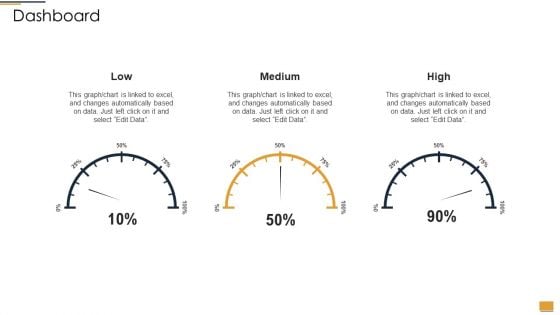
Project Ideation And Administration Dashboard Ppt File Slide PDF
This is a project ideation and administration dashboard ppt file slide pdf template with various stages. Focus and dispense information on three stages using this creative set, that comes with editable features. It contains large content boxes to add your information on topics like low, medium, high. You can also showcase facts, figures, and other relevant content using this PPT layout. Grab it now.

Healthcare Big Data Assessment Dashboard Slide2 Introduction PDF
This slide covers the records about the patients used to describe massive volumes of information created by the adoption of digital technologies that collect patients records and help in managing hospital performance. Showcasing this set of slides titled Healthcare Big Data Assessment Dashboard Slide2 Introduction PDF. The topics addressed in these templates are Forecasted Patient Turnover, Service Indicators, Occupancy. All the content presented in this PPT design is completely editable. Download it and make adjustments in color, background, font etc. as per your unique business setting.
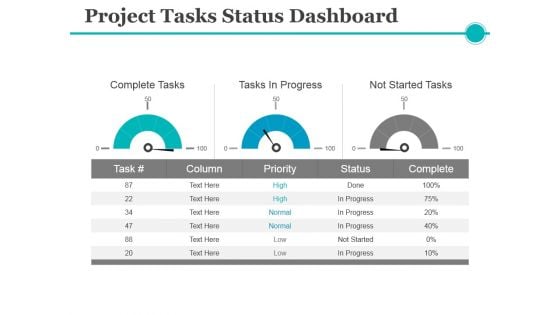
Project Tasks Status Dashboard Ppt PowerPoint Presentation File Graphics Download
This is a project tasks status dashboard ppt powerpoint presentation file graphics download. This is a three stage process. The stages in this process are complete tasks, tasks in progress, not started tasks.
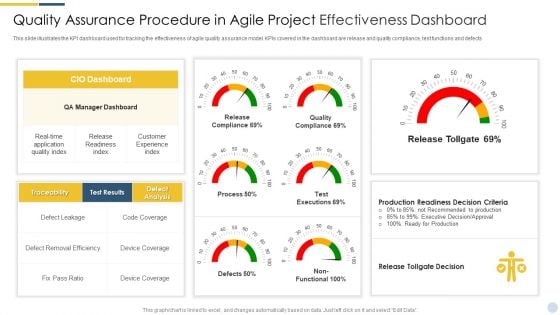
Quality Assurance Procedure In Agile Project Effectiveness Dashboard Formats PDF
This slide illustrates the KPI dashboard used for tracking the effectiveness of agile quality assurance model. KPIs covered in the dashboard are release and quality compliance, test functions and defects. Deliver and pitch your topic in the best possible manner with this quality assurance procedure in agile project effectiveness dashboard formats pdf. Use them to share invaluable insights on release tollgate decision, recommended to production, executive decision and impress your audience. This template can be altered and modified as per your expectations. So, grab it now.
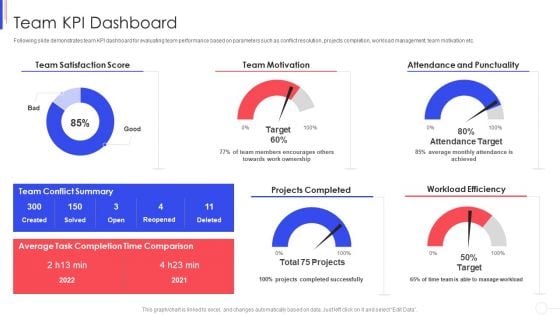
Strategy To Improve Team Proficiency Team KPI Dashboard Sample PDF
Following slide demonstrates team KPI dashboard for evaluating team performance based on parameters such as conflict resolution, projects completion, workload management, team motivation etc. Deliver and pitch your topic in the best possible manner with this strategy to improve team proficiency team kpi dashboard sample pdf. Use them to share invaluable insights on motivation, team, projects, efficiency and impress your audience. This template can be altered and modified as per your expectations. So, grab it now.
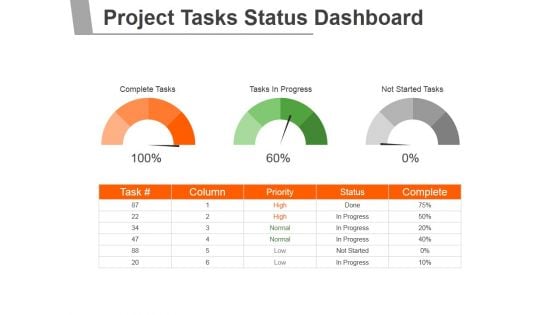
Project Tasks Status Dashboard Ppt PowerPoint Presentation Backgrounds
This is a project tasks status dashboard ppt powerpoint presentation backgrounds. This is a two stage process. The stages in this process are complete tasks, tasks in progress, not started tasks.
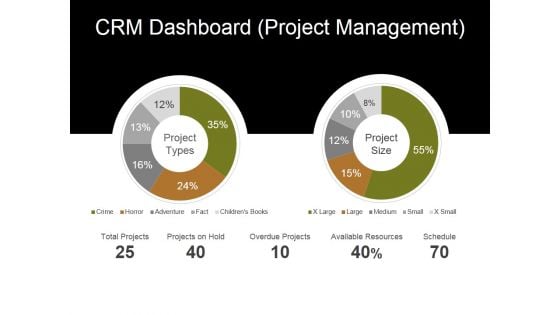
Crm Dashboard Project Management Ppt PowerPoint Presentation Layouts Ideas
This is a crm dashboard project management ppt powerpoint presentation layouts ideas. This is a two stage process. The stages in this process are total projects, projects on hold, overdue projects, available resources, schedule.
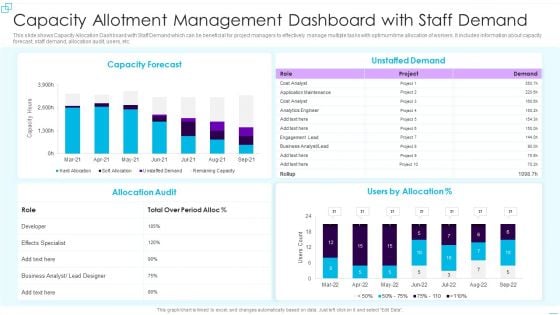
Capacity Allotment Management Dashboard With Staff Demand Rules PDF
This slide shows Capacity Allocation Dashboard with Staff Demand which can be beneficial for project managers to effectively manage multiple tasks with optimum time allocation of workers. It includes information about capacity forecast, staff demand, allocation audit, users, etc. Showcasing this set of slides titled Capacity Allotment Management Dashboard With Staff Demand Rules PDF. The topics addressed in these templates are Capacity Forecast, Allocation Audit, Unstaffed Demand. All the content presented in this PPT design is completely editable. Download it and make adjustments in color, background, font etc. as per your unique business setting.
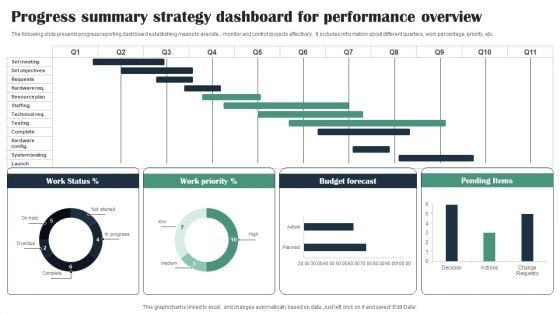
Progress Summary Strategy Dashboard For Performance Overview Diagrams PDF
The following slide presents progress reporting dashboard establishing means to execute , monitor and control projects effectively. It includes information about different quarters, work percentage, priority, etc. Showcasing this set of slides titled Progress Summary Strategy Dashboard For Performance Overview Diagrams PDF. The topics addressed in these templates are Work Status, Work Priority, Budget Forecast. All the content presented in this PPT design is completely editable. Download it and make adjustments in color, background, font etc. as per your unique business setting.

 Home
Home