Histogram
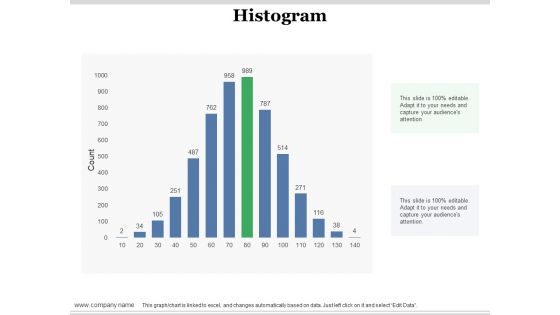
Histogram Ppt PowerPoint Presentation Gallery Objects
This is a histogram ppt powerpoint presentation gallery objects. This is a one stage process. The stages in this process are histogram, finance, business, marketing, management.

Evolution Histogram Ppt PowerPoint Presentation Complete Deck With Slides
This is a evolution histogram ppt powerpoint presentation complete deck with slides. This is a one stage process. The stages in this process are evolution histogram, business, management, strategy, marketing.
Histogram Ppt PowerPoint Presentation Icon Images
This is a histogram ppt powerpoint presentation icon images. This is a one stage process. The stages in this process are product, percentage, marketing, business.

Thank You Evolution Histogram Ppt PowerPoint Presentation Gallery Pictures
This is a thank you evolution histogram ppt powerpoint presentation gallery pictures. This is a one stage process. The stages in this process are thank you.
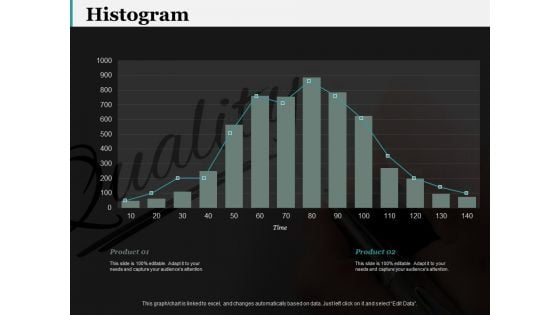
Histogram 7 QC Tools Ppt PowerPoint Presentation Gallery Layout
This is a histogram 7 qc tools ppt powerpoint presentation gallery layout. This is a two stage process. The stages in this process are business, finance, marketing, strategy, analysis.
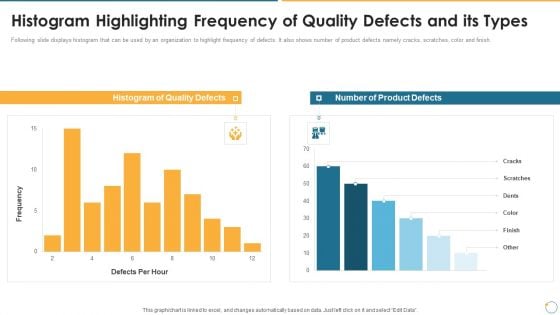
Collection Of Quality Assurance PPT Histogram Highlighting Frequency Of Quality Defects Slides PDF
Following slide displays histogram that can be used by an organization to highlight frequency of defects. It also shows number of product defects namely cracks, scratches, color and finish. Deliver an awe inspiring pitch with this creative collection of quality assurance ppt histogram highlighting frequency of quality defects slides pdf bundle. Topics like histogram highlighting frequency of quality defects and its types can be discussed with this completely editable template. It is available for immediate download depending on the needs and requirements of the user.
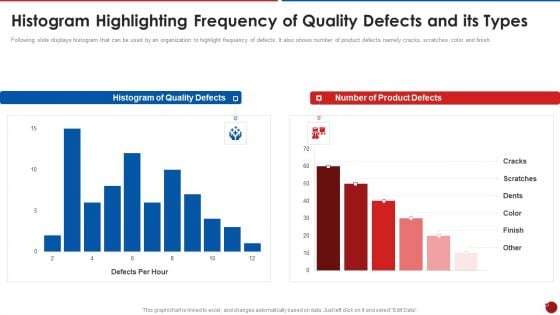
Quality Assurance Templates Set 2 Histogram Highlighting Frequency Of Quality Defects And Its Types Professional PDF
Following slide displays histogram that can be used by an organization to highlight frequency of defects. It also shows number of product defects namely cracks, scratches, color and finish. Deliver an awe inspiring pitch with this creative quality assurance templates set 2 histogram highlighting frequency of quality defects and its types professional pdf bundle. Topics like histogram of quality defects, number of product defects can be discussed with this completely editable template. It is available for immediate download depending on the needs and requirements of the user.
QA Plan Set 2 Histogram Highlighting Frequency Of Quality Defects And Its Types Template PDF
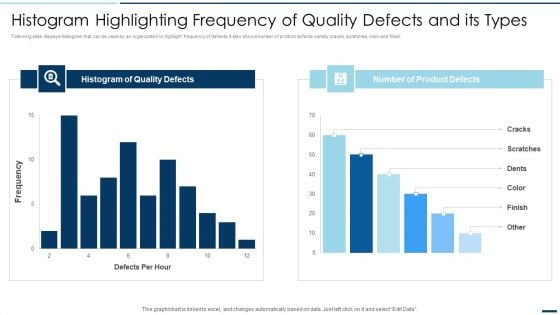
Following slide displays histogram that can be used by an organization to highlight frequency of defects. It also shows number of product defects namely cracks, scratches, color and finish. Deliver an awe inspiring pitch with this creative QA Plan Set 2 Histogram Highlighting Frequency Of Quality Defects And Its Types Template PDF bundle. Topics like Histogram Quality Defects, Number Product Defects can be discussed with this completely editable template. It is available for immediate download depending on the needs and requirements of the user.
Histogram Column Chart With Red Arrow Vector Icon Ppt PowerPoint Presentation Outline Ideas Cpb
This is a histogram column chart with red arrow vector icon ppt powerpoint presentation outline ideas cpb. This is a three stage process. The stages in this process are bar chart icon, bar graph icon, data chart icon.
Histogram Financial Analysis Vector Icon Ppt PowerPoint Presentation Layouts File Formats Cpb
This is a histogram financial analysis vector icon ppt powerpoint presentation layouts file formats cpb. This is a three stage process. The stages in this process are bar chart icon, bar graph icon, data chart icon.
Histogram Icon Showing Economic Fluctuations Ppt PowerPoint Presentation Slides Samples Cpb
This is a histogram icon showing economic fluctuations ppt powerpoint presentation slides samples cpb. This is a three stage process. The stages in this process are bar chart icon, bar graph icon, data chart icon.
Histogram Showing Business Trends Vector Icon Ppt PowerPoint Presentation Styles Portrait Cpb
This is a histogram showing business trends vector icon ppt powerpoint presentation styles portrait cpb. This is a three stage process. The stages in this process are bar chart icon, bar graph icon, data chart icon.
Histogram With Dollar For Financial Success Vector Icon Ppt PowerPoint Presentation Portfolio Example File Cpb
This is a histogram with dollar for financial success vector icon ppt powerpoint presentation portfolio example file cpb. This is a three stage process. The stages in this process are bar chart icon, bar graph icon, data chart icon.
Histogram With Gear Vector Icon Ppt PowerPoint Presentation Professional Slides Cpb
This is a histogram with gear vector icon ppt powerpoint presentation professional slides cpb. This is a three stage process. The stages in this process are bar chart icon, bar graph icon, data chart icon.
Quality Management Plan Templates Set 2 Histogram Highlighting Frequency Of Quality Defects And Its Types Guidelines PDF
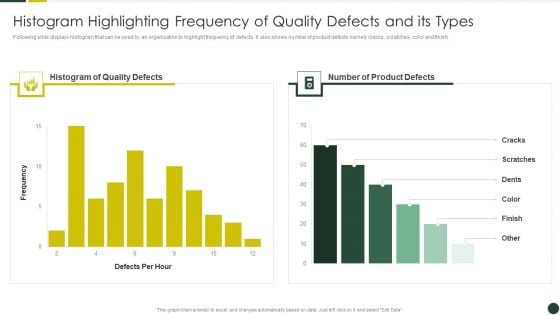
Following slide displays histogram that can be used by an organization to highlight frequency of defects. It also shows number of product defects namely cracks, scratches, color and finish.Deliver and pitch your topic in the best possible manner with this Quality Management Plan Templates Set 2 Histogram Highlighting Frequency Of Quality Defects And Its Types Guidelines PDF Use them to share invaluable insights on Product Defects, Quality Defects, Histogram and impress your audience. This template can be altered and modified as per your expectations. So, grab it now.
data collection histograms ppt powerpoint presentation example
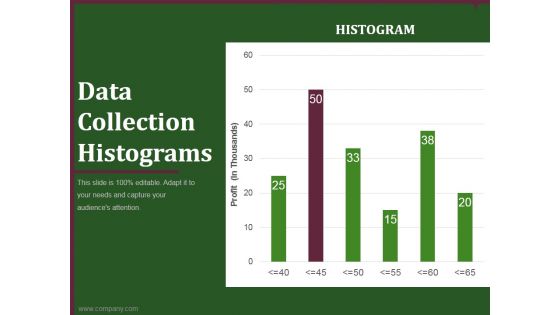
This is a data collection histograms ppt powerpoint presentation example. This is a six stage process. The stages in this process are business, planning, marketing, histograms, graph.
Data Collection Histograms Ppt PowerPoint Presentation Diagrams
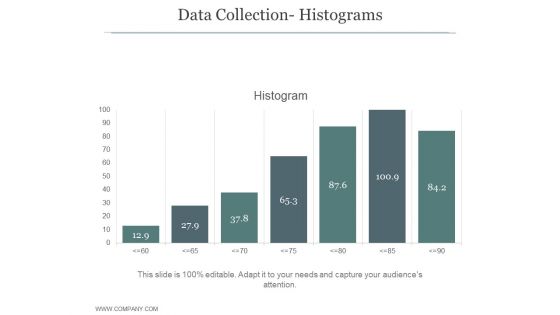
This is a data collection histograms ppt powerpoint presentation diagrams. This is a seven stage process. The stages in this process are business, strategy, growth strategy, marketing, histogram, finance.
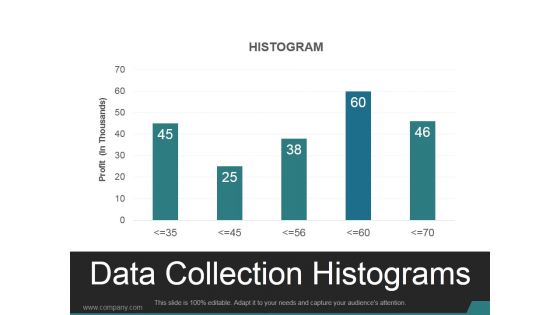
Data Collection Histograms Ppt PowerPoint Presentation Design Templates
This is a data collection histograms ppt powerpoint presentation design templates. This is a five stage process. The stages in this process are histogram, business, marketing, analysis, chart.
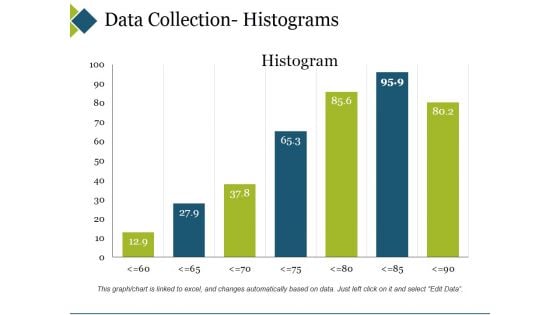
Data Collection Histograms Ppt PowerPoint Presentation Show Topics
This is a data collection histograms ppt powerpoint presentation show topics. This is a seven stage process. The stages in this process are business, marketing, histogram, finance, graph.
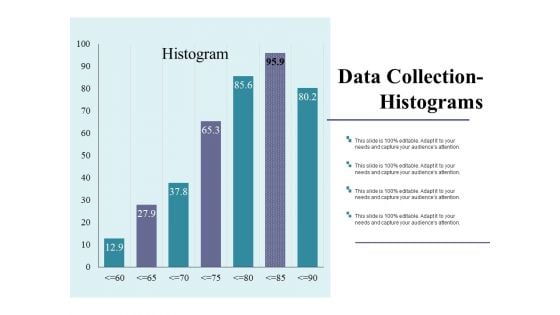
Data Collection Histograms Ppt PowerPoint Presentation Outline Show
This is a data collection histograms ppt powerpoint presentation outline show. This is a seven stage process. The stages in this process are business, marketing, strategy, finance, analysis.
Data Collection Histograms Ppt PowerPoint Presentation Icon Slides
This is a data collection histograms ppt powerpoint presentation icon slides. This is a two stage process. The stages in this process are bar chart, finance, marketing, business, analysis.

Graph Business PowerPoint Background And Template 1210
Microsoft PowerPoint Template and Background with a 3d rendering of a gold bars histogram Holster your thoughts in our Graph Business PowerPoint Background And Template 1210. You'll be faster on the draw.
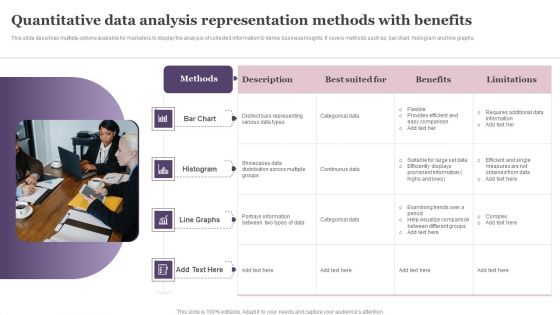
Quantitative Data Analysis Representation Methods With Benefits Template PDF
This slide describes multiple options available for marketers to display the analysis of collected information to derive business insights. It covers methods such as, bar chart, histogram and line graphs. Persuade your audience using this Quantitative Data Analysis Representation Methods With Benefits Template PDF. This PPT design covers four stages, thus making it a great tool to use. It also caters to a variety of topics including Bar Chart, Histogram, Line Graphs. Download this PPT design now to present a convincing pitch that not only emphasizes the topic but also showcases your presentation skills.

Collection Of Quality Assurance PPT Seven Basic Quality Control Tools Inspiration PDF
Following slide illustrates seven basic quality control tools that organization may use to maintain its product quality. Tools covered are fish bone, flow chart, control chart, pareto chart, check sheet, histogram and scatter plot. This is a collection of quality assurance ppt seven basic quality control tools inspiration pdf template with various stages. Focus and dispense information on seven stages using this creative set, that comes with editable features. It contains large content boxes to add your information on topics like control chart, flow charts, pareto chart, scatter plot, histogram. You can also showcase facts, figures, and other relevant content using this PPT layout. Grab it now.
IT Industry Market Research Forecasting Revenue And Growth Of SaaS Company Elements Pdf
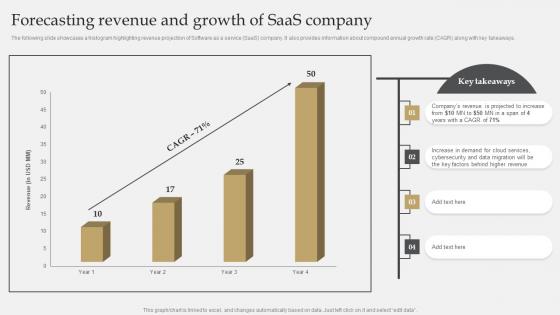
The following slide showcases a histogram highlighting revenue projection of Software as a service SaaS company. It also provides information about compound annual growth rate CAGR along with key takeaways. Slidegeeks is here to make your presentations a breeze with IT Industry Market Research Forecasting Revenue And Growth Of SaaS Company Elements Pdf With our easy-to-use and customizable templates, you can focus on delivering your ideas rather than worrying about formatting. With a variety of designs to choose from, you are sure to find one that suits your needs. And with animations and unique photos, illustrations, and fonts, you can make your presentation pop. So whether you are giving a sales pitch or presenting to the board, make sure to check out Slidegeeks first. The following slide showcases a histogram highlighting revenue projection of Software as a service SaaS company. It also provides information about compound annual growth rate CAGR along with key takeaways.
QC Engineering Introducing Quality Control Tools Within The Organization Ppt Infographic Template Design Templates PDF
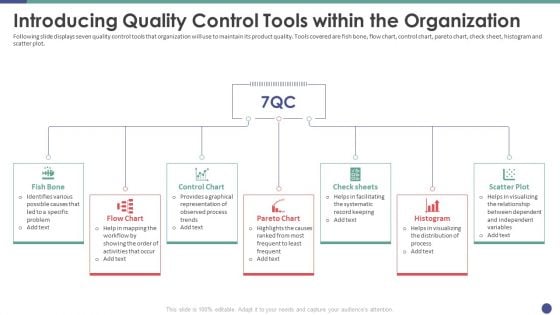
Following slide displays seven quality control tools that organization will use to maintain its product quality. Tools covered are fish bone, flow chart, control chart, pareto chart, check sheet, histogram and scatter plot. Presenting qc engineering introducing quality control tools within the organization ppt infographic template design templates pdf to provide visual cues and insights. Share and navigate important information on seven stages that need your due attention. This template can be used to pitch topics like fish bone, flow chart, control chart, pareto chart, check sheets. In addtion, this PPT design contains high resolution images, graphics, etc, that are easily editable and available for immediate download.

Quality Assurance Templates Set 3 Seven Basic Quality Control Tools Template PDF
Following slide illustrates seven basic quality control tools that organization may use to maintain its product quality. Tools covered are fish bone, flow chart, control chart, pareto chart, check sheet, histogram and scatter plot. This is a quality assurance templates set 3 seven basic quality control tools template pdf template with various stages. Focus and dispense information on seven stages using this creative set, that comes with editable features. It contains large content boxes to add your information on topics like fish bone, flow charts, control chart, pareto chart, check sheets. You can also showcase facts, figures, and other relevant content using this PPT layout. Grab it now.
Contents For QA Plan And Process Set 3 Seven Basic Quality Control Tools Demonstration PDF
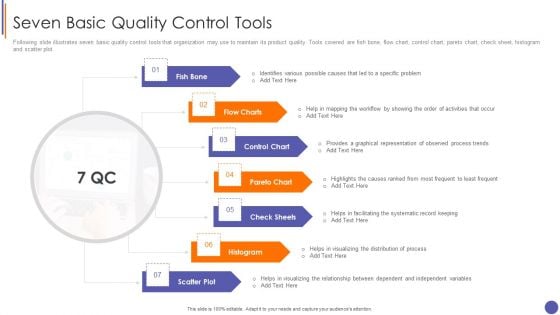
Following slide illustrates seven basic quality control tools that organization may use to maintain its product quality. Tools covered are fish bone, flow chart, control chart, pareto chart, check sheet, histogram and scatter plot.This is a Contents For QA Plan And Process Set 3 Seven Basic Quality Control Tools Demonstration PDF template with various stages. Focus and dispense information on seven stages using this creative set, that comes with editable features. It contains large content boxes to add your information on topics like Identifies Various, Graphical Representation, Facilitating The Systematic You can also showcase facts, figures, and other relevant content using this PPT layout. Grab it now.
Quality Control Plan Seven Basic Quality Control Tools Brochure PDF
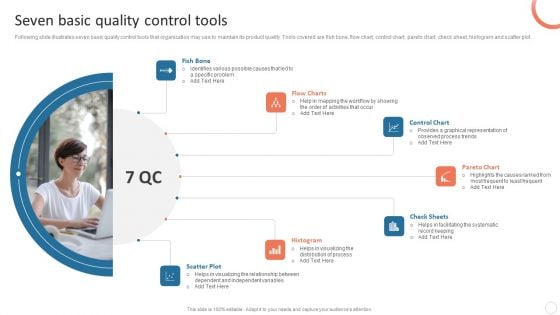
Following slide illustrates seven basic quality control tools that organization may use to maintain its product quality. Tools covered are fish bone, flow chart, control chart, pareto chart, check sheet, histogram and scatter plot. Coming up with a presentation necessitates that the majority of the effort goes into the content and the message you intend to convey. The visuals of a PowerPoint presentation can only be effective if it supplements and supports the story that is being told. Keeping this in mind our experts created Quality Control Plan Seven Basic Quality Control Tools Brochure PDF to reduce the time that goes into designing the presentation. This way, you can concentrate on the message while our designers take care of providing you with the right template for the situation.
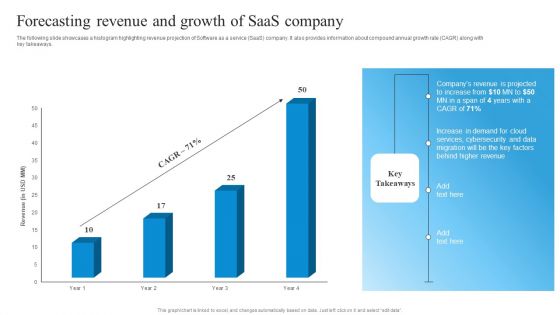
Market Evaluation Of IT Industry Forecasting Revenue And Growth Of Saas Company Guidelines PDF
The following slide showcases a histogram highlighting revenue projection of Software as a service SaaS company. It also provides information about compound annual growth rate CAGR along with key takeaways. Whether you have daily or monthly meetings, a brilliant presentation is necessary. Market Evaluation Of IT Industry Forecasting Revenue And Growth Of Saas Company Guidelines PDF can be your best option for delivering a presentation. Represent everything in detail using Market Evaluation Of IT Industry Forecasting Revenue And Growth Of Saas Company Guidelines PDF and make yourself stand out in meetings. The template is versatile and follows a structure that will cater to your requirements. All the templates prepared by Slidegeeks are easy to download and edit. Our research experts have taken care of the corporate themes as well. So, give it a try and see the results.
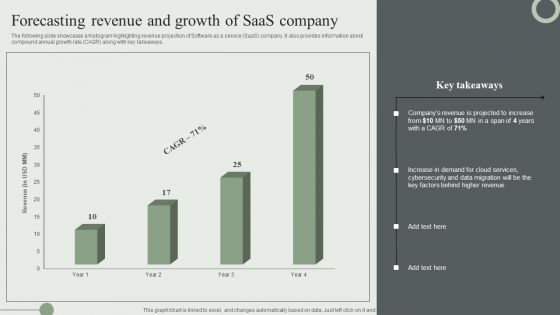
Forecasting Revenue And Growth Of Saas Company Ppt PowerPoint Presentation File Pictures PDF
The following slide showcases a histogram highlighting revenue projection of Software as a service SaaS company. It also provides information about compound annual growth rate CAGR along with key takeaways. Create an editable Forecasting Revenue And Growth Of Saas Company Ppt PowerPoint Presentation File Pictures PDF that communicates your idea and engages your audience. Whether youre presenting a business or an educational presentation, pre designed presentation templates help save time. Forecasting Revenue And Growth Of Saas Company Ppt PowerPoint Presentation File Pictures PDF is highly customizable and very easy to edit, covering many different styles from creative to business presentations. Slidegeeks has creative team members who have crafted amazing templates. So, go and get them without any delay.
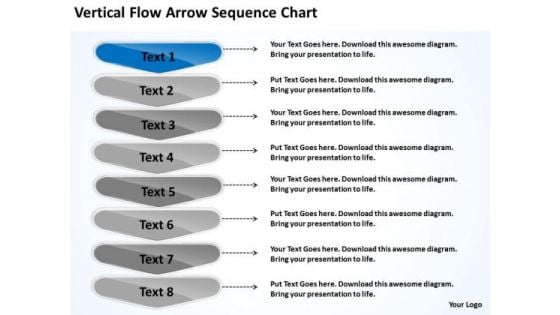
Vertical Flow Arrow Sequence Chart Website Business Plan PowerPoint Slides
We present our vertical flow arrow sequence chart website business plan PowerPoint Slides.Download and present our Arrow PowerPoint Templates because you know that the core of any organisation is the people who work for it. Present our Business PowerPoint Templates because spell out your advertising plans to increase market share. The feedback has been positive and productive. Present our Marketing PowerPoint Templates because they are truly some of the wonders of our life. Download and present our Shapes PowerPoint Templates because it has inspired a whole new world of medical endeavour. Download our Process and Flows PowerPoint Templates because forward thinking is the way to go.Use these PowerPoint slides for presentations relating to Advertising, arrow, business, creative, design, flyer,form, histogram, illustration, infographic,information, label, layout, leaflet, menu,navigation, number, options, order,origami, paper, pattern, product,promotion, ribbon, sequence, site,special, stationery, step, symbol, tab, text, vector, version, web, web design, website. The prominent colors used in the PowerPoint template are Blue, Gray, White. PowerPoint presentation experts tell us our vertical flow arrow sequence chart website business plan PowerPoint Slides are Dynamic. PowerPoint presentation experts tell us our business PowerPoint templates and PPT Slides are Appealing. You can be sure our vertical flow arrow sequence chart website business plan PowerPoint Slides are Glamorous. You can be sure our histogram PowerPoint templates and PPT Slides are Bold. PowerPoint presentation experts tell us our vertical flow arrow sequence chart website business plan PowerPoint Slides are Lush. People tell us our creative PowerPoint templates and PPT Slides are Pretty. App-date your audience with our Vertical Flow Arrow Sequence Chart Website Business Plan PowerPoint Slides. Familiarize them with the current fad.
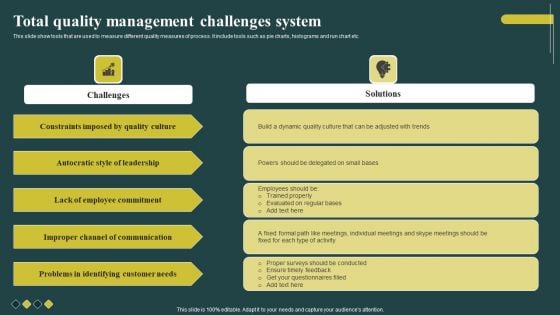
Total Quality Management Challenges System Themes PDF
This slide show tools that are used to measure different quality measures of process. It include tools such as pie charts, histograms and run chart etc. Showcasing this set of slides titled Total Quality Management Challenges System Themes PDF. The topics addressed in these templates are Employee Commitment, Communication, Customer Needs. All the content presented in this PPT design is completely editable. Download it and make adjustments in color, background, font etc. as per your unique business setting.
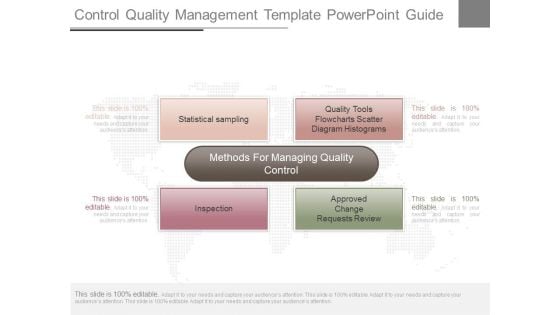
Control Quality Management Template Powerpoint Guide
This is a control quality management template powerpoint guide. This is a four stage process. The stages in this process are methods for managing quality control, statistical sampling, quality tools flowcharts scatter diagram histograms, inspection, approved change requests review.
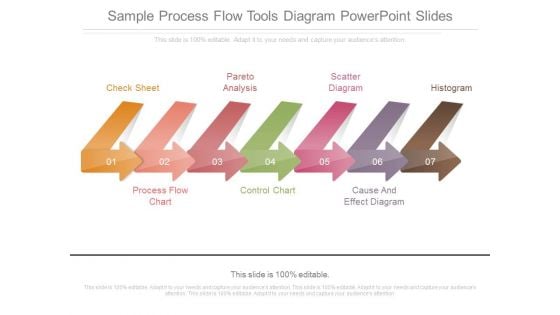
Sample Process Flow Tools Diagram Powerpoint Slides
This is a sample process flow tools diagram powerpoint slides. This is a seven stage process. The stages in this process are check sheet, process flow chart, pareto analysis, control chart, scatter diagram, cause and effect diagram, histogram.
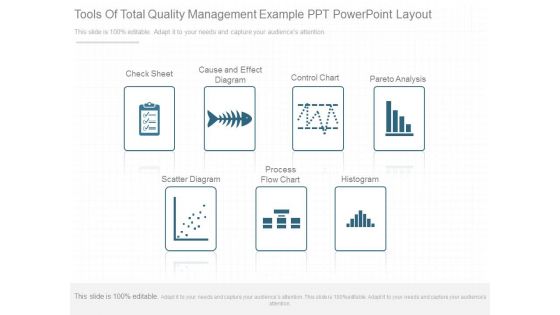
Tools Of Total Quality Management Example Ppt Powerpoint Layout
This is a tools of total quality management example ppt powerpoint layout. This is a seven stage process. The stages in this process are check sheet, cause and effect diagram, control chart, pareto analysis, scatter diagram, process flow chart, histogram.
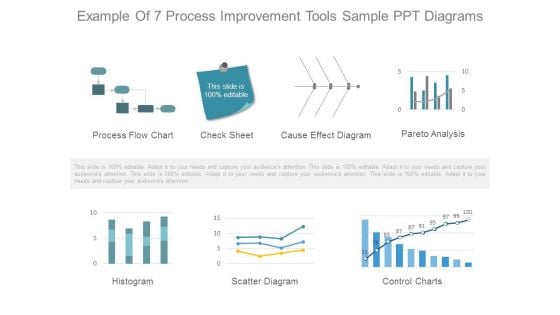
Example Of 7 Process Improvement Tools Sample Ppt Diagrams
This is a example of 7 process improvement tools sample ppt diagrams. This is a seven stage process. The stages in this process are process flow chart, check sheet, cause effect diagram, pareto analysis, histogram, scatter diagram, control charts.
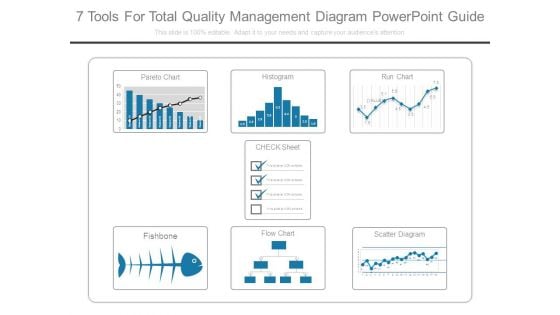
7 Tools For Total Quality Management Diagram Powerpoint Guide
This is a 7 tools for total quality management diagram powerpoint guide. This is a six stage process. The stages in this process are pareto chart, histogram, run chart, check sheet, fishbone, flow chart, scatter diagram.
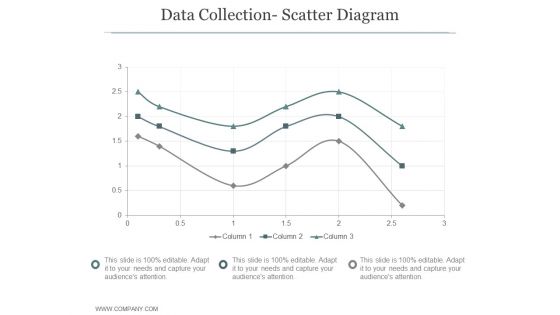
Data Collection Scatter Diagram Ppt PowerPoint Presentation Shapes
This is a data collection scatter diagram ppt powerpoint presentation shapes. This is a three stage process. The stages in this process are business, strategy, growth strategy, marketing, histogram, finance.
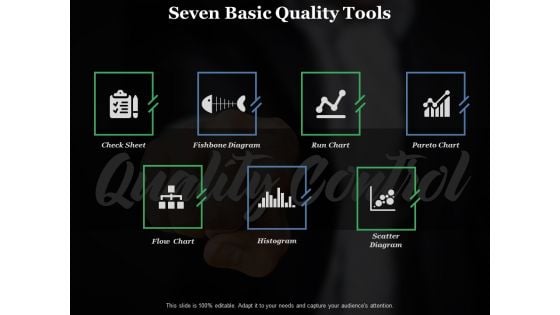
Seven Basic Quality Tools Ppt PowerPoint Presentation Show Grid
This is a seven basic quality tools ppt powerpoint presentation show grid. This is a seven stage process. The stages in this process are fishbone diagram, run chart, histogram, flow chart, scatter diagram.
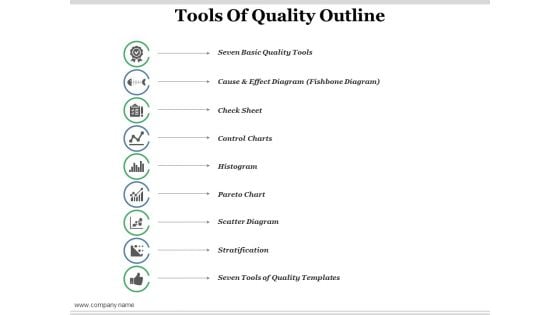
Tools Of Quality Outline Ppt PowerPoint Presentation Summary Introduction
This is a tools of quality outline ppt powerpoint presentation summary introduction. This is a nine stage process. The stages in this process are stratification, scatter diagram, histogram, control charts, seven basic quality tools.
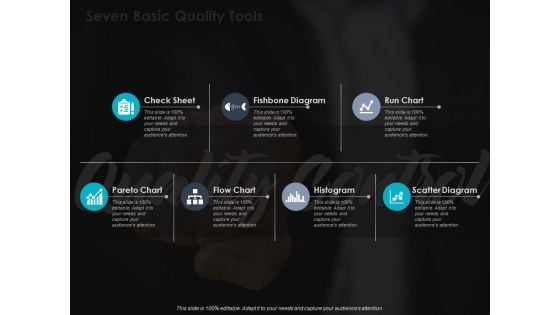
Seven Basic Quality Tools Ppt PowerPoint Presentation Layouts Example File
This is a seven basic quality tools ppt powerpoint presentation layouts example file. This is a seven stage process. The stages in this process are Check Sheet, Fishbone Diagram, Histogram, Run Chart.
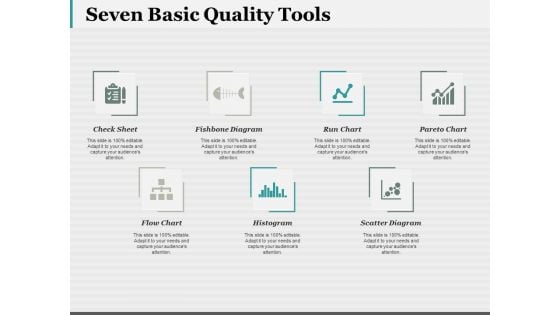
Seven Basic Quality Tools Ppt PowerPoint Presentation Outline Visual Aids
This is a seven basic quality tools ppt powerpoint presentation outline visual aids. This is a seven stage process. The stages in this process are fishbone diagram, run chart, pareto chart, histogram, flow chart.
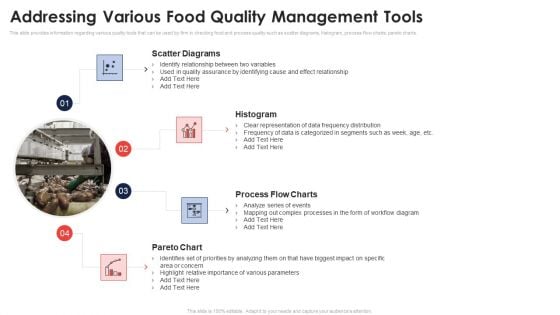
Addressing Various Food Quality Management Tools Application Of Quality Management For Food Processing Companies Clipart PDF
This slide provides information regarding various quality tools that can be used by firm in checking food and process quality such as scatter diagrams, histogram, process flow charts, pareto charts. Presenting addressing various food quality management tools application of quality management for food processing companies clipart pdf to provide visual cues and insights. Share and navigate important information on four stages that need your due attention. This template can be used to pitch topics like scatter diagrams, histogram, process flow charts, pareto chart. In addtion, this PPT design contains high resolution images, graphics, etc, that are easily editable and available for immediate download.
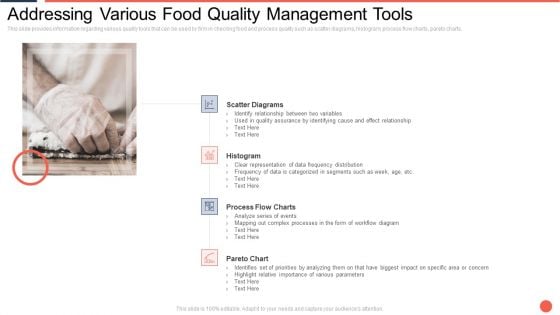
Addressing Various Food Quality Management Tools Assuring Food Quality And Hygiene Formats PDF
This slide provides information regarding various quality tools that can be used by firm in checking food and process quality such as scatter diagrams, histogram, process flow charts, pareto charts. Deliver an awe inspiring pitch with this creative addressing various food quality management tools assuring food quality and hygiene formats pdf bundle. Topics like scatter diagrams, histogram, process flow charts, pareto chart can be discussed with this completely editable template. It is available for immediate download depending on the needs and requirements of the user.
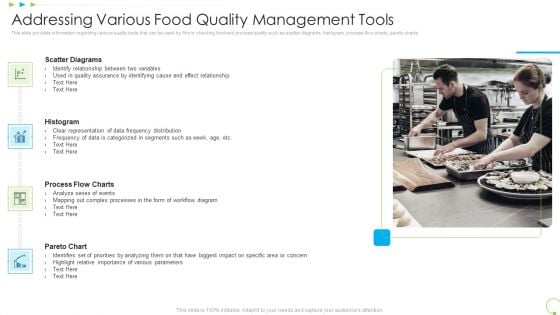
Addressing Various Food Quality Management Tools Uplift Food Production Company Quality Standards Microsoft PDF
This slide provides information regarding various quality tools that can be used by firm in checking food and process quality such as scatter diagrams, histogram, process flow charts, pareto charts. Deliver an awe inspiring pitch with this creative addressing various food quality management tools uplift food production company quality standards microsoft pdf bundle. Topics like scatter diagrams, histogram, process flow charts, pareto chart can be discussed with this completely editable template. It is available for immediate download depending on the needs and requirements of the user.
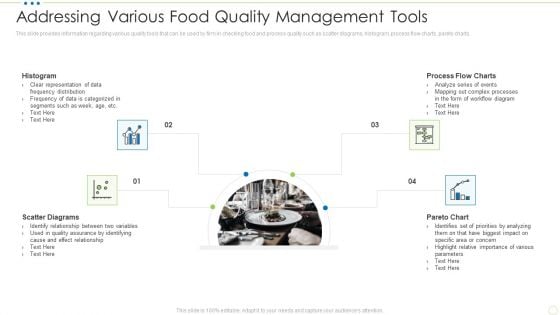
Addressing Various Food Quality Management Tools Food Security Excellence Ppt Inspiration Example PDF
This slide provides information regarding various quality tools that can be used by firm in checking food and process quality such as scatter diagrams, histogram, process flow charts, pareto charts. This is a addressing various food quality management tools food security excellence ppt inspiration example pdf template with various stages. Focus and dispense information on four stages using this creative set, that comes with editable features. It contains large content boxes to add your information on topics like scatter diagrams, histogram, process flow charts, pareto chart. You can also showcase facts, figures, and other relevant content using this PPT layout. Grab it now.
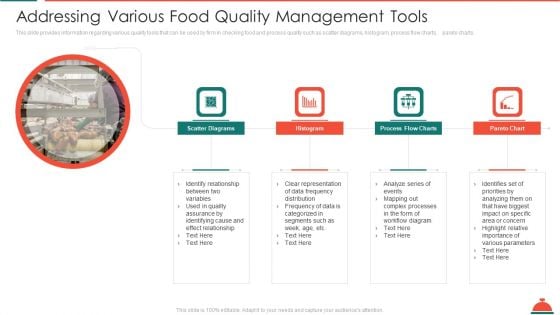
Addressing Various Food Quality Management Tools Increased Superiority For Food Products Graphics PDF
This slide provides information regarding various quality tools that can be used by firm in checking food and process quality such as scatter diagrams, histogram, process flow charts, pareto charts. This is a addressing various food quality management tools increased superiority for food products graphics pdf template with various stages. Focus and dispense information on four stages using this creative set, that comes with editable features. It contains large content boxes to add your information on topics like scatter diagrams, histogram, process flow charts, pareto chart. You can also showcase facts, figures, and other relevant content using this PPT layout. Grab it now.
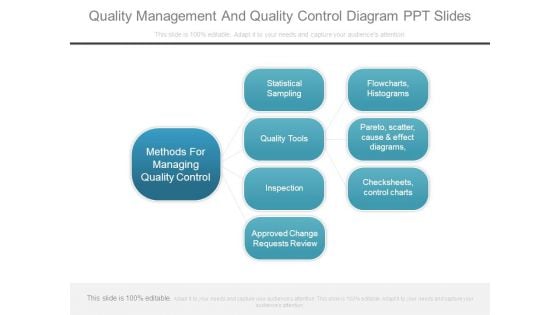
Quality Management And Quality Control Diagram Ppt Slides
This is a quality management and quality control diagram ppt slides. This is a three stage process. The stages in this process are methods for managing quality control, statistical sampling, quality tools, inspection, approved change requests review, flowcharts, histograms, pareto, scatter, cause and effect diagrams, checksheets, control charts.
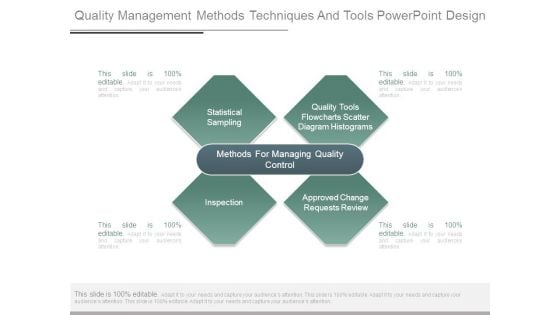
Quality Management Methods Techniques And Tools Powerpoint Design
This is a quality management methods techniques and tools powerpoint design. This is a four stage process. The stages in this process are statistical sampling, quality tools flowcharts scatter diagram histograms, methods for managing quality control, inspection, approved change requests review.
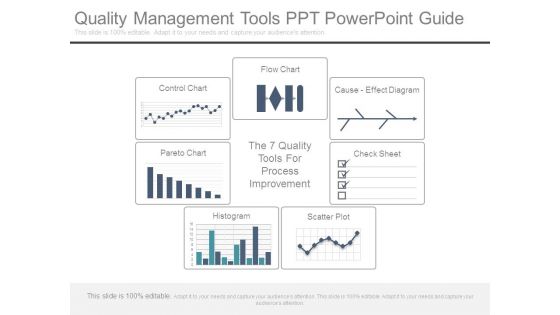
Quality Management Tools Ppt Powerpoint Guide
This is a quality management tools ppt powerpoint guide. This is a seven stage process. The stages in this process are control chart, flow chart, cause effect diagram, pareto chart, the 7 quality tools, for process improvement, check sheet, histogram, scatter plot.
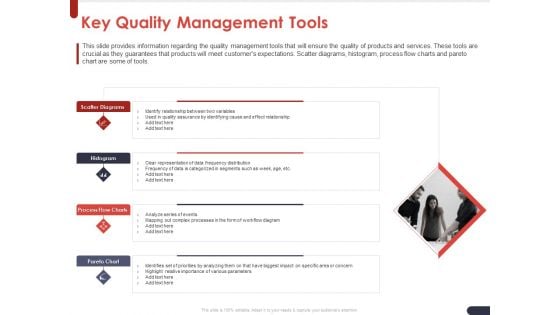
Project Quality Planning And Controlling Key Quality Management Tools Introduction PDF
Presenting this set of slides with name project quality planning and controlling key quality management tools introduction pdf. This is a four stage process. The stages in this process are scatter diagrams, histogram, process flow charts, pareto chart. This is a completely editable PowerPoint presentation and is available for immediate download. Download now and impress your audience.
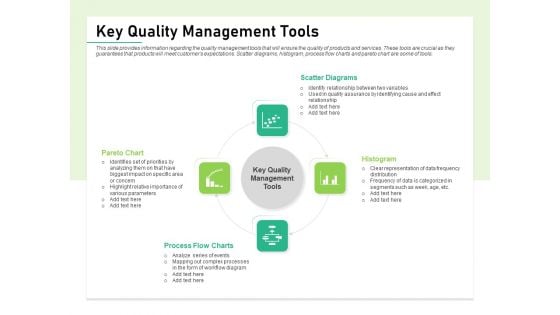
Quality Management Plan QMP Key Quality Management Tools Summary PDF
Presenting this set of slides with name quality management plan qmp key quality management tools summary pdf. This is a four stage process. The stages in this process are scatter diagrams, histogram, process flow charts, pareto chart. This is a completely editable PowerPoint presentation and is available for immediate download. Download now and impress your audience.
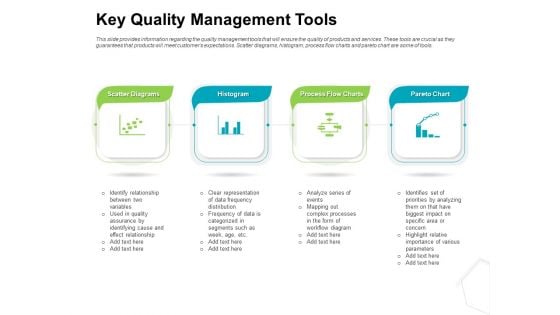
Project Quality Management Plan Key Quality Management Tools Slides PDF
Presenting this set of slides with name project quality management plan key quality management tools slides pdf. This is a four stage process. The stages in this process are scatter diagrams, histogram, process flow charts, pareto chart. This is a completely editable PowerPoint presentation and is available for immediate download. Download now and impress your audience.
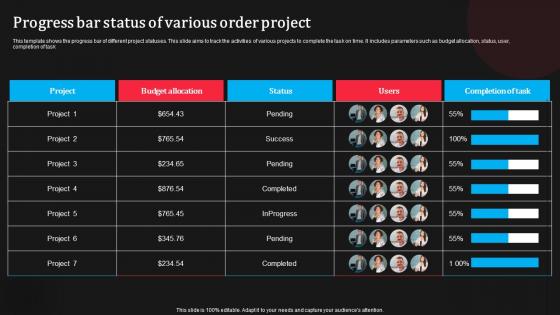
Progress Bar Status Of Various Order Project Inspiration Pdf
This template shows the progress bar of different project statuses. This slide aims to track the activities of various projects to complete the task on time. It includes parameters such as budget allocation, status, user,completion of task.Showcasing this set of slides titled Progress Bar Status Of Various Order Project Inspiration Pdf The topics addressed in these templates are Progress Bar Status, Various Order Project All the content presented in this PPT design is completely editable. Download it and make adjustments in color, background, font etc. as per your unique business setting. This template shows the progress bar of different project statuses. This slide aims to track the activities of various projects to complete the task on time. It includes parameters such as budget allocation, status, user,completion of task.
Graphical Representation Of Research IT Information Visualization Research Branch Icons PDF
This slide explains information visualization as a branch of visualization research that includes visuals like histograms, trend graphs, flow charts. Presenting graphical representation of research it information visualization research branch icons pdf to provide visual cues and insights. Share and navigate important information on four stages that need your due attention. This template can be used to pitch topics like geographic, information, design. In addtion, this PPT design contains high resolution images, graphics, etc, that are easily editable and available for immediate download.
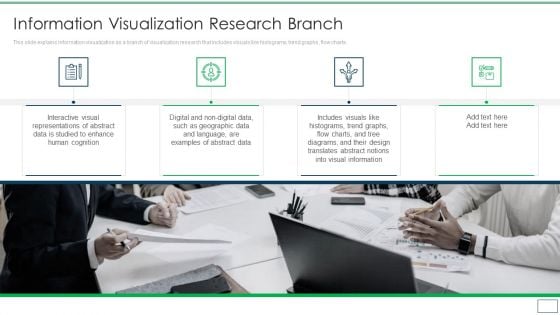
Departments Of Visualization Research Information Visualization Research Branch Clipart PDF
This slide explains information visualization as a branch of visualization research that includes visuals like histograms, trend graphs, flow charts.Presenting Departments Of Visualization Research Information Visualization Research Branch Clipart PDF to provide visual cues and insights. Share and navigate important information on four stages that need your due attention. This template can be used to pitch topics like Interactive Visual, Representations Of Abstract, Information In addtion, this PPT design contains high resolution images, graphics, etc, that are easily editable and available for immediate download.
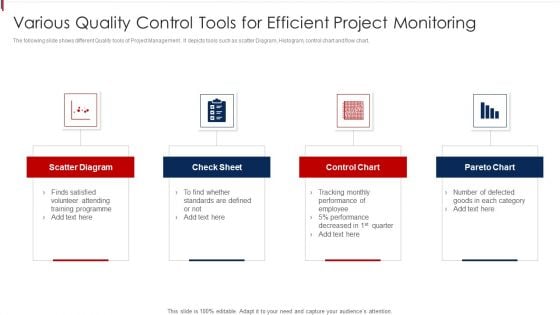
Various Quality Control Tools For Efficient Project Monitoring Demonstration PDF
The following slide shows different Quality tools of Project Management . It depicts tools such as scatter Diagram, Histogram, control chart and flow chart. Persuade your audience using this Various Quality Control Tools For Efficient Project Monitoring Demonstration PDF. This PPT design covers four stages, thus making it a great tool to use. It also caters to a variety of topics including Scatter Diagram, Check Sheet, Control Chart. Download this PPT design now to present a convincing pitch that not only emphasizes the topic but also showcases your presentation skills.
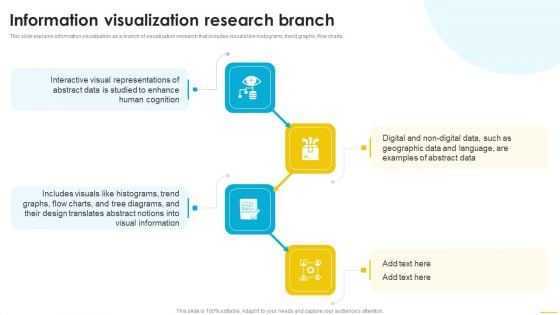
Information Visualization Research Branch Template PDF
This slide explains information visualization as a branch of visualization research that includes visuals like histograms, trend graphs, flow charts. Slidegeeks is here to make your presentations a breeze with Information Visualization Research Branch Template PDF With our easy to use and customizable templates, you can focus on delivering your ideas rather than worrying about formatting. With a variety of designs to choose from, you are sure to find one that suits your needs. And with animations and unique photos, illustrations, and fonts, you can make your presentation pop. So whether you are giving a sales pitch or presenting to the board, make sure to check out Slidegeeks first.
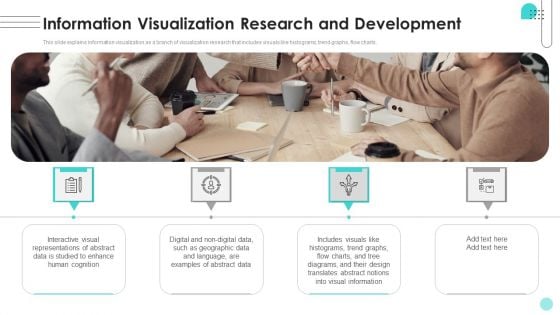
Information Visualization Research And Development Ppt Infographics Gallery PDF
This slide explains information visualization as a branch of visualization research that includes visuals like histograms, trend graphs, flow charts. Here you can discover an assortment of the finest PowerPoint and Google Slides templates. With these templates, you can create presentations for a variety of purposes while simultaneously providing your audience with an eye-catching visual experience. Download Information Visualization Research And Development Ppt Infographics Gallery PDF to deliver an impeccable presentation. These templates will make your job of preparing presentations much quicker, yet still, maintain a high level of quality. Slidegeeks has experienced researchers who prepare these templates and write high-quality content for you. Later on, you can personalize the content by editing the Information Visualization Research And Development Ppt Infographics Gallery PDF.

 Home
Home