Histogram
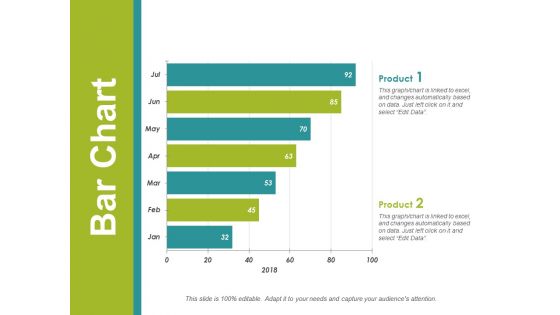
Bar Chart Ppt PowerPoint Presentation Gallery Demonstration
This is a bar chart ppt powerpoint presentation gallery demonstration. This is a two stage process. The stages in this process are business, bar chart, years, marketing, finance.
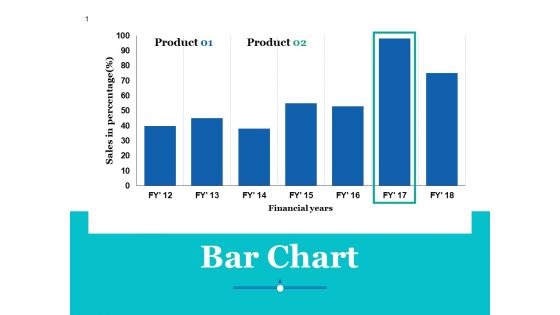
Bar Chart Ppt PowerPoint Presentation Professional Sample
This is a bar chart ppt powerpoint presentation professional sample. This is a two stage process. The stages in this process are bar chart, finance, business, marketing, planning.
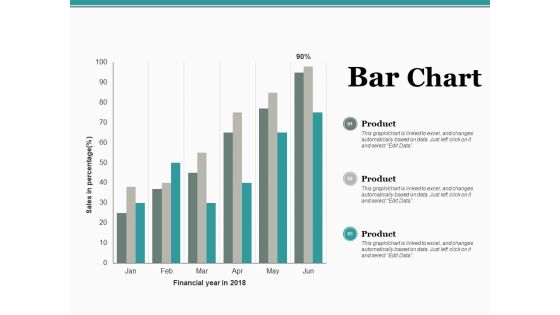
Bar Chart Ppt PowerPoint Presentation Inspiration Outfit
This is a bar chart ppt powerpoint presentation inspiration outfit. This is a three stage process. The stages in this process are percentage, product, bar chart, marketing.
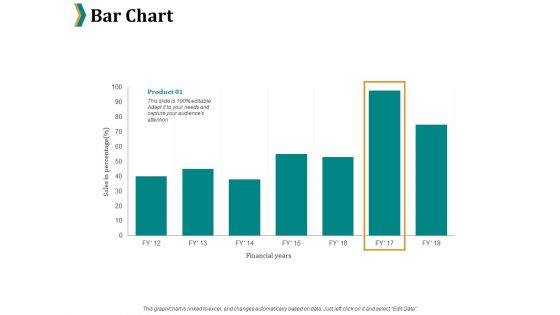
Bar Chart Ppt PowerPoint Presentation Portfolio Slides
This is a bar chart ppt powerpoint presentation portfolio slides. This is a one stage process. The stages in this process are product, percentage, marketing, business, bar chart.
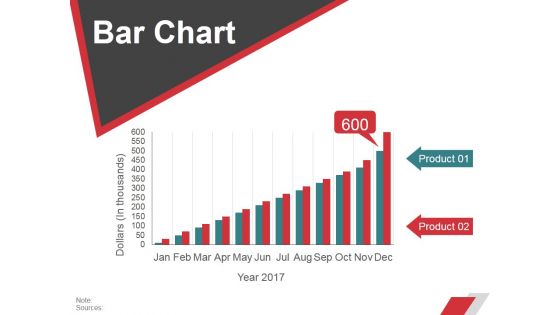
Bar Chart Ppt PowerPoint Presentation Layouts Visuals
This is a bar chart ppt powerpoint presentation layouts visuals. This is a two stage process. The stages in this process are business, strategy, marketing, planning, chart and graph.
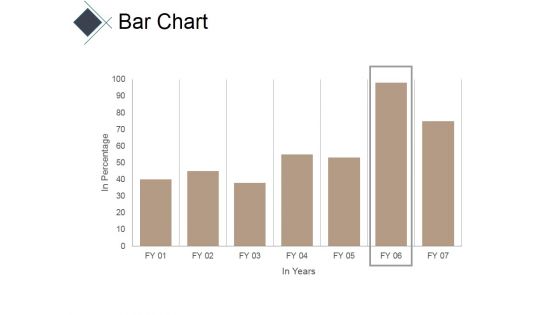
Bar Chart Ppt PowerPoint Presentation Model Good
This is a bar chart ppt powerpoint presentation model good. This is a seven stage process. The stages in this process are business, marketing, bar, success, finance.
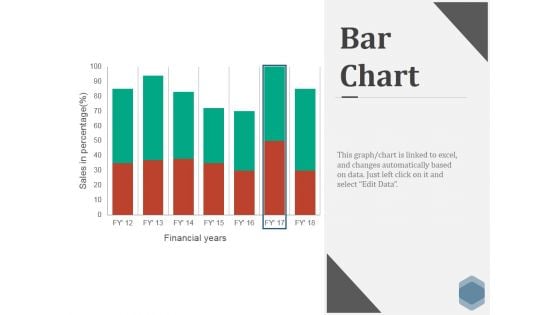
Bar Chart Ppt PowerPoint Presentation Infographics Skills
This is a bar chart ppt powerpoint presentation infographics skills. This is a seven stage process. The stages in this process are business, marketing, strategy, finance, bar.
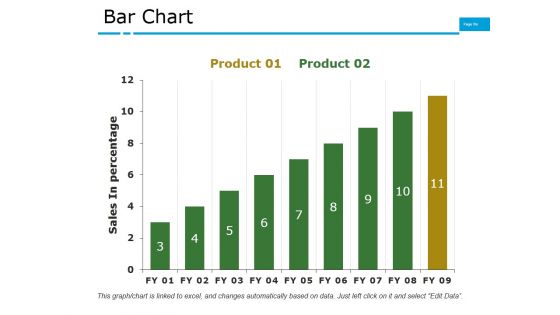
Bar Chart Ppt PowerPoint Presentation Model Influencers
This is a bar chart ppt powerpoint presentation model influencers. This is a two stage process. The stages in this process are business, marketing, finance, bar, growth.
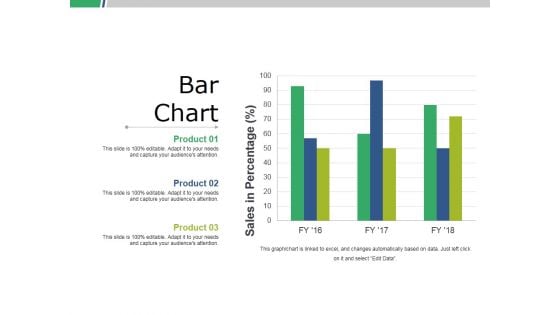
Bar Chart Ppt PowerPoint Presentation Show Slides
This is a bar chart ppt powerpoint presentation show slides. This is a three stage process. The stages in this process are business, marketing, strategy, bar, finance.
Bar Chart Ppt PowerPoint Presentation Icon Demonstration
This is a bar chart ppt powerpoint presentation icon demonstration. This is a seven stage process. The stages in this process are product, sales in percentage, financial year, graph.
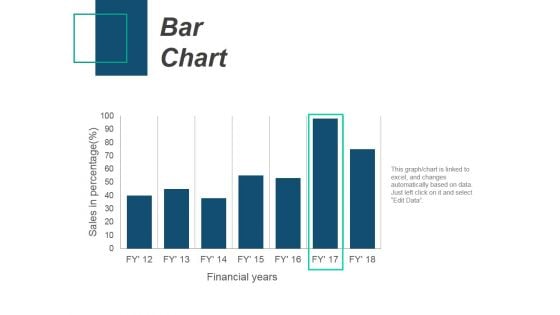
Bar Chart Ppt PowerPoint Presentation Professional Files
This is a bar chart ppt powerpoint presentation professional files. This is a seven stage process. The stages in this process are bar chart, product, sales in percentage, financial years.
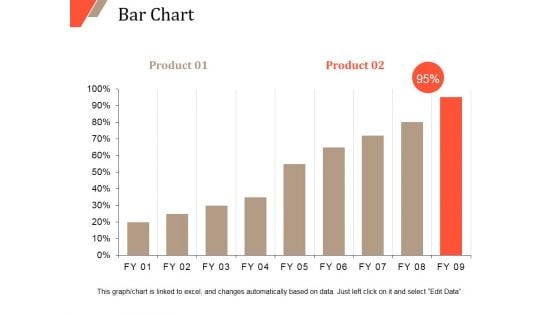
Bar Chart Ppt PowerPoint Presentation Outline Infographics
This is a bar chart ppt powerpoint presentation outline infographics. This is a two stage process. The stages in this process are bar chart, finance, marketing, strategy, analysis, business.
Bar Chart Ppt PowerPoint Presentation Icon Layout
This is a bar chart ppt powerpoint presentation icon layout. This is a one stage process. The stages in this process are sales in percentage, financial years, bar chart, finance, marketing.
Bar Chart Ppt PowerPoint Presentation Icon Inspiration
This is a bar chart ppt powerpoint presentation icon inspiration. This is a three stage process. The stages in this process are bar chart, finance, marketing, strategy, analysis, business.
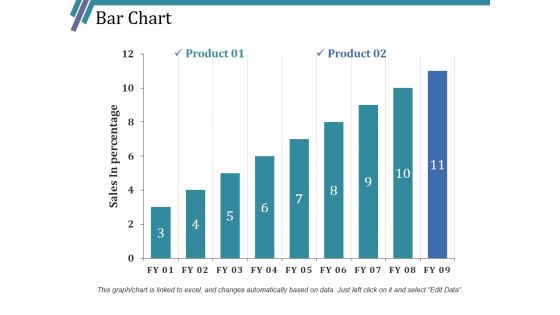
Bar Chart Ppt PowerPoint Presentation Styles Smartart
This is a bar chart ppt powerpoint presentation styles smartart. This is a two stage process. The stages in this process are bar chart, growth, finance, marketing, strategy, analysis.
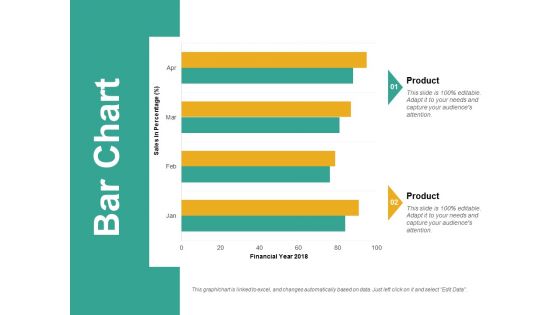
Bar Chart Ppt PowerPoint Presentation Slides Model
This is a bar chart ppt powerpoint presentation slides model. This is a two stage process. The stages in this process are bar chart, analysis, business, marketing, strategy, finance.
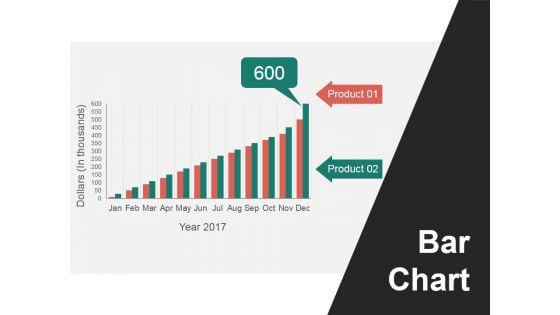
Bar Chart Ppt PowerPoint Presentation Pictures Mockup
This is a bar chart ppt powerpoint presentation pictures mockup. This is a twelve stage process. The stages in this process are dollars, product, bar chart.
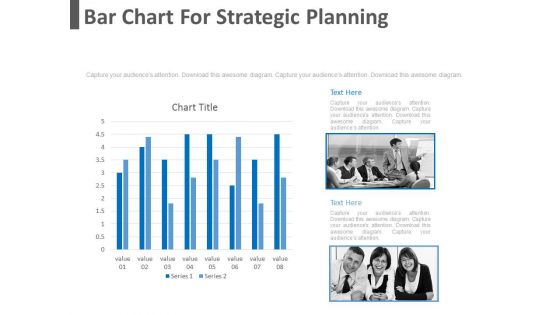
Bar Chart For Strategic Planning Powerpoint Slides
This PowerPoint template has been designed with bar graph with two teams. This diagram is useful to exhibit strategic planning. This diagram slide can be used to make impressive presentations.
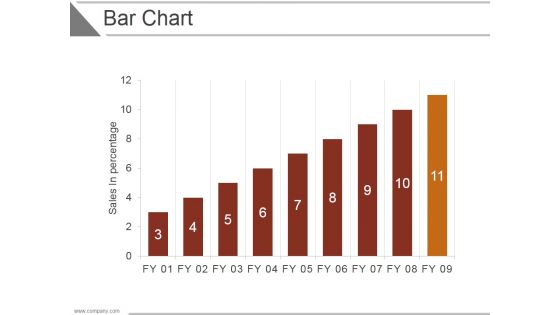
Bar Chart Ppt PowerPoint Presentation Inspiration
This is a bar chart ppt powerpoint presentation inspiration. This is a nine stage process. The stages in this process are business, strategy, analysis, marketing, growth strategy.
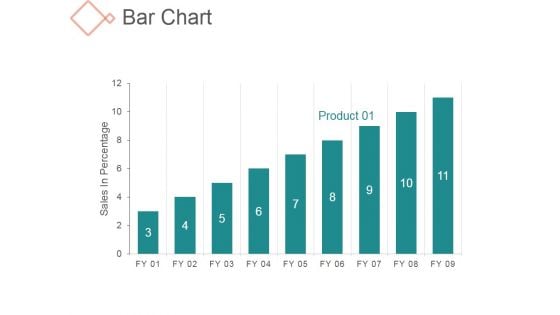
Bar Chart Ppt PowerPoint Presentation Styles
This is a bar chart ppt powerpoint presentation styles. This is a nine stage process. The stages in this process are business, management, sales in percentage, growth.
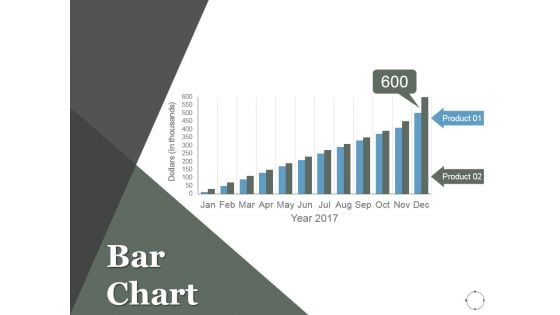
Bar Chart Ppt PowerPoint Presentation Model
This is a bar chart ppt powerpoint presentation model. This is a two stage process. The stages in this process are business, marketing, product, planning, management.
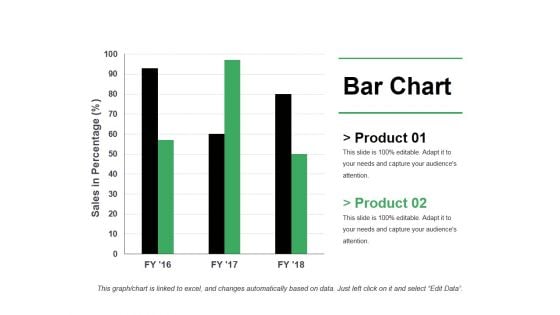
Bar Chart Ppt PowerPoint Presentation Model Professional
This is a bar chart ppt powerpoint presentation model professional. This is a three stage process. The stages in this process are business, marketing, strategy, finance, growth.
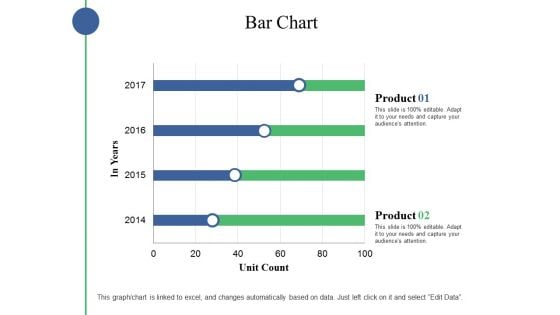
Bar Chart Ppt PowerPoint Presentation File Templates
This is a bar chart ppt powerpoint presentation file templates. This is a four stage process. The stages in this process are business, marketing, strategy, finance, planning.
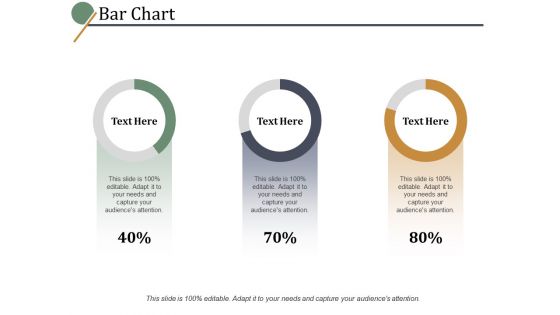
Bar Chart Ppt PowerPoint Presentation Professional Examples
This is a bar chart ppt powerpoint presentation professional examples. This is a four stage process. The stages in this process are percentage, marketing, management, product.
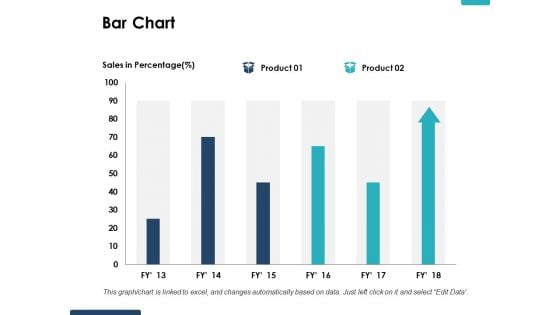
Bar Chart Ppt PowerPoint Presentation Show Deck
This is a bar chart ppt powerpoint presentation show deck. This is a two stage process. The stages in this process are percentage, product, business, marketing.
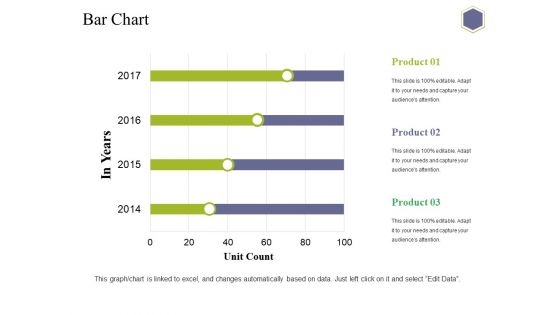
Bar Chart Ppt PowerPoint Presentation Slide Download
This is a bar chart ppt powerpoint presentation slide download. This is a three stage process. The stages in this process are chart, in years, unit count, business, marketing.
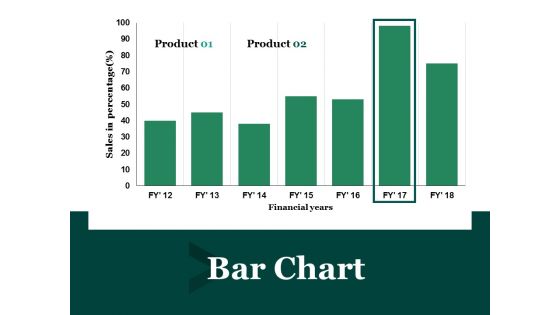
Bar Chart Ppt PowerPoint Presentation Layouts Template
This is a bar chart ppt powerpoint presentation layouts template. This is a two stage process. The stages in this process are financial year, sales in percentage, business, marketing, finance.
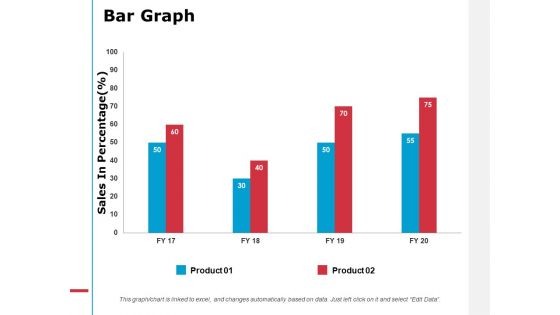
Bar Graph Analysis Ppt PowerPoint Presentation Summary Graphics Design
Presenting this set of slides with name bar graph analysis ppt powerpoint presentation summary graphics design. The topics discussed in these slides are bar graph. This is a completely editable PowerPoint presentation and is available for immediate download. Download now and impress your audience.
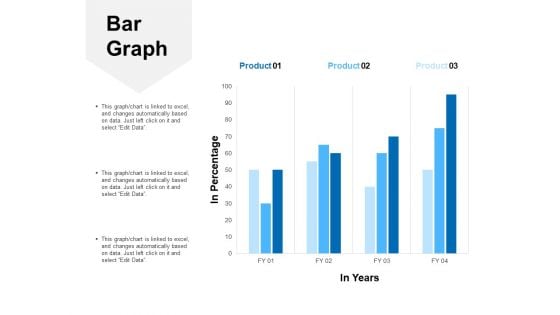
Bar Graph Analysis Ppt PowerPoint Presentation Show Template
Presenting this set of slides with name bar graph analysis ppt powerpoint presentation show template. The topics discussed in these slides are bar graph, product 01 to product 03. This is a completely editable PowerPoint presentation and is available for immediate download. Download now and impress your audience.
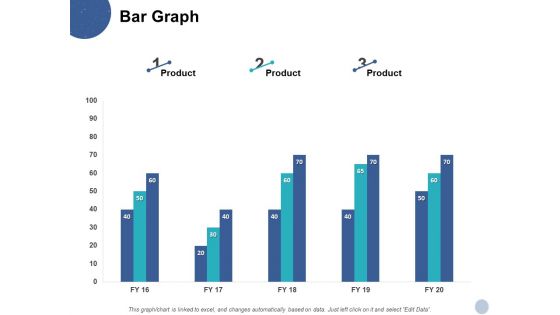
Bar Graph Investment Ppt PowerPoint Presentation Slides Ideas
Presenting this set of slides with name bar graph investment ppt powerpoint presentation slides ideas. The topics discussed in these slide is bar graph. This is a completely editable PowerPoint presentation and is available for immediate download. Download now and impress your audience.
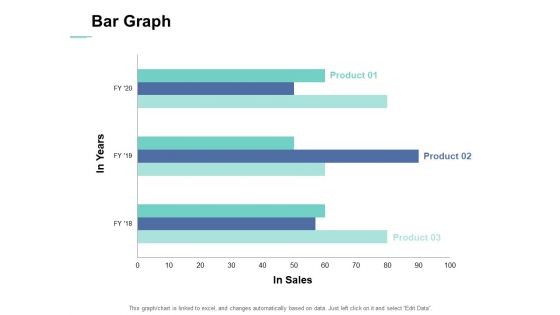
Bar Graph Ppt PowerPoint Presentation Ideas Graphic Images
Presenting this set of slides with name bar graph ppt powerpoint presentation ideas graphic images. The topics discussed in these slides are bar graph, sales. This is a completely editable PowerPoint presentation and is available for immediate download. Download now and impress your audience.
Assessment Of Fixed Assets Bar Graph Ppt Icon Aids PDF
Presenting this set of slides with name assessment of fixed assets bar graph ppt icon aids pdf. The topics discussed in these slide is bar graph. This is a completely editable PowerPoint presentation and is available for immediate download. Download now and impress your audience.
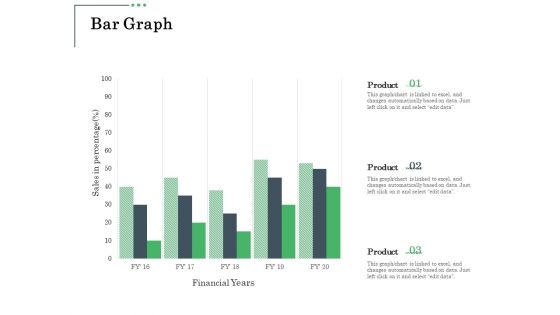
Non Current Assets Reassessment Bar Graph Ppt Gallery Guidelines PDF
Presenting this set of slides with name non current assets reassessment bar graph ppt gallery guidelines pdf. The topics discussed in these slide is bar graph. This is a completely editable PowerPoint presentation and is available for immediate download. Download now and impress your audience.
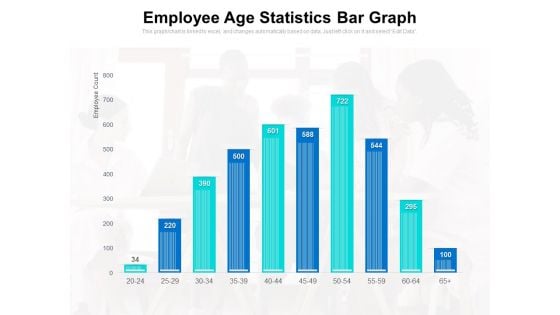
Employee Age Statistics Bar Graph Ppt PowerPoint Presentation Deck PDF
Presenting this set of slides with name employee age statistics bar graph ppt powerpoint presentation deck pdf. The topics discussed in these slide is employee age statistics bar graph. This is a completely editable PowerPoint presentation and is available for immediate download. Download now and impress your audience.
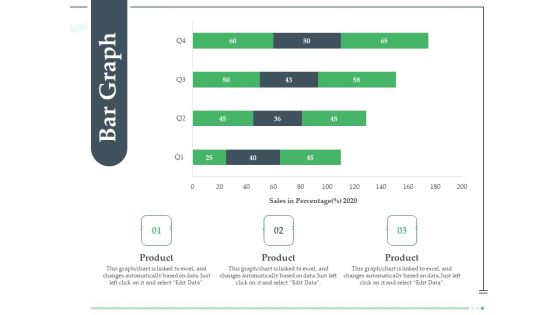
Funds Requisite Evaluation Bar Graph Ppt Styles Ideas PDF
Presenting this set of slides with name funds requisite evaluation bar graph ppt styles ideas pdf. The topics discussed in these slide is bar graph. This is a completely editable PowerPoint presentation and is available for immediate download. Download now and impress your audience.
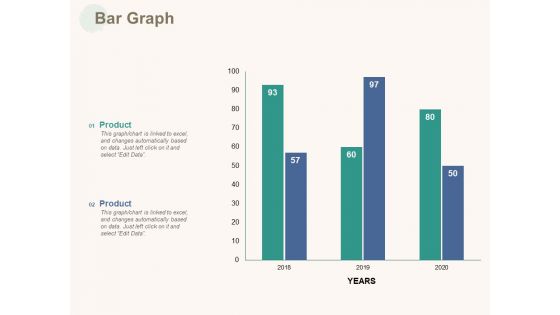
Marketing Pipeline Vs Cog Bar Graph Ppt Inspiration Rules PDF
Presenting this set of slides with name marketing pipeline vs cog bar graph ppt inspiration rules pdf. The topics discussed in these slide is bar graph. This is a completely editable PowerPoint presentation and is available for immediate download. Download now and impress your audience.
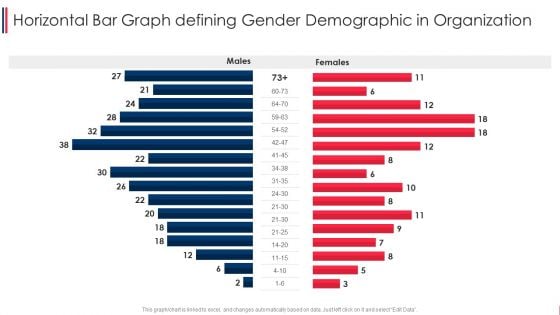
Horizontal Bar Graph Defining Gender Demographic In Organization Ideas PDF
Showcasing this set of slides titled horizontal bar graph defining gender demographic in organization ideas pdf. The topics addressed in these templates are horizontal bar graph defining gender demographic in organization. All the content presented in this PPT design is completely editable. Download it and make adjustments in color, background, font etc. as per your unique business setting.
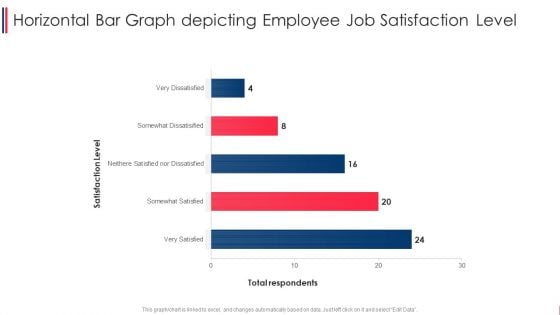
Horizontal Bar Graph Depicting Employee Job Satisfaction Level Summary PDF
Pitch your topic with ease and precision using this horizontal bar graph depicting employee job satisfaction level summary pdf. This layout presents information on horizontal bar graph depicting employee job satisfaction level. It is also available for immediate download and adjustment. So, changes can be made in the color, design, graphics or any other component to create a unique layout.
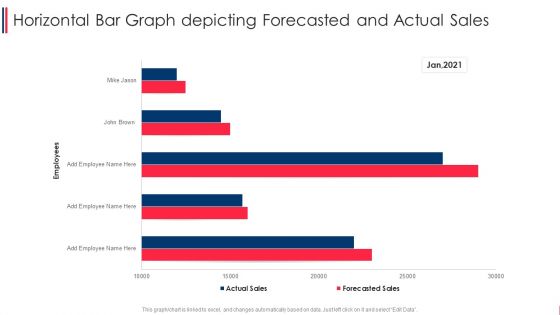
Horizontal Bar Graph Depicting Forecasted And Actual Sales Microsoft PDF
Showcasing this set of slides titled horizontal bar graph depicting forecasted and actual sales microsoft pdf. The topics addressed in these templates are horizontal bar graph depicting forecasted and actual sales. All the content presented in this PPT design is completely editable. Download it and make adjustments in color, background, font etc. as per your unique business setting.
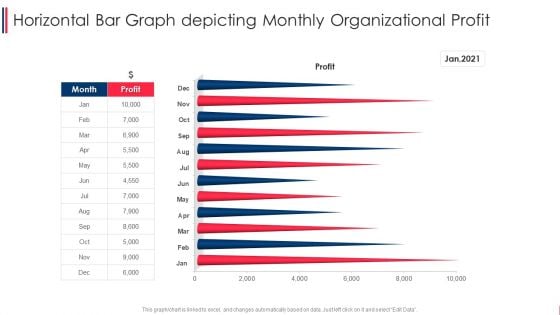
Horizontal Bar Graph Depicting Monthly Organizational Profit Graphics PDF
Pitch your topic with ease and precision using this horizontal bar graph depicting monthly organizational profit graphics pdf. This layout presents information on horizontal bar graph depicting monthly organizational profit. It is also available for immediate download and adjustment. So, changes can be made in the color, design, graphics or any other component to create a unique layout.
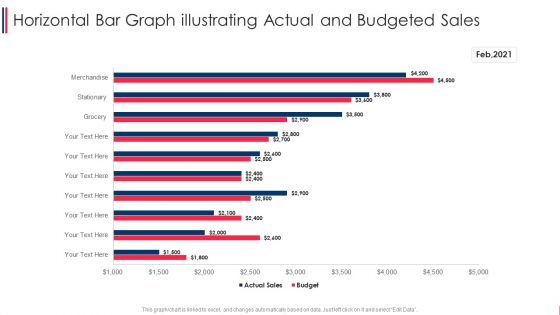
Horizontal Bar Graph Illustrating Actual And Budgeted Sales Background PDF
Showcasing this set of slides titled horizontal bar graph illustrating actual and budgeted sales background pdf. The topics addressed in these templates are horizontal bar graph illustrating actual and budgeted sales. All the content presented in this PPT design is completely editable. Download it and make adjustments in color, background, font etc. as per your unique business setting.
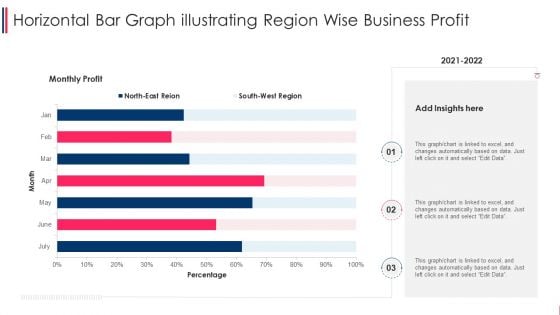
Horizontal Bar Graph Illustrating Region Wise Business Profit Microsoft PDF
Pitch your topic with ease and precision using this horizontal bar graph illustrating region wise business profit microsoft pdf. This layout presents information on horizontal bar graph illustrating region wise business profit. It is also available for immediate download and adjustment. So, changes can be made in the color, design, graphics or any other component to create a unique layout.
Horizontal Bar Graph Illustrating Yearly Products Sale Icons PDF
Showcasing this set of slides titled horizontal bar graph illustrating yearly products sale icons pdf. The topics addressed in these templates are horizontal bar graph illustrating yearly products sale icons. All the content presented in this PPT design is completely editable. Download it and make adjustments in color, background, font etc. as per your unique business setting.
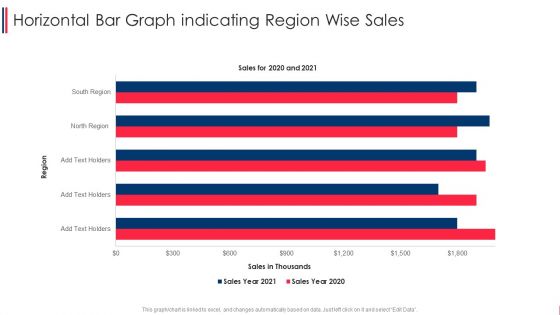
Horizontal Bar Graph Indicating Region Wise Sales Formats PDF
Pitch your topic with ease and precision using this horizontal bar graph indicating region wise sales formats pdf. This layout presents information on horizontal bar graph indicating region wise sales. It is also available for immediate download and adjustment. So, changes can be made in the color, design, graphics or any other component to create a unique layout.
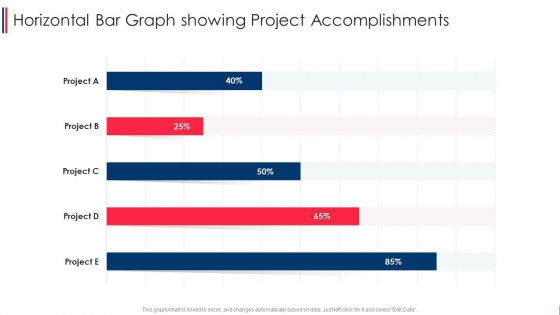
Horizontal Bar Graph Showing Project Accomplishments Structure PDF
Showcasing this set of slides titled horizontal bar graph showing project accomplishments structure pdf. The topics addressed in these templates are horizontal bar graph showing project accomplishments. All the content presented in this PPT design is completely editable. Download it and make adjustments in color, background, font etc. as per your unique business setting.
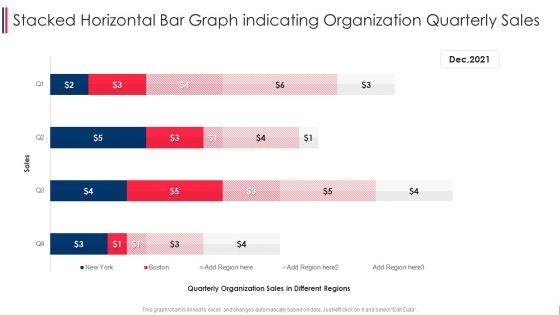
Stacked Horizontal Bar Graph Indicating Organization Quarterly Sales Graphics PDF
Pitch your topic with ease and precision using this stacked horizontal bar graph indicating organization quarterly sales graphics pdf. This layout presents information on stacked horizontal bar graph indicating organization quarterly sales. It is also available for immediate download and adjustment. So, changes can be made in the color, design, graphics or any other component to create a unique layout.
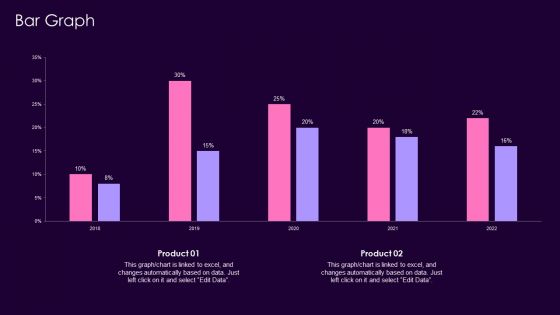
Product Management Techniques Bar Graph Ppt Portfolio Guide PDF
Deliver an awe inspiring pitch with this creative Product Management Techniques Bar Graph Ppt Portfolio Guide PDF bundle. Topics like Bar Graph can be discussed with this completely editable template. It is available for immediate download depending on the needs and requirements of the user.
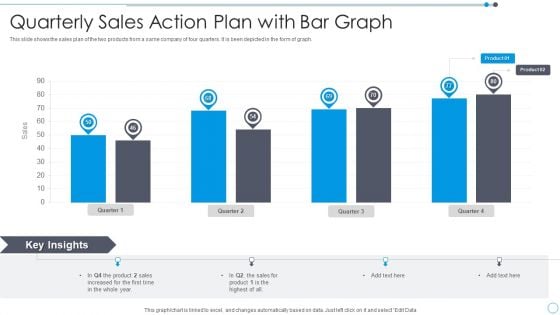
Quarterly Sales Action Plan With Bar Graph Graphics PDF
This slide shows the sales plan of the two products from a same company of four quarters. It is been depicted in the form of graph.Showcasing this set of slides titled Quarterly Sales Action Plan With Bar Graph Graphics PDF. The topics addressed in these templates are Quarterly Sales Action Plan With Bar Graph. All the content presented in this PPT design is completely editable. Download it and make adjustments in color, background, font etc. as per your unique business setting.
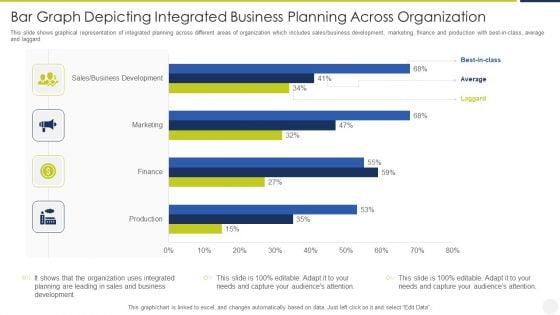
Bar Graph Depicting Integrated Business Planning Across Organization Designs PDF
This slide shows graphical representation of integrated planning across different areas of organization which includes sales or business development, marketing, finance and production with best in class, average and laggard Showcasing this set of slides titled bar graph depicting integrated business planning across organization designs pdf. The topics addressed in these templates are bar graph depicting integrated business planning across organization. All the content presented in this PPT design is completely editable. Download it and make adjustments in color, background, font etc. as per your unique business setting.
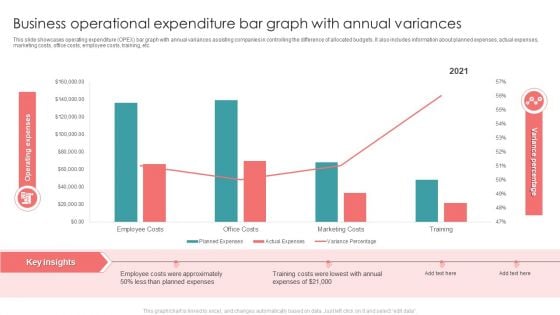
Business Operational Expenditure Bar Graph With Annual Variances Brochure PDF
This slide showcases operating expenditure OPEX bar graph with annual variances assisting companies in controlling the difference of allocated budgets. It also includes information about planned expenses, actual expenses, marketing costs, office costs, employee costs, training, etc. Showcasing this set of slides titled Business Operational Expenditure Bar Graph With Annual Variances Brochure PDF. The topics addressed in these templates are Employee Costs, Planned Expenses, Training Costs. All the content presented in this PPT design is completely editable. Download it and make adjustments in color, background, font etc. as per your unique business setting.
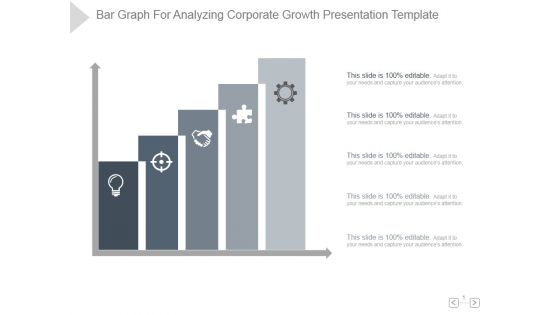
Bar Graph For Analyzing Corporate Growth Ppt PowerPoint Presentation Ideas
This is a bar graph for analyzing corporate growth ppt powerpoint presentation ideas. This is a five stage process. The stages in this process are bar graph, analyzing, corporate, growth, presentation, strategy.
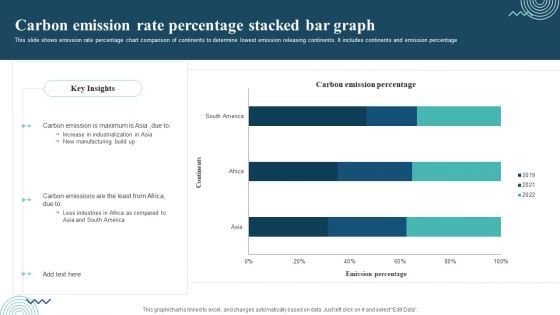
Carbon Emission Rate Percentage Stacked Bar Graph Rules PDF
This slide shows emission rate percentage chart comparison of continents to determine lowest emission releasing continents. It includes continents and emission percentage Showcasing this set of slides titled Carbon Emission Rate Percentage Stacked Bar Graph Rules PDF. The topics addressed in these templates are Carbon Emission, Increase In Industrialization, New Manufacturing. All the content presented in this PPT design is completely editable. Download it and make adjustments in color, background, font etc. as per your unique business setting.

Carbon Emissions Of Countries Bar Graph Professional PDF
This slide depicts emissions chart of various countries to avoid the worst impacts of climate change. It includes countries and carbon emissions in million metric tons. Pitch your topic with ease and precision using this Carbon Emissions Of Countries Bar Graph Professional PDF. This layout presents information on Maximum Production, Consumer Goods, Carbon Emissions. It is also available for immediate download and adjustment. So, changes can be made in the color, design, graphics or any other component to create a unique layout.
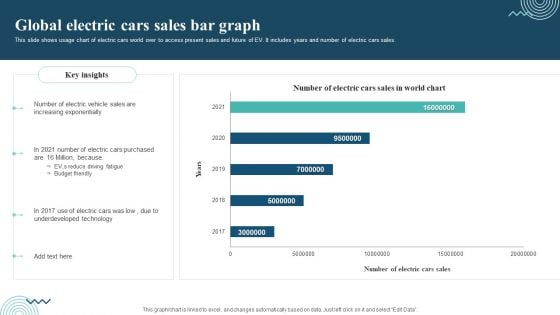
Global Electric Cars Sales Bar Graph Graphics PDF
This slide shows usage chart of electric cars world over to access present sales and future of EV. It includes years and number of electric cars sales. Showcasing this set of slides titled Global Electric Cars Sales Bar Graph Graphics PDF. The topics addressed in these templates are Electric Vehicle Sales, Electric Cars Purchased, Underdeveloped Technology. All the content presented in this PPT design is completely editable. Download it and make adjustments in color, background, font etc. as per your unique business setting.
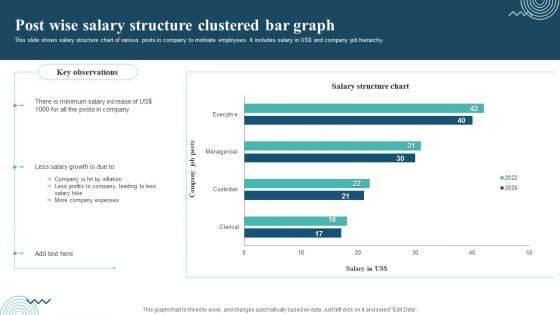
Post Wise Salary Structure Clustered Bar Graph Professional PDF
This slide shows salary structure chart of various posts in company to motivate employees. It includes salary in US dollar and company job hierarchy. Showcasing this set of slides titled Post Wise Salary Structure Clustered Bar Graph Professional PDF. The topics addressed in these templates are Minimum Salary Increase, Less Salary Growth, Company Expenses. All the content presented in this PPT design is completely editable. Download it and make adjustments in color, background, font etc. as per your unique business setting.
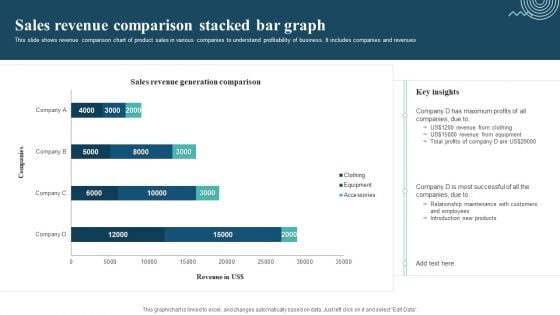
Sales Revenue Comparison Stacked Bar Graph Mockup PDF
This slide shows revenue comparison chart of product sales in various companies to understand profitability of business. It includes companies and revenues. Showcasing this set of slides titled Sales Revenue Comparison Stacked Bar Graph Mockup PDF. The topics addressed in these templates are Sales Revenue Comparison, Revenue From Clothing, Revenue From Equipment. All the content presented in this PPT design is completely editable. Download it and make adjustments in color, background, font etc. as per your unique business setting.
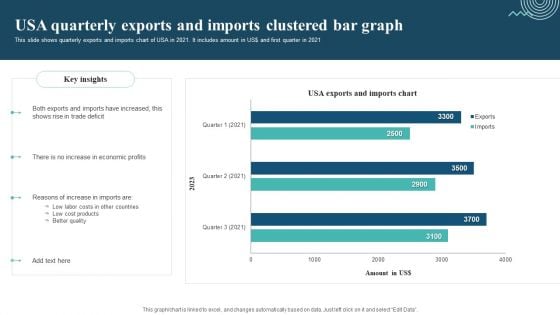
Usa Quarterly Exports And Imports Clustered Bar Graph Designs PDF
This slide shows quarterly exports and imports chart of USA in 2021. It includes amount in US dollar and first quarter in 2021. Pitch your topic with ease and precision using this Usa Quarterly Exports And Imports Clustered Bar Graph Designs PDF. This layout presents information on Exports And Imports, Trade Deficit, Economic Profits. It is also available for immediate download and adjustment. So, changes can be made in the color, design, graphics or any other component to create a unique layout.
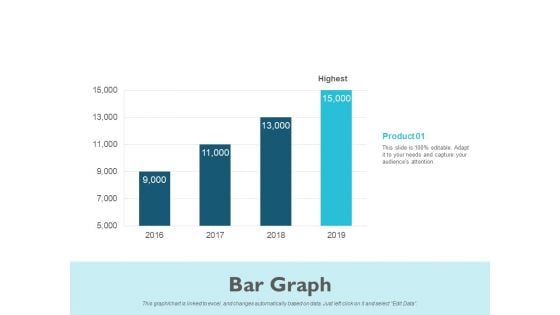
Bar Graph Process Ppt PowerPoint Presentation Portfolio Designs Download
Presenting this set of slides with name bar graph process ppt powerpoint presentation portfolio designs download. The topics discussed in these slides are finance, marketing, management, investment, analysis. This is a completely editable PowerPoint presentation and is available for immediate download. Download now and impress your audience.
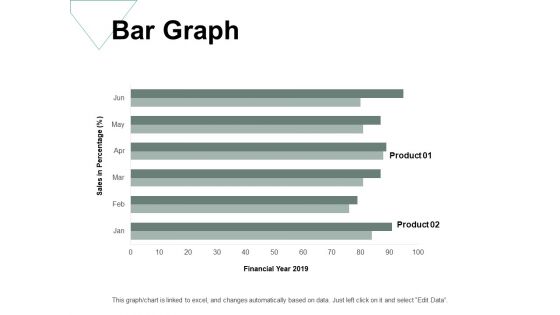
Bar Graph Investment Ppt PowerPoint Presentation Infographics Graphics Template
Presenting this set of slides with name bar graph investment ppt powerpoint presentation infographics graphics template. The topics discussed in these slides are finance, marketing, management, investment, analysis. This is a completely editable PowerPoint presentation and is available for immediate download. Download now and impress your audience.
Bar Graph Product Ppt PowerPoint Presentation Icon Layout
Presenting this set of slides with name bar graph product ppt powerpoint presentation icon layout. The topics discussed in these slides are finance, marketing, management, investment, analysis. This is a completely editable PowerPoint presentation and is available for immediate download. Download now and impress your audience.

 Home
Home