Infographic Report
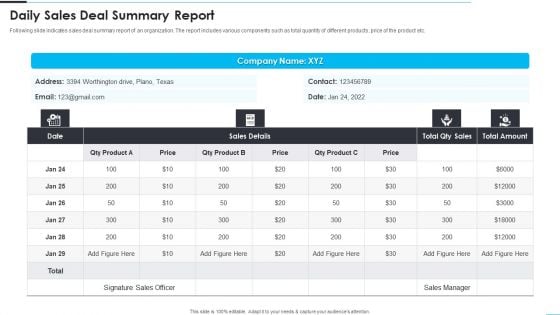
Daily Sales Deal Summary Report Infographics PDF
Following slide indicates sales deal summary report of an organization. The report includes various components such as total quantity of different products, price of the product etc. Showcasing this set of slides titled Daily Sales Deal Summary Report Infographics PDF. The topics addressed in these templates are Price, Sales Details, Sales Manager. All the content presented in this PPT design is completely editable. Download it and make adjustments in color, background, font etc. as per your unique business setting.
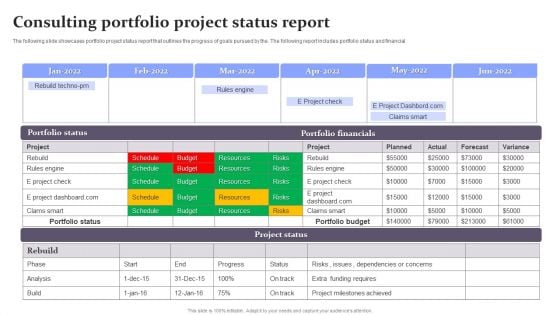
Consulting Portfolio Project Status Report Infographics PDF
The following slide showcases portfolio project status report that outlines the progress of goals pursued by the. The following report includes portfolio status and financial Showcasing this set of slides titled Consulting Portfolio Project Status Report Infographics PDF. The topics addressed in these templates are Project, Budget, Resources. All the content presented in this PPT design is completely editable. Download it and make adjustments in color, background, font etc. as per your unique business setting.
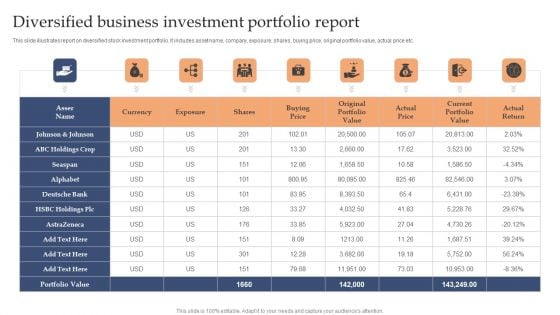
Diversified Business Investment Portfolio Report Infographics PDF
This slide illustrates report on diversified stock investment portfolio. It includes asset name, company, exposure, shares, buying price, original portfolio value, actual price etc.Pitch your topic with ease and precision using this Diversified Business Investment Portfolio Report Infographics PDF. This layout presents information on Commute Speed, Speed limited, Vehicle Segment. It is also available for immediate download and adjustment. So, changes can be made in the color, design, graphics or any other component to create a unique layout.
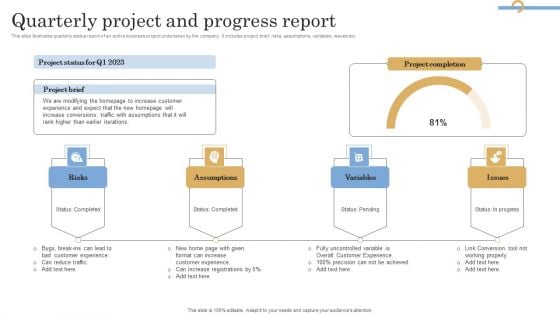
Quarterly Project And Progress Report Infographics PDF
This slide illustrates quarterly status report of an active business project undertaken by the company. it includes project brief, risks, assumptions, variables, issues etc. Showcasing this set of slides titled Quarterly Project And Progress Report Infographics PDF. The topics addressed in these templates are Risks, Assumptions, Variables. All the content presented in this PPT design is completely editable. Download it and make adjustments in color, background, font etc. as per your unique business setting.
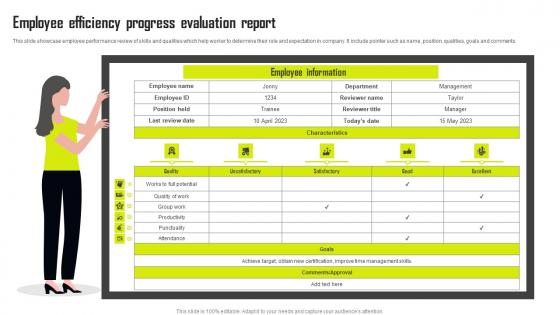
Employee Efficiency Progress Evaluation Report Infographics Pdf
This slide showcase employee performance review of skills and qualities which help worker to determine their role and expectation in company. It include pointer such as name, position, qualities, goals and comments. Pitch your topic with ease and precision using this Employee Efficiency Progress Evaluation Report Infographics Pdf This layout presents information on Employee Information, Goals, Comments Approval It is also available for immediate download and adjustment. So, changes can be made in the color, design, graphics or any other component to create a unique layout. This slide showcase employee performance review of skills and qualities which help worker to determine their role and expectation in company. It include pointer such as name, position, qualities, goals and comments.
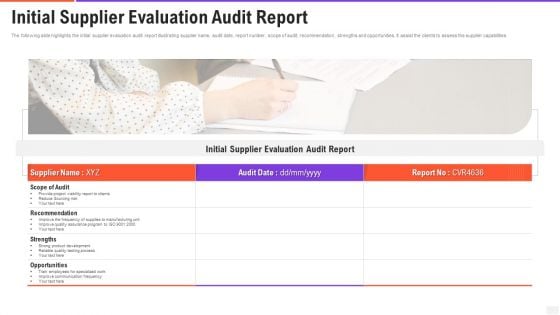
Initial Supplier Evaluation Audit Report Infographics PDF
The following slide highlights the initial supplier evaluation audit report illustrating supplier name, audit date, report number, scope of audit, recommendation, strengths and opportunities. It assist the clients to assess the supplier capabilities. Presenting initial supplier evaluation audit report infographics pdf to dispense important information. This template comprises one stages. It also presents valuable insights into the topics including scope of audit, recommendation, opportunities. This is a completely customizable PowerPoint theme that can be put to use immediately. So, download it and address the topic impactfully.
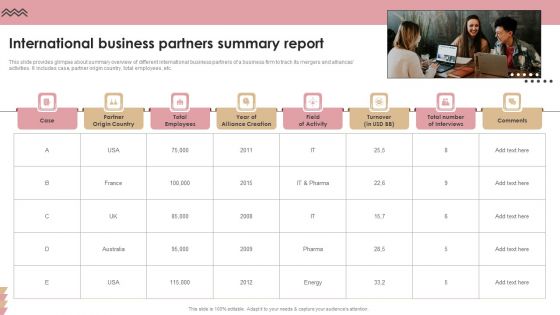
International Business Partners Summary Report Infographics PDF
This slide provides glimpse about summary overview of different international business partners of a business firm to track its mergers and alliances activities. It includes case, partner origin country, total employees, etc. Presenting International Business Partners Summary Report Infographics PDF to dispense important information. This template comprises eight stages. It also presents valuable insights into the topics including Partner Origin Country, Year Of Alliance Creation, Field Of Activity. This is a completely customizable PowerPoint theme that can be put to use immediately. So, download it and address the topic impactfully.
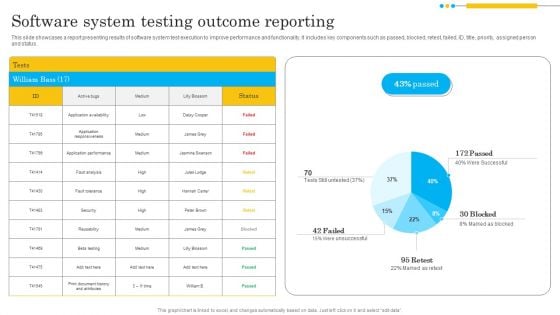
Software System Testing Outcome Reporting Infographics PDF
This slide showcases a report presenting results of software system test execution to improve performance and functionality. It includes key components such as passed, blocked, retest, failed, ID, title, priority, assigned person and status. Showcasing this set of slides titled Software System Testing Outcome Reporting Infographics PDF. The topics addressed in these templates are Application Responsiveness, Application Performance, Security. All the content presented in this PPT design is completely editable. Download it and make adjustments in color, background, font etc. as per your unique business setting.
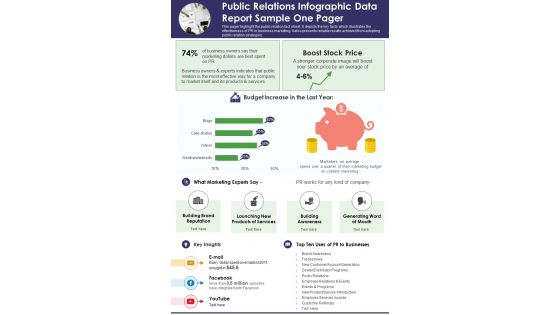
Public Relations Infographic Data Report Sample One Pager PDF Document PPT Template
Presenting you an exemplary Public Relations Infographic Data Report Sample One Pager PDF Document PPT Template. Our one-pager template comprises all the must-have essentials of an inclusive document. You can edit it with ease, as its layout is completely editable. With such freedom, you can tweak its design and other elements to your requirements. Download this Public Relations Infographic Data Report Sample One Pager PDF Document PPT Template Download now.
Project Summary Report Management Infographic Icon Background PDF
Persuade your audience using this Project Summary Report Management Infographic Icon Background PDF. This PPT design covers three stages, thus making it a great tool to use. It also caters to a variety of topics including Project Summary, Report Managemen, Infographic. Download this PPT design now to present a convincing pitch that not only emphasizes the topic but also showcases your presentation skills.
Five Projects Performance Comparison Report Ppt Infographic Template Icons PDF
Pitch your topic with ease and precision using this five projects performance comparison report ppt infographic template icons pdf. This layout presents information on construction project, business project, event project. It is also available for immediate download and adjustment. So, changes can be made in the color, design, graphics or any other component to create a unique layout.
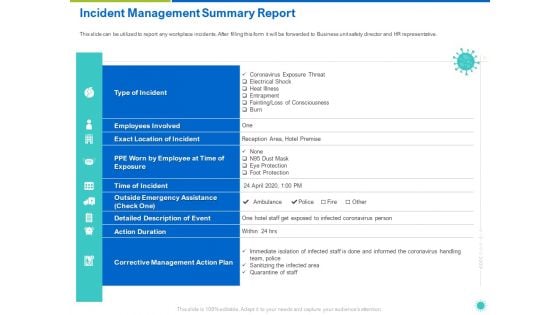
Incident Management Summary Report Ppt Infographic Template Tips PDF
This slide can be utilized to report any workplace incidents. After filling this form it will be forwarded to Business unit safety director and HR representative. Deliver and pitch your topic in the best possible manner with this incident management summary report ppt infographic template tips pdf. Use them to share invaluable insights on management, plan, action duration, employees involved and impress your audience. This template can be altered and modified as per your expectations. So, grab it now.
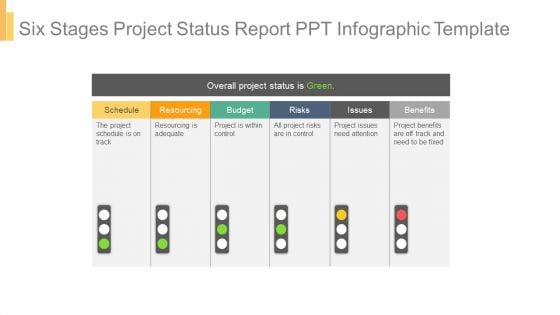
Six Stages Project Status Report Ppt Infographic Template
This is a six stages project status report ppt infographic template. This is a six stage process. The stages in this process are overall project status is green, schedule, resourcing, budget, risks, issues, benefits, the project schedule is on track, resourcing is adequate, project is within control, all project risks are in control, project issues need attention, project benefits are off track and need to be fixed.
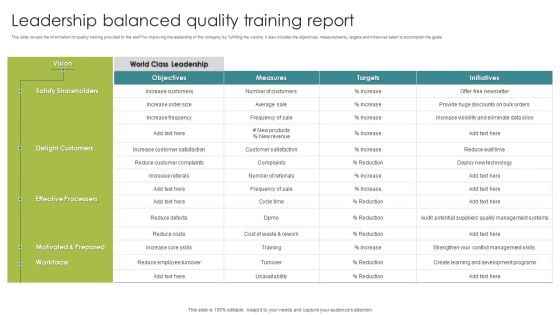
Leadership Balanced Quality Training Report Ppt Infographic Template Show PDF
This slide covers the information on quality training provided to the staff for improving the leadership of the company by fulfilling the visions. It also includes the objectives, measurements, targets and initiatives taken to accomplish the goals. Pitch your topic with ease and precision using this Leadership Balanced Quality Training Report Ppt Infographic Template Show PDF. This layout presents information on Satisfy Shareholders, Delight Customers, Effective Processers. It is also available for immediate download and adjustment. So, changes can be made in the color, design, graphics or any other component to create a unique layout.
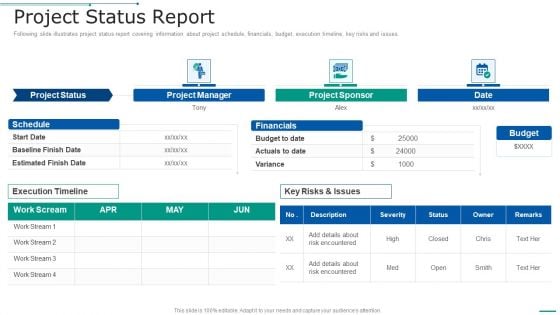
PMP Toolkit Project Status Report Ppt Infographic Template Information PDF
Following slide illustrates project status report covering information about project schedule, financials, budget, execution timeline, key risks and issues. Deliver an awe inspiring pitch with this creative pmp toolkit project schedule gantt chart ppt inspiration slideshow pdf bundle. Topics like project, sponsor, manager can be discussed with this completely editable template. It is available for immediate download depending on the needs and requirements of the user.

Russia Ukraine Conflict Infographics Example Document Report Doc Pdf Ppt
Heres a predesigned Russia Ukraine Conflict Infographics Example Document Report Doc Pdf Ppt for you. Built on extensive research and analysis, this one-complete deck has all the center pieces of your specific requirements. This temple exudes brilliance and professionalism. Being completely editable, you can make changes to suit your purpose. Get this Russia Ukraine Conflict Infographics Example Document Report Doc Pdf Ppt A4 One-pager now.
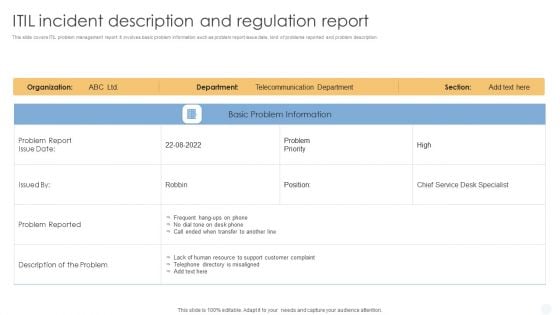
ITIL Incident Description And Regulation Report Infographics PDF
This slide covers ITIL problem management report. It involves basic problem information such as problem report issue date, kind of problems reported and problem description.Pitch your topic with ease and precision using this ITIL Incident Description And Regulation Report Infographics PDF. This layout presents information on Customer Complaint, Problem Reported, Directory Misaligned. It is also available for immediate download and adjustment. So, changes can be made in the color, design, graphics or any other component to create a unique layout.
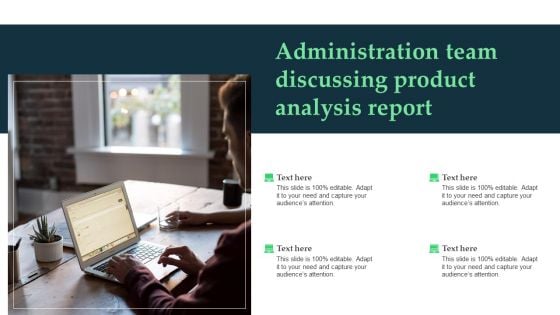
Administration Team Discussing Product Analysis Report Infographics PDF
Presenting Administration Team Discussing Product Analysis Report Infographics PDF to dispense important information. This template comprises four stages. It also presents valuable insights into the topics including Administration Team, Discussing Product Analysis Report. This is a completely customizable PowerPoint theme that can be put to use immediately. So, download it and address the topic impactfully.
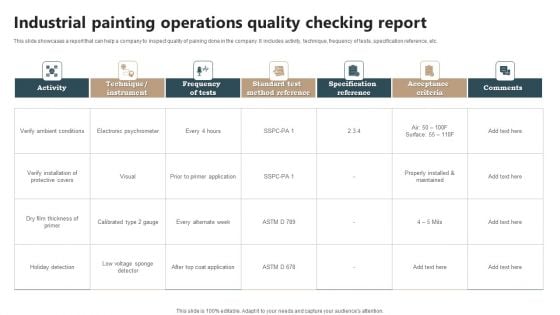
Industrial Painting Operations Quality Checking Report Infographics PDF
This slide showcases a report that can help a company to inspect quality of paining done in the company. It includes activity, technique, frequency of tests, specification reference, etc. Showcasing this set of slides titled Industrial Painting Operations Quality Checking Report Infographics PDF. The topics addressed in these templates are Industrial Painting Operations, Quality Checking Report. All the content presented in this PPT design is completely editable. Download it and make adjustments in color, background, font etc. as per your unique business setting.
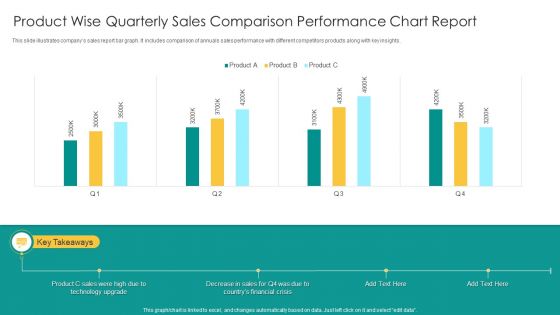
Product Wise Quarterly Sales Comparison Performance Chart Report Infographics PDF
This slide illustrates companys sales report bar graph. It includes comparison of annuals sales performance with different competitors products along with key insights. Showcasing this set of slides titled Product Wise Quarterly Sales Comparison Performance Chart Report Infographics PDF. The topics addressed in these templates are Product C Sales, Technology Upgrade, Financial Crisis. All the content presented in this PPT design is completely editable. Download it and make adjustments in color, background, font etc. as per your unique business setting.
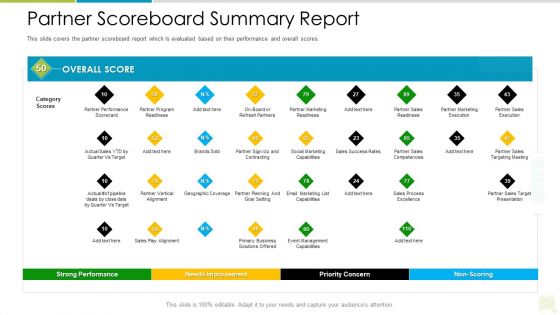
Distributor Entitlement Initiatives Partner Scoreboard Summary Report Infographics PDF
This slide covers the partner scoreboard report which Is evaluated based on their performance and overall scores. Deliver and pitch your topic in the best possible manner with this distributor entitlement initiatives partner scoreboard summary report infographics pdf. Use them to share invaluable insights on performance, marketing, sales, capabilities, target and impress your audience. This template can be altered and modified as per your expectations. So, grab it now.
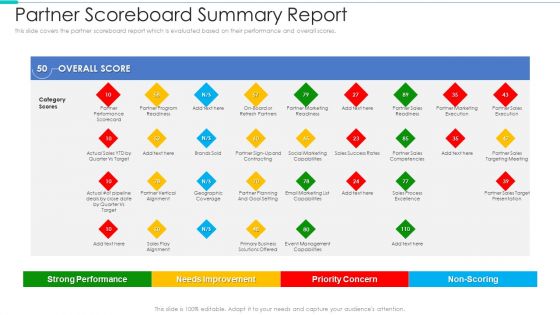
Business Relationship Management Tool Partner Scoreboard Summary Report Infographics PDF
This slide covers the partner scoreboard report which Is evaluated based on their performance and overall scores. Deliver an awe inspiring pitch with this creative business relationship management tool partner scoreboard summary report infographics pdf bundle. Topics like non scoring, priority concern, improvement, performance can be discussed with this completely editable template. It is available for immediate download depending on the needs and requirements of the user.
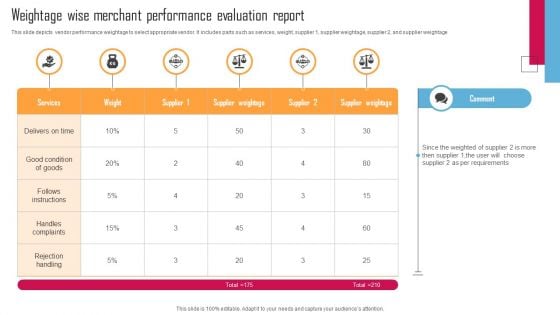
Weightage Wise Merchant Performance Evaluation Report Infographics PDF
This slide depicts vendor performance weightage to select appropriate vendor. It includes parts such as services, weight, supplier 1, supplier weightage, supplier 2, and supplier weightage. Showcasing this set of slides titled Weightage Wise Merchant Performance Evaluation Report Infographics PDF. The topics addressed in these templates are Per Requirements, Weightage Wise Merchant, Evaluation Report. All the content presented in this PPT design is completely editable. Download it and make adjustments in color, background, font etc. as per your unique business setting.
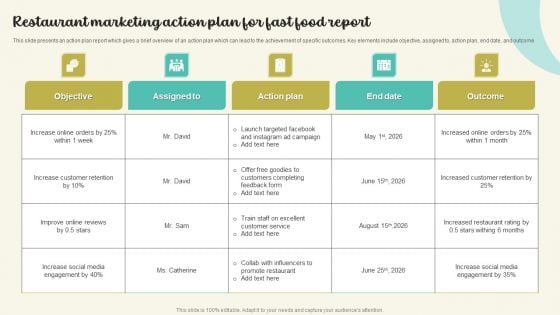
Restaurant Marketing Action Plan For Fast Food Report Infographics PDF
This slide presents an action plan report which gives a brief overview of an action plan which can lead to the achievement of specific outcomes. Key elements include objective, assigned to, action plan, end date, and outcome. Pitch your topic with ease and precision using this Restaurant Marketing Action Plan For Fast Food Report Infographics PDF. This layout presents information on Increase Social Media, Increase Customer Retention, Action Plan. It is also available for immediate download and adjustment. So, changes can be made in the color, design, graphics or any other component to create a unique layout.
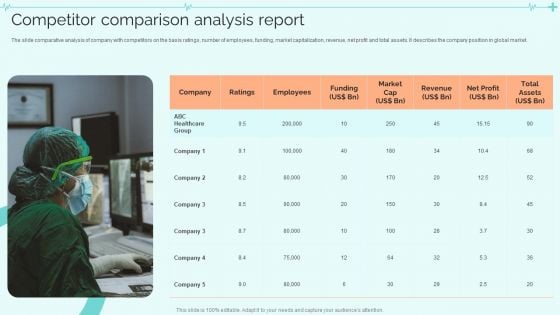
Clinical Services Company Profile Competitor Comparison Analysis Report Infographics PDF
The slide comparative analysis of company with competitors on the basis ratings, number of employees, funding, market capitalization, revenue, net profit and total assets. It describes the company position in global market. This is a Clinical Services Company Profile Competitor Comparison Analysis Report Infographics PDF template with various stages. Focus and dispense information on one stages using this creative set, that comes with editable features. It contains large content boxes to add your information on topics like Employees, Revenue, Net Profit. You can also showcase facts, figures, and other relevant content using this PPT layout. Grab it now.
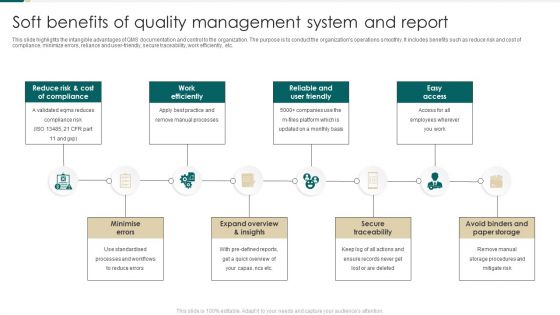
Soft Benefits Of Quality Management System And Report Infographics PDF
This slide highlights the intangible advantages of QMS documentation and control to the organization. The purpose is to conduct the organizations operations smoothly. It includes benefits such as reduce risk and cost of compliance, minimize errors, reliance and user friendly, secure traceability, work efficiently, etc. Persuade your audience using this Soft Benefits Of Quality Management System And Report Infographics PDF. This PPT design covers eight stages, thus making it a great tool to use. It also caters to a variety of topics including Policies And Objectives, Processes And Standard Procedures Download this PPT design now to present a convincing pitch that not only emphasizes the topic but also showcases your presentation skills.
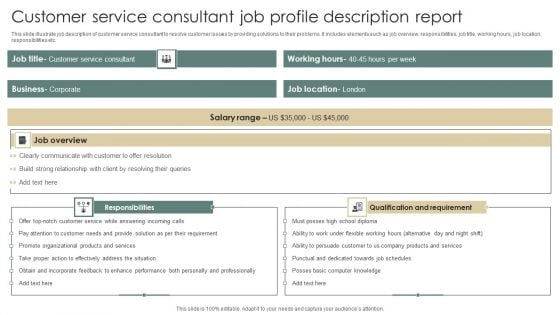
Customer Service Consultant Job Profile Description Report Infographics PDF
This slide illustrate job description of customer service consultant to resolve customer issues by providing solutions to their problems. It includes elements such as job overview, responsibilities, job title, working hours, job location, responsibilities etc. Pitch your topic with ease and precision using this Customer Service Consultant Job Profile Description Report Infographics PDF. This layout presents information on Customer Service Consultant, Salary Range, Working Hours. It is also available for immediate download and adjustment. So, changes can be made in the color, design, graphics or any other component to create a unique layout.
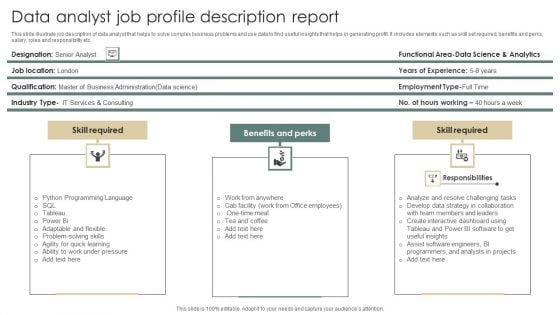
Data Analyst Job Profile Description Report Infographics PDF
This slide illustrate job description of data analyst that helps to solve complex business problems and use data to find useful insights that helps in generating profit. It includes elements such as skill set required, benefits and perks, salary, roles and responsibility etc. Presenting Data Analyst Job Profile Description Report Infographics PDF to dispense important information. This template comprises three stages. It also presents valuable insights into the topics including Skill Required, Benefits Perks, Skill Required. This is a completely customizable PowerPoint theme that can be put to use immediately. So, download it and address the topic impactfully.
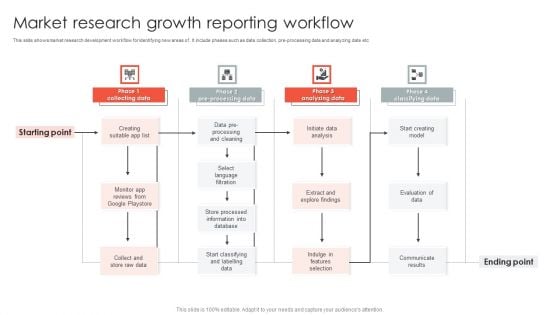
Market Research Growth Reporting Workflow Infographics PDF
This slide shows market research development workflow for identifying new areas of . It include phases such as data collection, pre-processing data and analyzing date etc. Showcasing this set of slides titled Market Research Growth Reporting Workflow Infographics PDF. The topics addressed in these templates are Processing Cleaning, Language Filtration, Information Database. All the content presented in this PPT design is completely editable. Download it and make adjustments in color, background, font etc. as per your unique business setting.
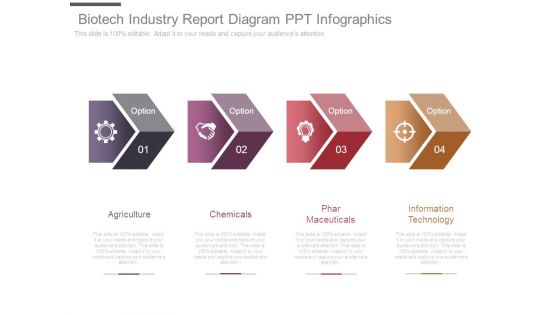
Biotech Industry Report Diagram Ppt Infographics
This is a biotech industry report diagram ppt infographics. This is a four stage process. The stages in this process are agriculture, chemicals, phar maceuticals, information technology.
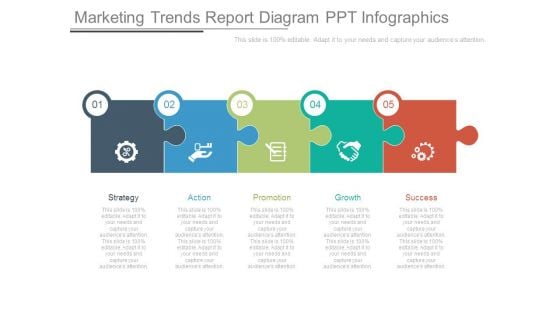
Marketing Trends Report Diagram Ppt Infographics
This is a marketing trends report diagram ppt infographics. This is a five stage process. The stages in this process are strategy, action, promotion, growth, success.
Construction Merchant Report Checklist Icon Infographics PDF
Presenting Construction Merchant Report Checklist Icon Infographics PDF to dispense important information. This template comprises three stages. It also presents valuable insights into the topics including Construction Merchant, Report Checklist Icon. This is a completely customizable PowerPoint theme that can be put to use immediately. So, download it and address the topic impactfully.
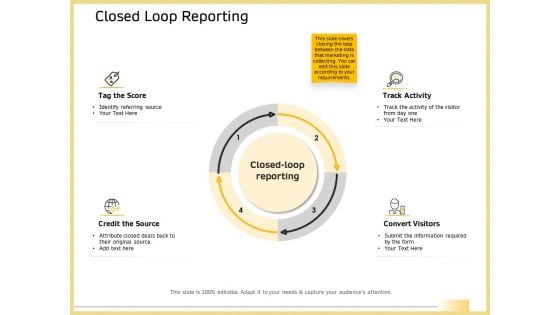
B2B Marketing Closed Loop Reporting Ppt Infographic Template Gridlines PDF
Deliver and pitch your topic in the best possible manner with this b2b marketing closed loop reporting ppt infographic template gridlines pdf. Use them to share invaluable insights on tag score, credit source, track activity, convert visitors, closed loop reporting and impress your audience. This template can be altered and modified as per your expectations. So, grab it now.
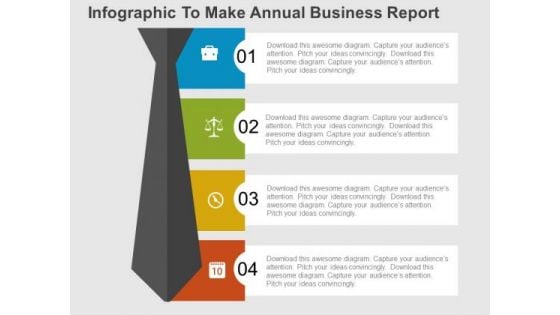
Infographic To Make Annual Business Report PowerPoint Templates
This PowerPoint template has been designed with numbered list of options. This infographic template to make annual business report. Accelerate the impact of your ideas using this template.
Technology Validation Analytical Report Icon Ppt Infographic Template Show Pdf
Showcasing this set of slides titled Technology Validation Analytical Report Icon Ppt Infographic Template Show Pdf. The topics addressed in these templates are Technology Validation, Analytical Report, Icon. All the content presented in this PPT design is completely editable. Download it and make adjustments in color, background, font etc. as per your unique business setting. Our Technology Validation Analytical Report Icon Ppt Infographic Template Show Pdf are topically designed to provide an attractive backdrop to any subject. Use them to look like a presentation pro.

Nestle Performance Management Report Quotes Ppt Infographic Template Gallery PDF
Make sure to capture your audiences attention in your business displays with our gratis customizable Nestle Performance Management Report Quotes Ppt Infographic Template Gallery PDF. These are great for business strategies, office conferences, capital raising or task suggestions. If you desire to acquire more customers for your tech business and ensure they stay satisfied, create your own sales presentation with these plain slides.
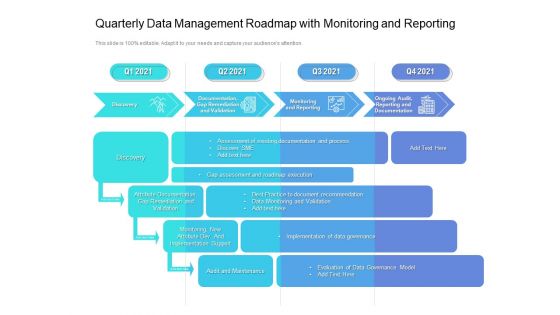
Quarterly Data Management Roadmap With Monitoring And Reporting Infographics
We present our quarterly data management roadmap with monitoring and reporting infographics. This PowerPoint layout is easy-to-edit so you can change the font size, font type, color, and shape conveniently. In addition to this, the PowerPoint layout is Google Slides compatible, so you can share it with your audience and give them access to edit it. Therefore, download and save this well-researched quarterly data management roadmap with monitoring and reporting infographics in different formats like PDF, PNG, and JPG to smoothly execute your business plan.
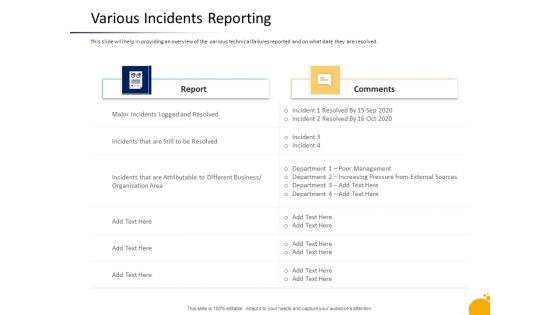
Crisis Management Program Presentation Various Incidents Reporting Infographics PDF
This slide will help in providing an overview of the various technical failures reported and on what date they are resolved. Deliver and pitch your topic in the best possible manner with this crisis management program presentation various incidents reporting infographics pdf. Use them to share invaluable insights on report, comments, external sources, different business, organization area and impress your audience. This template can be altered and modified as per your expectations. So, grab it now.
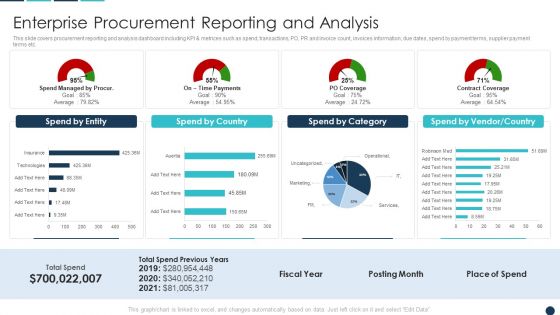
Procurement Analytics Tools And Strategies Enterprise Procurement Reporting Infographics PDF
This slide covers procurement reporting and analysis dashboard including KPI metrices such as spend, transactions, PO, PR and invoice count, invoices information, due dates, spend by payment terms, supplier payment terms etc. Deliver an awe inspiring pitch with this creative Procurement Analytics Tools And Strategies Enterprise Procurement Reporting Infographics PDF bundle. Topics like Spend By Country, Spend Category, Vendor Country can be discussed with this completely editable template. It is available for immediate download depending on the needs and requirements of the user.
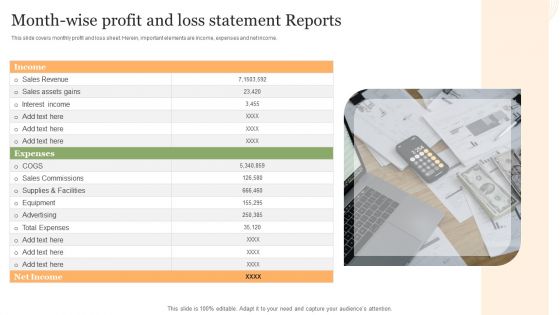
Month Wise Profit And Loss Statement Reports Infographics PDF
This slide covers monthly profit and loss sheet. Herein, important elements are income, expenses and net income.Presenting Month Wise Profit And Loss Statement Reports Infographics PDF to dispense important information. This template comprises one stage. It also presents valuable insights into the topics including Sales Revenue, Sales Assets, Sales Commissions. This is a completely customizable PowerPoint theme that can be put to use immediately. So, download it and address the topic impactfully.
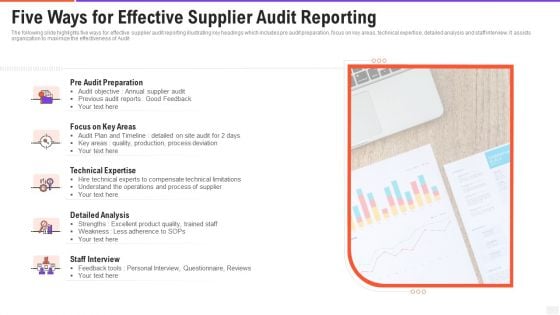
Five Ways For Effective Supplier Audit Reporting Infographics PDF
The following slide highlights five ways for effective supplier audit reporting illustrating key headings which includes pre audit preparation, focus on key areas, technical expertise, detailed analysis and staff interview. It assists organization to maximize the effectiveness of Audit. Persuade your audience using this five ways for effective supplier audit reporting infographics pdf. This PPT design covers five stages, thus making it a great tool to use. It also caters to a variety of topics including focus on key areas technical expertise, detailed analysis. Download this PPT design now to present a convincing pitch that not only emphasizes the topic but also showcases your presentation skills.
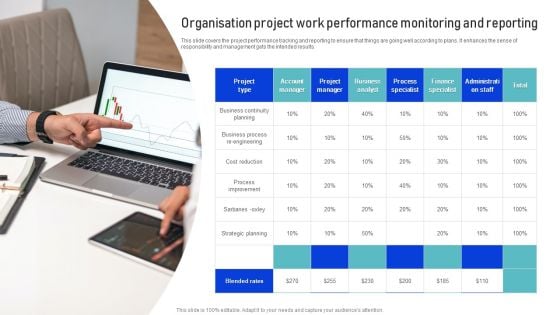
Organisation Project Work Performance Monitoring And Reporting Infographics PDF
This slide covers the project performance tracking and reporting to ensure that things are going well according to plans. It enhances the sense of responsibility and management gets the intended results. Presenting Organisation Project Work Performance Monitoring And Reporting Infographics PDF to dispense important information. This template comprises one stages. It also presents valuable insights into the topics including Business Continuity Planning, Strategic Planning, Business Analyst. This is a completely customizable PowerPoint theme that can be put to use immediately. So, download it and address the topic impactfully.
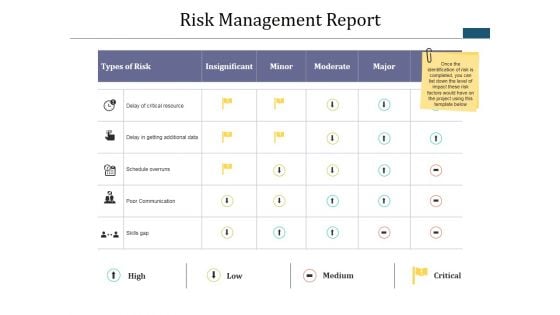
Risk Management Report Ppt PowerPoint Presentation Infographics
This is a risk management report ppt powerpoint presentation infographics. This is a five stage process. The stages in this process are insignificant, minor, moderate, major, severe.
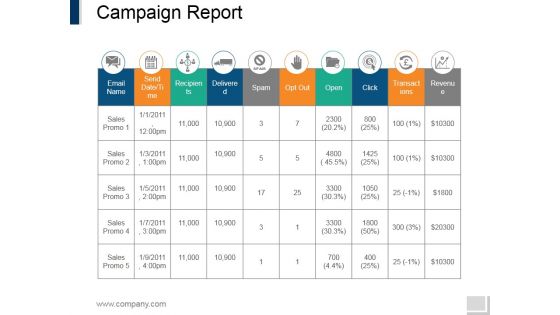
Campaign Report Ppt PowerPoint Presentation Infographics Diagrams
This is a campaign report ppt powerpoint presentation infographics diagrams. This is a nine stage process. The stages in this process are email name, send date, recipients, delivered, spam, transactions.
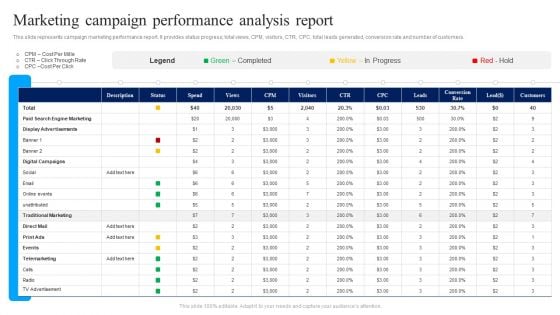
Marketing Campaign Performance Analysis Report Ppt Infographics Infographics PDF
This slide represents campaign marketing performance report. It provides status progress, total views, CPM, visitors, CTR, CPC, total leads generated, conversion rate and number of customers. Showcasing this set of slides titled Marketing Campaign Performance Analysis Report Ppt Infographics Infographics PDF. The topics addressed in these templates are Display Advertisements, Digital Campaigns, Traditional Marketing. All the content presented in this PPT design is completely editable. Download it and make adjustments in color, background, font etc. as per your unique business setting.
After Action Report Infographic Template Ppt PowerPoint Presentation Summary Icons PDF
Presenting this set of slides with name after action report infographic template ppt powerpoint presentation summary icons pdf. This is a five stage process. The stages in this process are improvements, support emergency response, milestones, identify best practices performed. This is a completely editable PowerPoint presentation and is available for immediate download. Download now and impress your audience.
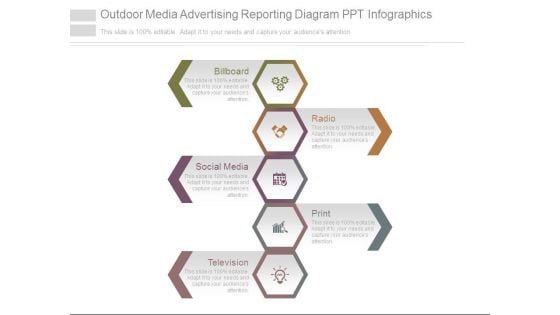
Outdoor Media Advertising Reporting Diagram Ppt Infographics
This is a outdoor media advertising reporting diagram ppt infographics. This is a five stage process. The stages in this process are billboard, radio, social media, print, television.
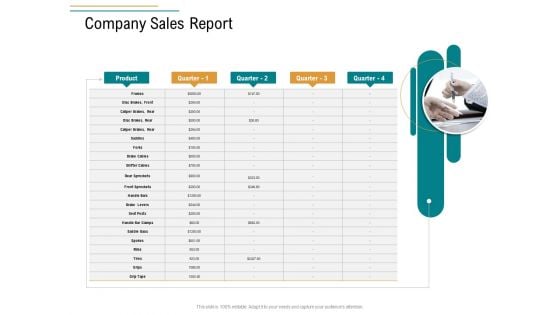
Business Operations Assessment Company Sales Report Ppt Infographics Guide PDF
Deliver and pitch your topic in the best possible manner with this business operations assessment company sales report ppt infographics guide pdf. Use them to share invaluable insights on caliper brakes, rear, product, quarter, company sales report and impress your audience. This template can be altered and modified as per your expectations. So, grab it now.
Staff Performance Appraisal Self Assessment Report Icon Infographics PDF
Presenting Staff Performance Appraisal Self Assessment Report Icon Infographics PDF to dispense important information. This template comprises four stages. It also presents valuable insights into the topics including Staff Performance Appraisal, Assessment Report Icon. This is a completely customizable PowerPoint theme that can be put to use immediately. So, download it and address the topic impactfully.

Project Management Progress Status Report Ppt Infographics Gallery PDF
This slide showcase project management progress report in which task status is shown through colors. It covers three colors to showcase status such as red, yellow and green. Showcasing this set of slides titled Project Management Progress Status Report Ppt Infographics Gallery PDF. The topics addressed in these templates are Overall Status, Accomplishments, Critical Issues, Major Risks. All the content presented in this PPT design is completely editable. Download it and make adjustments in color, background, font etc. as per your unique business setting.
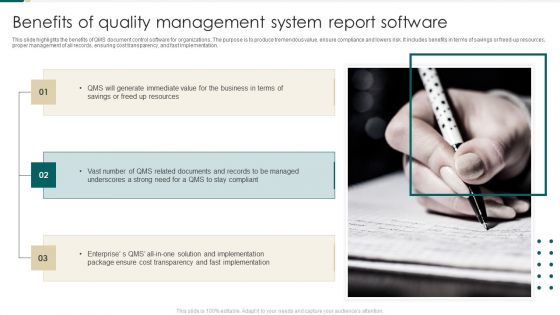
Benefits Of Quality Management System Report Software Infographics PDF
This slide highlights the benefits of QMS document control software for organizations. The purpose is to produce tremendous value, ensure compliance and lowers risk. It includes benefits in terms of savings or freed up resources, proper management of all records, ensuring cost transparency, and fast implementation. Persuade your audience using this Benefits Of Quality Management System Report Software Infographics PDF. This PPT design covers Three stages, thus making it a great tool to use. It also caters to a variety of topics including Benefits Of Quality, Management System, Report Software. Download this PPT design now to present a convincing pitch that not only emphasizes the topic but also showcases your presentation skills.
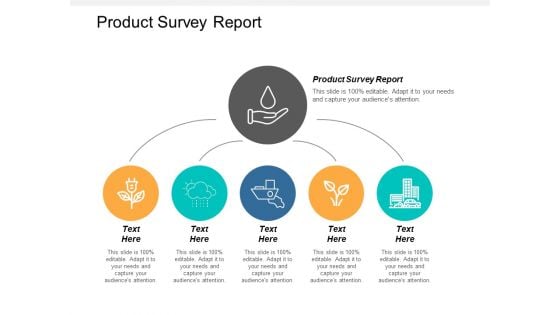
Product Survey Report Ppt PowerPoint Presentation Infographic Template Picture Cpb
This is a product survey report ppt powerpoint presentation infographic template picture cpb. This is a five stage process. The stages in this process are product survey report.
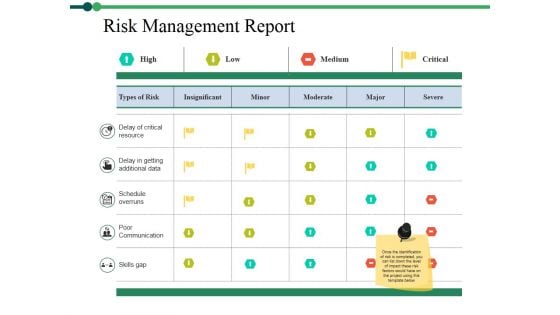
Risk Management Report Ppt PowerPoint Presentation Infographic Template Pictures
This is a risk management report ppt powerpoint presentation infographic template pictures. This is a three stage process. The stages in this process are high, low, medium, critical.
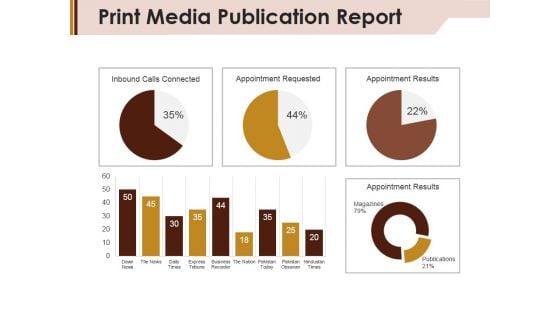
Print Media Publication Report Ppt PowerPoint Presentation Infographic Template Deck
This is a print media publication report ppt powerpoint presentation infographic template deck. This is a five stage process. The stages in this process are appointment requested, appointment results, inbound calls connected.
Email Marketing Report Ppt Powerpoint Presentation Infographic Template Icons
This is a email marketing report ppt powerpoint presentation infographic template icons. This is a four stage process. The stages in this process are opens, click rate, unopened, bounces.
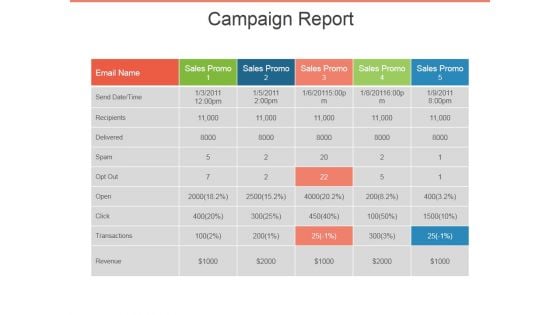
Campaign Report Ppt PowerPoint Presentation Infographic Template Images
This is a campaign report ppt powerpoint presentation infographic template images. This is a five stage process. The stages in this process are sales promo, email name, recipients, spam, delivered.

Client Referral Report Ppt PowerPoint Presentation Infographic Template Graphics Tutorials
This is a client referral report ppt powerpoint presentation infographic template graphics tutorials. This is a three stage process. The stages in this process are received referrals, sent referrals, calendar events, proposal sent, proposal converted.
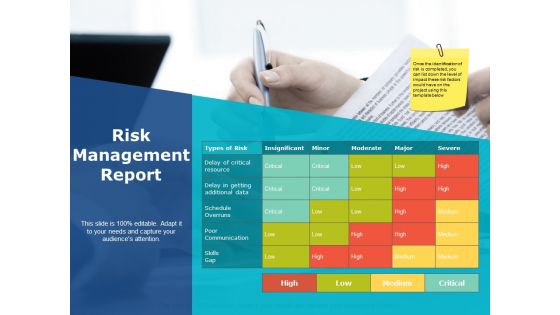
Risk Management Report Ppt PowerPoint Presentation Infographic Template Design Ideas
This is a risk management report ppt powerpoint presentation infographic template design ideas. This is a four stage process. The stages in this process are business, planning, strategy, marketing, management.
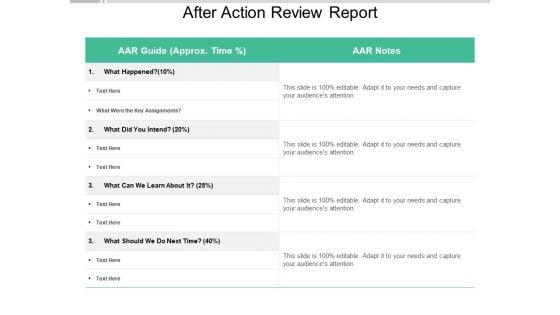
After Action Review Report Ppt PowerPoint Presentation Infographic Template Aids
Presenting this set of slides with name after action review report ppt powerpoint presentation infographic template aids. The topics discussed in these slides are after action review, performance analysis, future performances. This is a completely editable PowerPoint presentation and is available for immediate download. Download now and impress your audience.
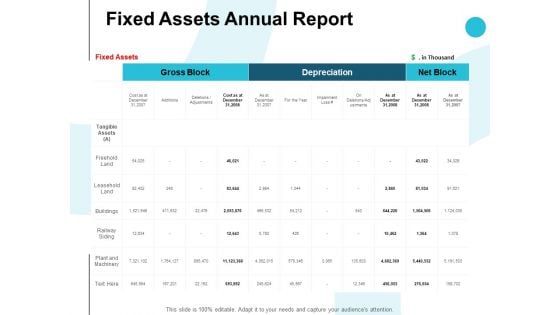
Fixed Assets Annual Report Ppt PowerPoint Presentation Infographic Template Styles
Presenting this set of slides with name fixed assets annual report ppt powerpoint presentation infographic template styles. The topics discussed in these slides are business, planning, strategy, marketing, management. This is a completely editable PowerPoint presentation and is available for immediate download. Download now and impress your audience.

 Home
Home