Infographic Report
Annual Employee Attrition Tracking Report With Separation And Appointment Rates Infographics PDF
This slide covers summary report of employees separation rates with reasons. It also includes total appointments including transfers and promotion rates with percentage for cumulative turnover. Showcasing this set of slides titled Annual Employee Attrition Tracking Report With Separation And Appointment Rates Infographics PDF. The topics addressed in these templates are Organizational, Separation And Appointment Rates, Employee Attrition. All the content presented in this PPT design is completely editable. Download it and make adjustments in color, background, font etc. as per your unique business setting.
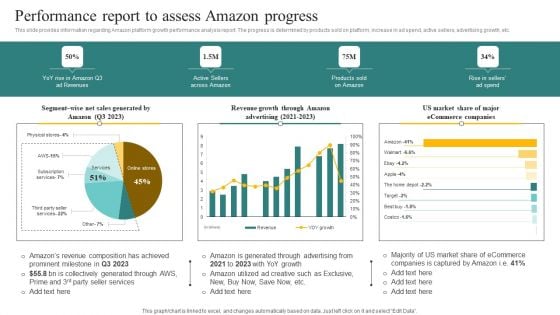
Performance Report To Assess Amazon Progress Ppt Infographics Design Inspiration PDF
This slide provides information regarding Amazon platform growth performance analysis report. The progress is determined by products sold on platform, increase in ad spend, active sellers, advertising growth, etc. From laying roadmaps to briefing everything in detail, our templates are perfect for you. You can set the stage with your presentation slides. All you have to do is download these easy to edit and customizable templates. Performance Report To Assess Amazon Progress Ppt Infographics Design Inspiration PDF will help you deliver an outstanding performance that everyone would remember and praise you for. Do download this presentation today.
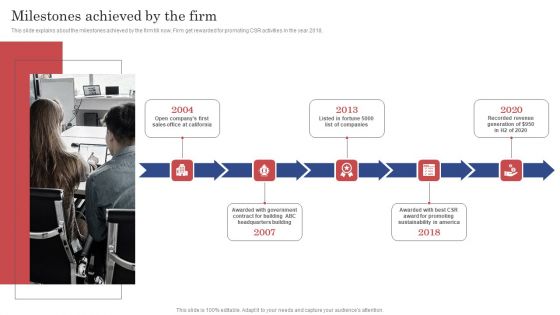
Construction Project Cost Benefit Analysis Report Milestones Achieved By The Firm Infographics PDF
This slide explains about the milestones achieved by the firm till now. Firm get rewarded for promoting CSR activities in the year 2018. Slidegeeks is one of the best resources for PowerPoint templates. You can download easily and regulate Construction Project Cost Benefit Analysis Report Milestones Achieved By The Firm Infographics PDF for your personal presentations from our wonderful collection. A few clicks is all it takes to discover and get the most relevant and appropriate templates. Use our Templates to add a unique zing and appeal to your presentation and meetings. All the slides are easy to edit and you can use them even for advertisement purposes.
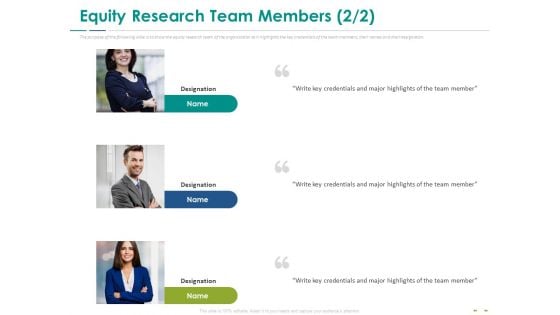
Stock Market Research Report Equity Research Team Members Planning Infographics PDF
The purpose of the following slide is to show the equity research team of the organization as it highlights the key credentials of the team members, their names and their designation. Presenting stock market research report equity research team members planning infographics pdf to provide visual cues and insights. Share and navigate important information on three stages that need your due attention. This template can be used to pitch topics like equity research team. In addition, this PPT design contains high-resolution images, graphics, etc, that are easily editable and available for immediate download.
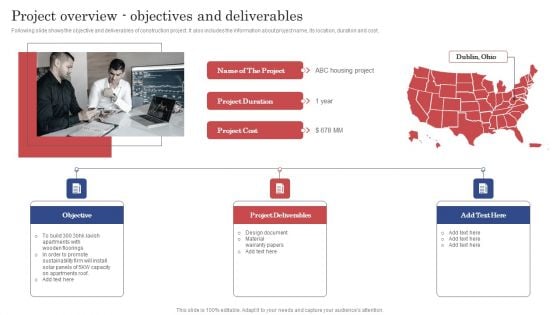
Construction Project Cost Benefit Analysis Report Project Overview Objectives And Deliverables Infographics PDF
Following slide shows the objective and deliverables of construction project. It also includes the information about project name, its location, duration and cost. Slidegeeks is here to make your presentations a breeze with Construction Project Cost Benefit Analysis Report Project Overview Objectives And Deliverables Infographics PDF With our easy to use and customizable templates, you can focus on delivering your ideas rather than worrying about formatting. With a variety of designs to choose from, you are sure to find one that suits your needs. And with animations and unique photos, illustrations, and fonts, you can make your presentation pop. So whether you are giving a sales pitch or presenting to the board, make sure to check out Slidegeeks first.

Nestle Performance Management Report Understanding Business Environment SWOT Analysis Infographics PDF
This slide provides glimpse about SWOT analysis of Nestle SA to compare strengths and weaknesses of company with opportunities and threats from external environment. It includes strengths, weaknesses, opportunities, threats, etc. Slidegeeks is here to make your presentations a breeze with Nestle Performance Management Report Understanding Business Environment SWOT Analysis Infographics PDF With our easy-to-use and customizable templates, you can focus on delivering your ideas rather than worrying about formatting. With a variety of designs to choose from, you are sure to find one that suits your needs. And with animations and unique photos, illustrations, and fonts, you can make your presentation pop. So whether you are giving a sales pitch or presenting to the board, make sure to check out Slidegeeks first.
Calculator With Business Reports For Operational Efficiency Ppt Powerpoint Presentation Ideas Infographic Template
This is a calculator with business reports for operational efficiency ppt powerpoint presentation ideas infographic template. This is a four stage process. The stages in this process are business metrics, business kpi, business dashboard.
Business Team Reporting Project Status Vector Icon Ppt Powerpoint Presentation Infographic Template Elements Pdf
Persuade your audience using this business team reporting project status vector icon ppt powerpoint presentation infographic template elements pdf. This PPT design covers three stages, thus making it a great tool to use. It also caters to a variety of topics including business, team reporting, project status, vector icon. Download this PPT design now to present a convincing pitch that not only emphasizes the topic but also showcases your presentation skills
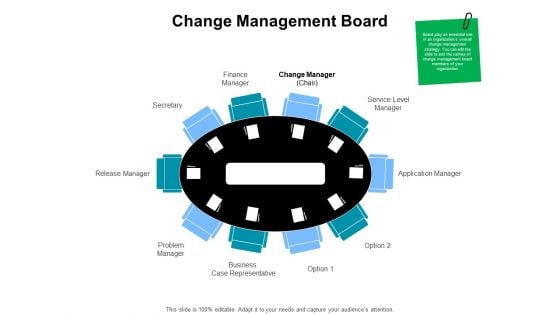
Gap Analysis Budgeting And Reporting Change Management Board Ppt PowerPoint Presentation Slides Infographic Template PDF
Presenting this set of slides with name gap analysis budgeting and reporting change management board ppt powerpoint presentation slides infographic template pdf. This is a two stage process. The stages in this process are finance manager, change manager, service level manager, application manager, business, case representative, problem manager, release manager, secretary. This is a completely editable PowerPoint presentation and is available for immediate download. Download now and impress your audience.
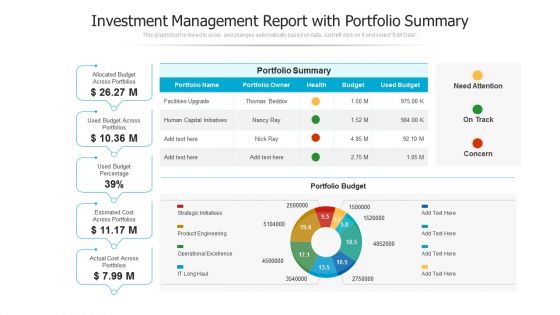
Investment Management Report With Portfolio Summary Ppt PowerPoint Presentation Infographics Clipart PDF
Pitch your topic with ease and precision using this Investment Management Report With Portfolio Summary Ppt PowerPoint Presentation Infographics Clipart PDF. This layout presents information on investment management report with portfolio summary. It is also available for immediate download and adjustment. So, changes can be made in the color, design, graphics or any other component to create a unique layout.
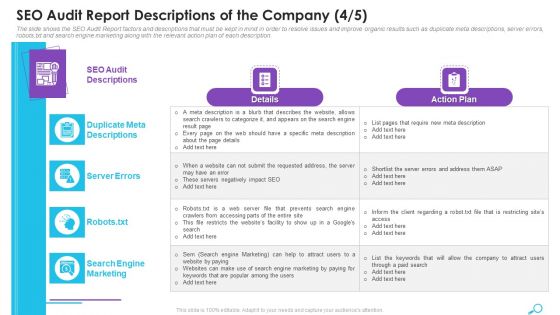
SEO Audit Report Descriptions Of The Company Errors Ppt Infographics Microsoft PDF
The slide shows the SEO Audit Report factors and descriptions that must be kept in mind in order to resolve issues and improve organic results such as duplicate meta descriptions, server errors, robots.txt and search engine marketing along with the relevant action plan of each description. Deliver an awe inspiring pitch with this creative seo audit report descriptions of the company errors ppt infographics microsoft pdf bundle. Topics like seo audit report descriptions of the company can be discussed with this completely editable template. It is available for immediate download depending on the needs and requirements of the user.

Business Task Report With Person Responsible Ppt PowerPoint Presentation Infographics Guide PDF
Showcasing this set of slides titled business task report with person responsible ppt powerpoint presentation infographics guide pdf. The topics addressed in these templates are business task report with person responsible. All the content presented in this PPT design is completely editable. Download it and make adjustments in color, background, font etc. as per your unique business setting.
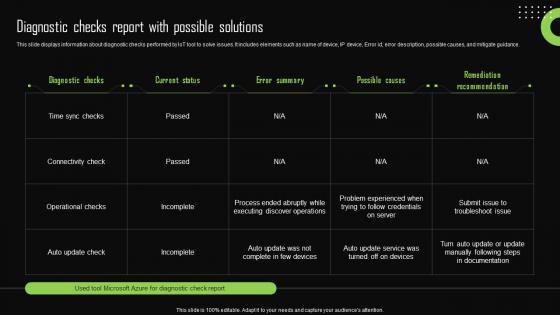
Diagnostic Checks Report With Possible Solutions Iot Device Management Infographics Pdf
This slide displays information about diagnostic checks performed by IoT tool to solve issues. It includes elements such as name of device, IP device, Error id, error description, possible causes, and mitigate guidance. Crafting an eye-catching presentation has never been more straightforward. Let your presentation shine with this tasteful yet straightforward Diagnostic Checks Report With Possible Solutions Iot Device Management Infographics Pdf template. It offers a minimalistic and classy look that is great for making a statement. The colors have been employed intelligently to add a bit of playfulness while still remaining professional. Construct the ideal Diagnostic Checks Report With Possible Solutions Iot Device Management Infographics Pdf that effortlessly grabs the attention of your audience Begin now and be certain to wow your customers This slide displays information about diagnostic checks performed by IoT tool to solve issues. It includes elements such as name of device, IP device, Error id, error description, possible causes, and mitigate guidance.
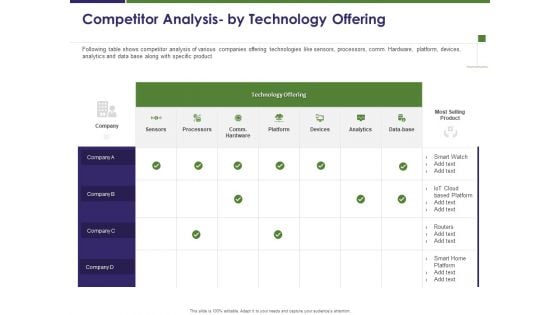
Business Intelligence Report Competitor Analysis By Technology Offering Ppt Infographics Slide Portrait PDF
Presenting this set of slides with name business intelligence report competitor analysis by technology offering ppt infographics slide portrait pdf. The topics discussed in these slides are sensors, processors, platform, devices, analytics, data base. This is a completely editable PowerPoint presentation and is available for immediate download. Download now and impress your audience.
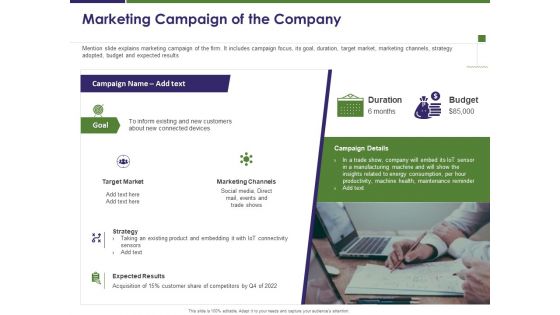
Business Intelligence Report Marketing Campaign Of The Company Ppt Infographics Rules PDF
Presenting this set of slides with name business intelligence report marketing campaign of the company ppt infographics rules pdf. This is a one stage process. The stages in this process are target market, strategy, expected results, marketing channels, duration, budget. This is a completely editable PowerPoint presentation and is available for immediate download. Download now and impress your audience.
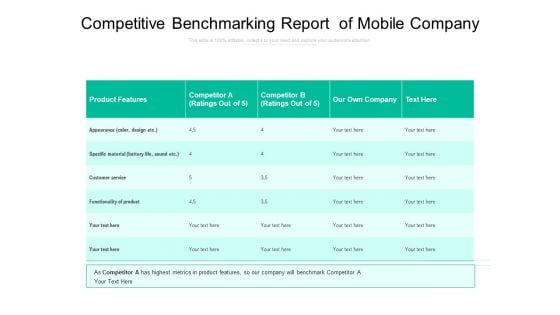
Competitive Benchmarking Report Of Mobile Company Ppt PowerPoint Presentation Infographics Pictures PDF
Presenting this set of slides with name competitive benchmarking report of mobile company ppt powerpoint presentation infographics pictures pdf. The topics discussed in these slides are product features, competitor ratings out, our own company, customer service, functionality of product. This is a completely editable PowerPoint presentation and is available for immediate download. Download now and impress your audience.
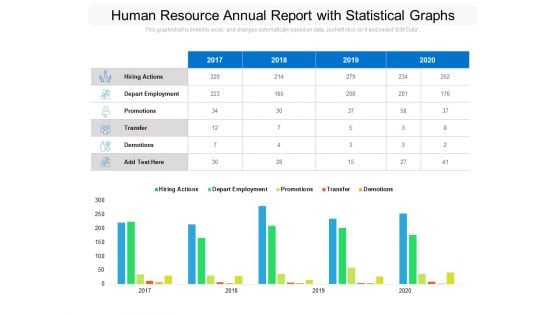
Human Resource Annual Report With Statistical Graphs Ppt PowerPoint Presentation Infographics Shapes PDF
Presenting this set of slides with name human resource annual report with statistical graphs ppt powerpoint presentation infographics shapes pdf. The topics discussed in these slides are hiring actions, depart employment, promotions, transfer, demotions, 2017 to 2020. This is a completely editable PowerPoint presentation and is available for immediate download. Download now and impress your audience.
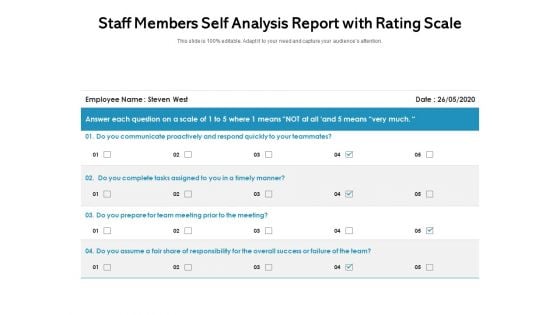
Staff Members Self Analysis Report With Rating Scale Ppt PowerPoint Presentation Infographics Microsoft PDF
Pitch your topic with ease and precision using this staff members self analysis report with rating scale ppt powerpoint presentation infographics microsoft pdf. This layout presents information on employee, team, timely manner, meeting. It is also available for immediate download and adjustment. So, changes can be made in the color, design, graphics or any other component to create a unique layout.
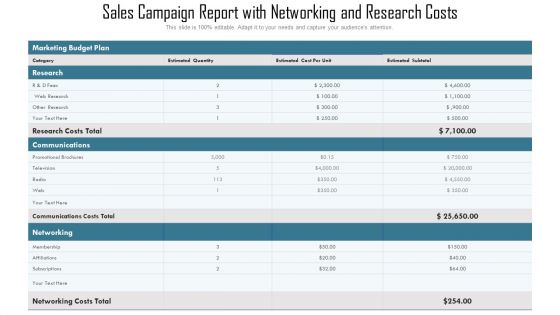
Sales Campaign Report With Networking And Research Costs Ppt Infographics Graphics PDF
Pitch your topic with ease and precision using this sales campaign report with networking and research costs ppt infographics graphics pdf. This layout presents information on networking, communications, research. It is also available for immediate download and adjustment. So, changes can be made in the color, design, graphics or any other component to create a unique layout.
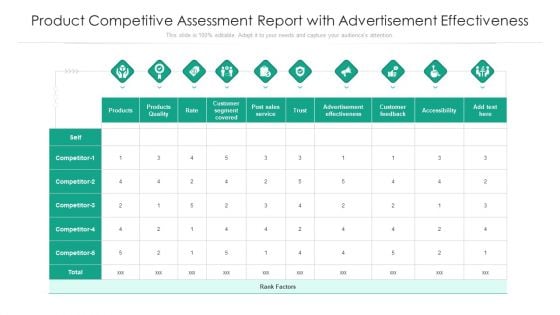
Product Competitive Assessment Report With Advertisement Effectiveness Ppt PowerPoint Presentation Infographics Gallery PDF
Showcasing this set of slides titled product competitive assessment report with advertisement effectiveness ppt powerpoint presentation infographics gallery pdf. The topics addressed in these templates are products quality, customer segment covered, advertisement effectiveness. All the content presented in this PPT design is completely editable. Download it and make adjustments in color, background, font etc. as per your unique business setting.
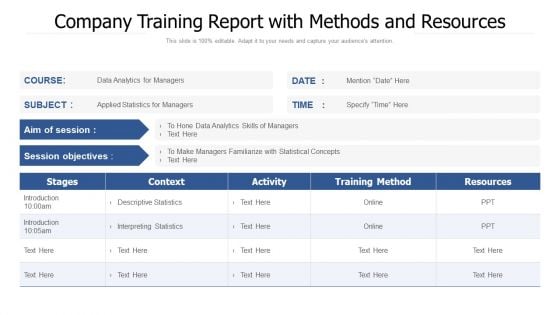
Company Training Report With Methods And Resources Ppt Ideas Infographics PDF
Showcasing this set of slides titled company training report with methods and resources ppt ideas infographics pdf. The topics addressed in these templates are statistics, data analytics, training method. All the content presented in this PPT design is completely editable. Download it and make adjustments in color, background, font etc. as per your unique business setting.

Lawyer Checking Legal Investigation Report Of Client Ppt PowerPoint Presentation File Infographics PDF
Persuade your audience using this lawyer checking legal investigation report of client ppt powerpoint presentation file infographics pdf. This PPT design covers two stages, thus making it a great tool to use. It also caters to a variety of topics including lawyer checking legal investigation report of client. Download this PPT design now to present a convincing pitch that not only emphasizes the topic but also showcases your presentation skills.
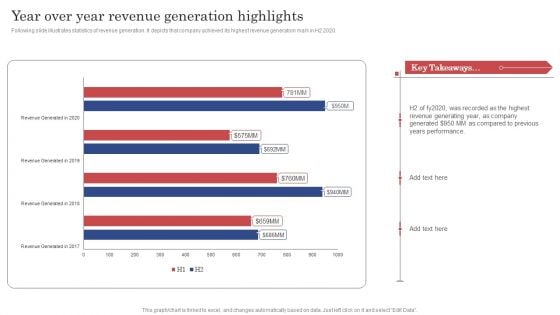
Construction Project Cost Benefit Analysis Report Year Over Year Revenue Generation Highlights Infographics PDF
Following slide illustrates statistics of revenue generation. It depicts that company achieved its highest revenue generation mark in H2 2020. Here you can discover an assortment of the finest PowerPoint and Google Slides templates. With these templates, you can create presentations for a variety of purposes while simultaneously providing your audience with an eye catching visual experience. Download Construction Project Cost Benefit Analysis Report Year Over Year Revenue Generation Highlights Infographics PDF to deliver an impeccable presentation. These templates will make your job of preparing presentations much quicker, yet still, maintain a high level of quality. Slidegeeks has experienced researchers who prepare these templates and write high quality content for you. Later on, you can personalize the content by editing the Construction Project Cost Benefit Analysis Report Year Over Year Revenue Generation Highlights Infographics PDF.
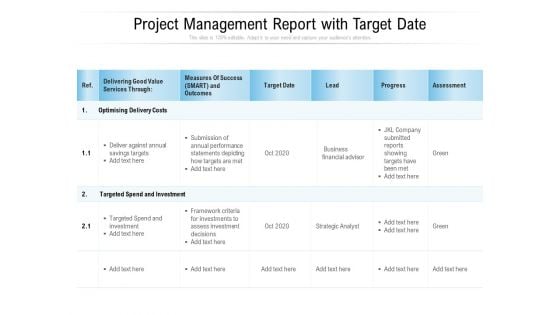
Project Management Report With Target Date Ppt PowerPoint Presentation Infographics Mockup PDF
Pitch your topic with ease and precision using this project management report with target date ppt powerpoint presentation infographics mockup pdf. This layout presents information on optimising delivery costs, targeted spend and investment, target date, lead, progress, assessment. It is also available for immediate download and adjustment. So, changes can be made in the color, design, graphics or any other component to create a unique layout.
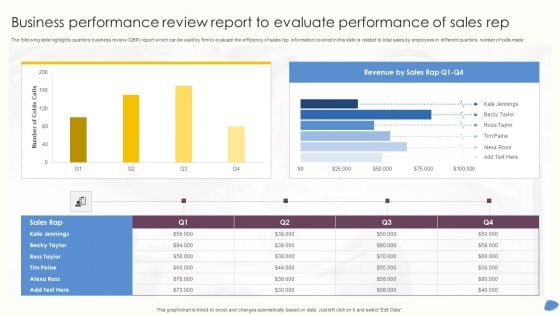
Business Performance Review Report To Evaluate Performance Of Sales Rep Infographics PDF
The following slide highlights quarterly business review QBR report which can be used by firm to evaluate the efficiency of sales rep. information covered in this slide is related to total sales by employees in different quarters, number of calls made. Pitch your topic with ease and precision using this Business Performance Review Report To Evaluate Performance Of Sales Rep Infographics PDF. This layout presents information on Revenue Sales, Tim Paine, Number Colds Calls. It is also available for immediate download and adjustment. So, changes can be made in the color, design, graphics or any other component to create a unique layout.
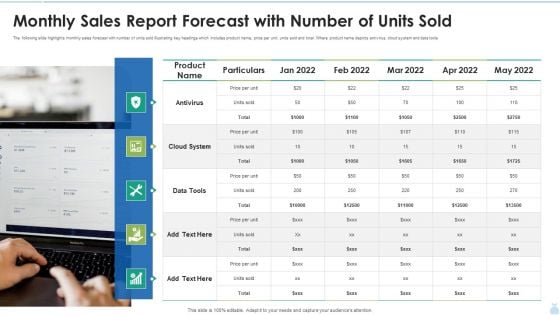
Monthly Sales Report Forecast With Number Of Units Sold Infographics PDF
The following slide highlights monthly sales forecast with number of units sold illustrating key headings which includes product name, price per unit, units sold and total. Where product name depicts antivirus, cloud system and data tools. Presenting Monthly Sales Report Forecast With Number Of Units Sold Infographics PDF to provide visual cues and insights. Share and navigate important information on five stages that need your due attention. This template can be used to pitch topics like Monthly Sales Report, Units Sold, Cloud System. In addtion, this PPT design contains high resolution images, graphics, etc, that are easily editable and available for immediate download.
Weekly Activities Tracking Report And Task Analysis In Project Management Infographics PDF
The purpose of this template is to analyze the tasks and track the actions on weekly basis. It covers information about different activities and its status. Showcasing this set of slides titled Weekly Activities Tracking Report And Task Analysis In Project Management Infographics PDF. The topics addressed in these templates are Listing Tasks And Resources, Preparing Task Layout, Assigning Roles. All the content presented in this PPT design is completely editable. Download it and make adjustments in color, background, font etc. as per your unique business setting.
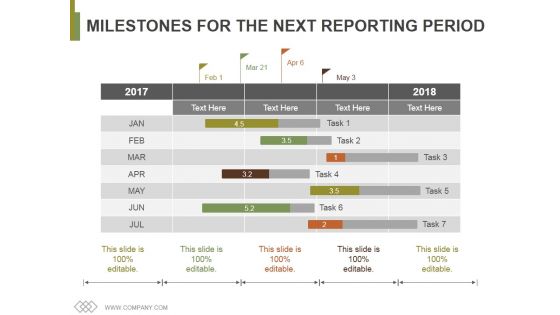
Milestones For The Next Reporting Period Ppt PowerPoint Presentation Infographics Display
This is a milestones for the next reporting period ppt powerpoint presentation infographics display. This is a seven stage process. The stages in this process are task, table, business, marketing, management.
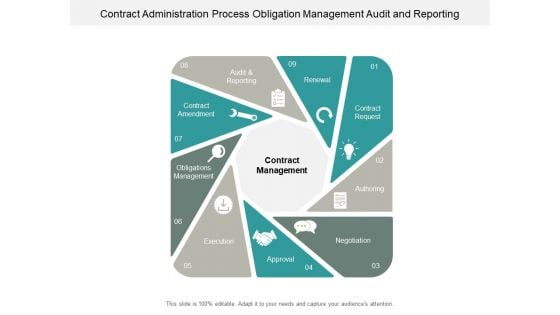
Contract Administration Process Obligation Management Audit And Reporting Ppt PowerPoint Presentation Styles Infographics
This is a contract administration process obligation management audit and reporting ppt powerpoint presentation styles infographics. This is a eight stage process. The stages in this process are contract management, contract negotiation, deal making.
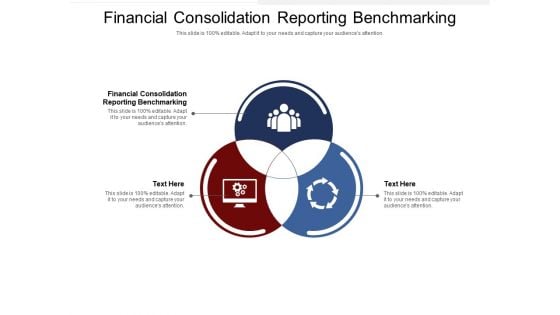
Financial Consolidation Reporting Benchmarking Ppt PowerPoint Presentation Infographics Layout Cpb Pdf
Presenting this set of slides with name financial consolidation reporting benchmarking ppt powerpoint presentation infographics layout cpb pdf. This is an editable Powerpoint three stages graphic that deals with topics like financial consolidation reporting benchmarking to help convey your message better graphically. This product is a premium product available for immediate download and is 100 percent editable in Powerpoint. Download this now and use it in your presentations to impress your audience.
Data Analytics Reporting Structure Ppt PowerPoint Presentation Infographics Clipart Images Cpb Pdf
Presenting this set of slides with name data analytics reporting structure ppt powerpoint presentation infographics clipart images cpb pdf. This is an editable Powerpoint one stages graphic that deals with topics like data analysis reporting tools to help convey your message better graphically. This product is a premium product available for immediate download and is 100 percent editable in Powerpoint. Download this now and use it in your presentations to impress your audience.
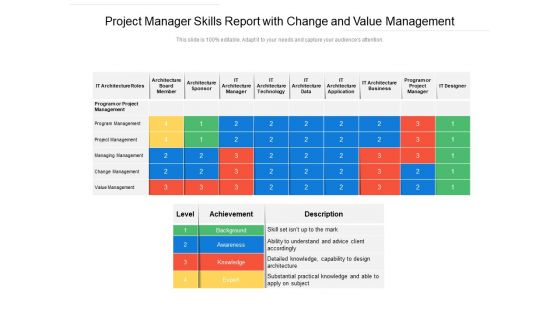
Project Manager Skills Report With Change And Value Management Ppt PowerPoint Presentation Infographic Template Format Ideas PDF
Pitch your topic with ease and precision using this project manager skills report with change and value management ppt powerpoint presentation infographic template format ideas pdf. This layout presents information on achievement, awareness, knowledge, background, it architecture technology, it architecture data, it architecture application, it architecture business. It is also available for immediate download and adjustment. So, changes can be made in the color, design, graphics or any other component to create a unique layout.
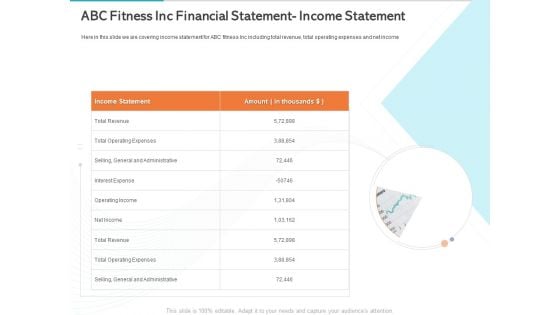
Gym Health And Fitness Market Industry Report Abc Fitness Inc Financial Statement Income Statement Ppt Infographic Template Gallery PDF
Presenting this set of slides with name gym health and fitness market industry report abc fitness inc financial statement income statement ppt infographic template gallery pdf. The topics discussed in these slides are income statement, amount, total revenue, total operating expenses, general and administrative, interest expense, operating income, net income. This is a completely editable PowerPoint presentation and is available for immediate download. Download now and impress your audience.
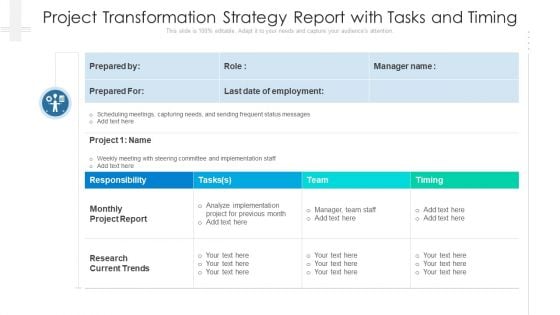
Project Transformation Strategy Report With Tasks And Timing Ppt PowerPoint Presentation Infographics Background Designs PDF
Deliver an awe-inspiring pitch with this creative project transformation strategy report with tasks and timing ppt powerpoint presentation infographics background designs pdf bundle. Topics like responsibility, monthly project report, research current trends can be discussed with this completely editable template. It is available for immediate download depending on the needs and requirements of the user.
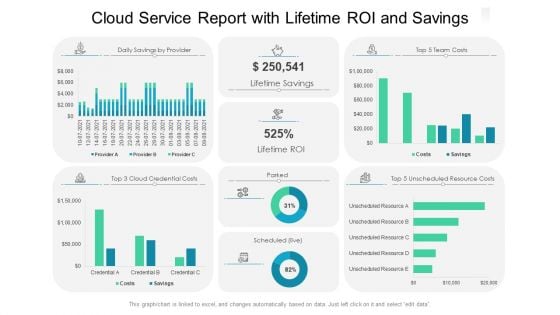
Cloud Service Report With Lifetime Roi And Savings Ppt Model Infographics PDF
Showcasing this set of slides titled cloud service report with lifetime roi and savings ppt model infographics pdf. The topics addressed in these templates are cloud service report with lifetime roi and savings. All the content presented in this PPT design is completely editable. Download it and make adjustments in color, background, font etc. as per your unique business setting.
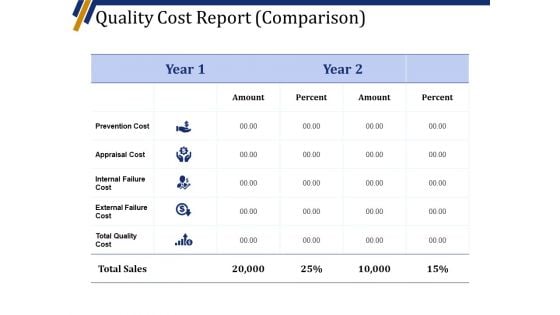
Quality Cost Report Comparison Template 1 Ppt PowerPoint Presentation Pictures Infographics
This is a quality cost report comparison template 1 ppt powerpoint presentation pictures infographics. This is a five stage process. The stages in this process are amount, percent, year, appraisal cost, prevention cost.
Recruitment Hiring Analysis Report For New Employees Ppt PowerPoint Presentation Icon Infographics PDF
Presenting this set of slides with name recruitment hiring analysis report for new employees ppt powerpoint presentation icon infographics pdf. This is a three stage process. The stages in this process are recruitment hiring analysis report for new employees. This is a completely editable PowerPoint presentation and is available for immediate download. Download now and impress your audience.

Project Budget Utilization Report With Name And Type Ppt PowerPoint Presentation Infographics PDF
Presenting this set of slides with name project budget utilization report with name and type ppt powerpoint presentation infographics pdf. The topics discussed in these slides are budget, budget type, current, budgeted, forecasted, current vs budgeted, forecasted vs budgeted, project abc, project pqr, investment, expenditure. This is a completely editable PowerPoint presentation and is available for immediate download. Download now and impress your audience.
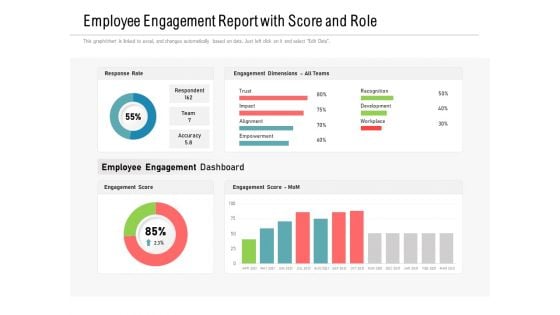
Employee Engagement Report With Score And Role Ppt PowerPoint Presentation Infographics Visual Aids PDF
Pitch your topic with ease and precision using this employee engagement report with score and role ppt powerpoint presentation infographics visual aids pdf. This layout presents information on response rate, engagement score, employee engagement dashboard. It is also available for immediate download and adjustment. So, changes can be made in the color, design, graphics or any other component to create a unique layout.
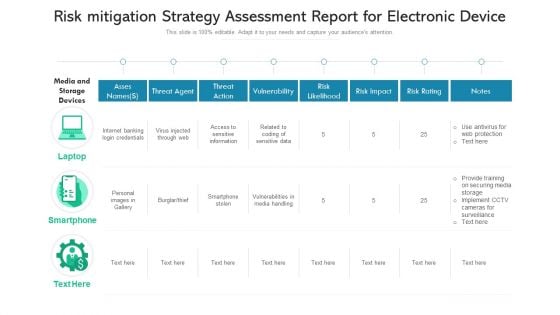
Risk Mitigation Strategy Assessment Report For Electronic Device Ppt PowerPoint Presentation File Infographics PDF
Showcasing this set of slides titled risk mitigation strategy assessment report for electronic device ppt powerpoint presentation file infographics pdf. The topics addressed in these templates are laptop, smartphone, threat agent. All the content presented in this PPT design is completely editable. Download it and make adjustments in color, background, font etc. as per your unique business setting.
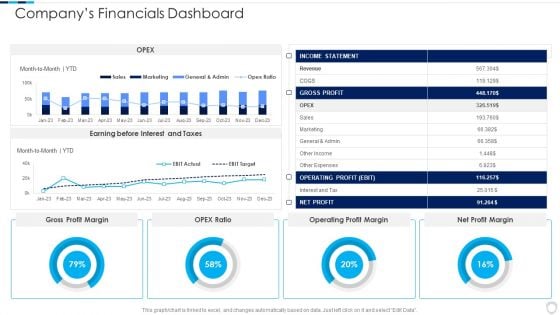
Financial Report Of An IT Firm Companys Financials Dashboard Infographics PDF
Deliver an awe inspiring pitch with this creative Financial Report Of An IT Firm Companys Financials Dashboard Infographics PDF bundle. Topics like Operating Profit, Gross Profit, Income Statement can be discussed with this completely editable template. It is available for immediate download depending on the needs and requirements of the user.
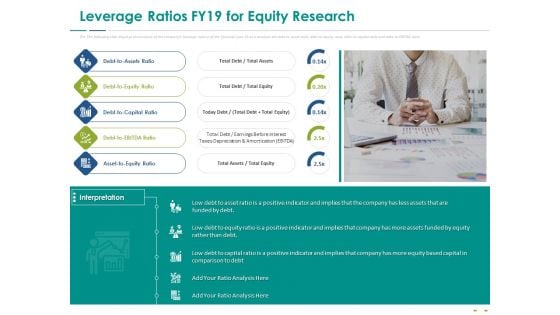
Stock Market Research Report Leverage Ratios FY19 For Equity Research Ppt Infographics Elements PDF
The following slide displays the analysis of the companys leverage ratio o of the financial year 19 as it analysis the debt to asset ratio, debt to equity ratio, debt to capital ratio and debt to EBITDA ratio. Presenting stock market research report leverage ratios fy19 for equity research ppt infographics elements pdf to provide visual cues and insights. Share and navigate important information on five stages that need your due attention. This template can be used to pitch topics like debt to assets ratio, debt to equity ratio, debt to capital ratio, debt to ebitda ratio, asset to equity ratio. In addition, this PPT design contains high-resolution images, graphics, etc, that are easily editable and available for immediate download.
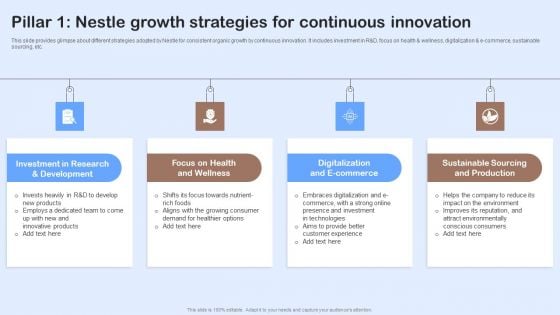
Nestle Performance Management Report Pillar 1 Nestle Growth Strategies For Continuous Infographics PDF
This slide provides glimpse about different strategies adopted by Nestle for consistent organic growth by continuous innovation. It includes investment in RandD, focus on health and wellness, digitalization and e-commerce, sustainable sourcing, etc. Slidegeeks is one of the best resources for PowerPoint templates. You can download easily and regulate Nestle Performance Management Report Pillar 1 Nestle Growth Strategies For Continuous Infographics PDF for your personal presentations from our wonderful collection. A few clicks is all it takes to discover and get the most relevant and appropriate templates. Use our Templates to add a unique zing and appeal to your presentation and meetings. All the slides are easy to edit and you can use them even for advertisement purposes.
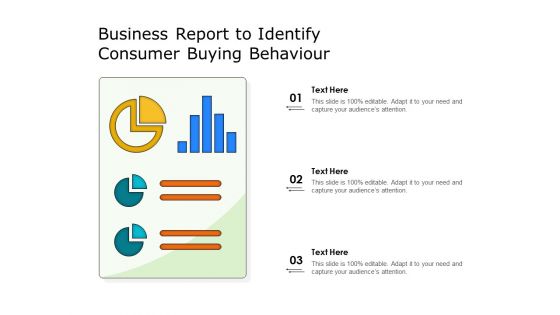
Business Report To Identify Consumer Buying Behaviour Ppt PowerPoint Presentation Infographics Gridlines PDF
Showcasing this set of slides titled business report to identify consumer buying behaviour ppt powerpoint presentation infographics gridlines pdf. The topics addressed in these templates are business report to identify consumer buying behaviour. All the content presented in this PPT design is completely editable. Download it and make adjustments in color, background, font etc. as per your unique business setting.
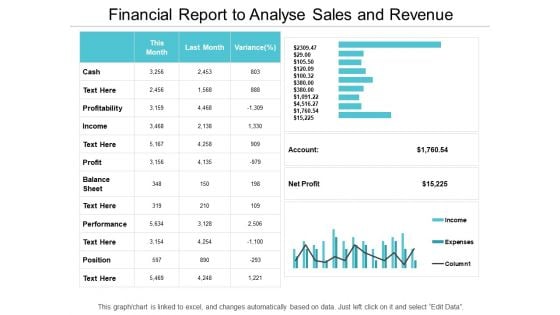
Financial Report To Analyse Sales And Revenue Ppt PowerPoint Presentation Infographics Samples
This is a financial report to analyse sales and revenue ppt powerpoint presentation infographics samples. This is a four stage process. The stages in this process are accounting review, accounting report, accounting statement.
Financial Report With Bar Chart Vector Icon Ppt PowerPoint Presentation Infographics Objects PDF
Presenting this set of slides with name financial report with bar chart vector icon ppt powerpoint presentation infographics objects pdf. This is a three stage process. The stages in this process are financial report with bar chart vector icon. This is a completely editable PowerPoint presentation and is available for immediate download. Download now and impress your audience.
Project Report Analysis With Expected Vs Actual Results Icon Ppt Infographics Clipart Images PDF
Presenting Project Report Analysis With Expected Vs Actual Results Icon Ppt Infographics Clipart Images PDF to dispense important information. This template comprises four stages. It also presents valuable insights into the topics including Project Report Analysis, Expected Vs Actual, Results Icon. This is a completely customizable PowerPoint theme that can be put to use immediately. So, download it and address the topic impactfully.
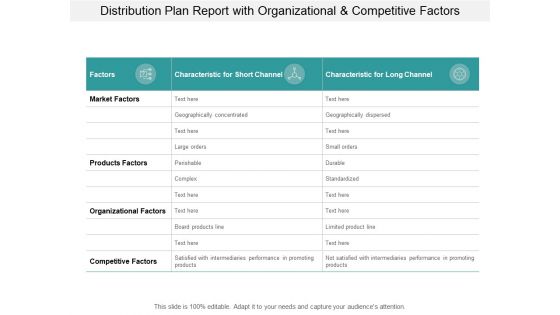
Distribution Plan Report With Organizational And Competitive Factors Ppt PowerPoint Presentation Infographics Visual Aids
Presenting this set of slides with name distribution plan report with organizational and competitive factors ppt powerpoint presentation infographics visual aids. The topics discussed in these slides are channel strategy, distribution marketing, marketing strategy. This is a completely editable PowerPoint presentation and is available for immediate download. Download now and impress your audience.
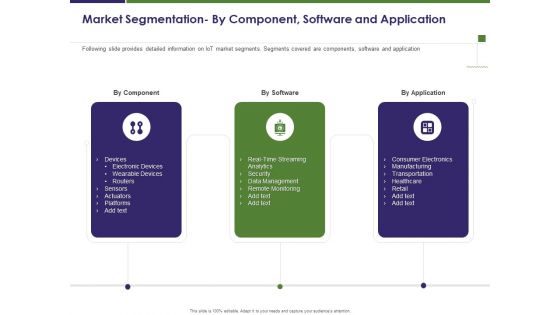
Business Intelligence Report Market Segmentation By Component Software And Application Ppt Infographics Examples PDF
Presenting this set of slides with name business intelligence report market segmentation by component software and application ppt infographics examples pdf. This is a three stage process. The stages in this process are component, software, application. This is a completely editable PowerPoint presentation and is available for immediate download. Download now and impress your audience.
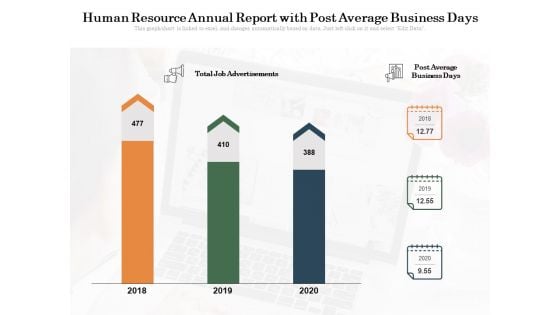
Human Resource Annual Report With Post Average Business Days Ppt PowerPoint Presentation Infographics Display PDF
Presenting this set of slides with name human resource annual report with post average business days ppt powerpoint presentation infographics display pdf. The topics discussed in these slides are post average business days, 2018 to 2020, total job advertisement. This is a completely editable PowerPoint presentation and is available for immediate download. Download now and impress your audience.
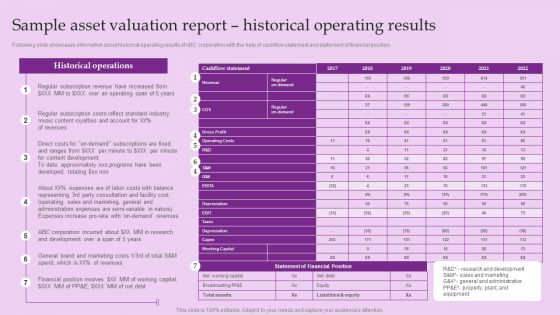
Sample Asset Valuation Report Historical Operating Results Brand And Equity Evaluation Techniques Infographics PDF
Following slide showcases information about historical operating results of ABC corporation with the help of cashflow statement and statement of financial position.Find highly impressive Sample Asset Valuation Report Historical Operating Results Brand And Equity Evaluation Techniques Infographics PDF on Slidegeeks to deliver a meaningful presentation. You can save an ample amount of time using these presentation templates. No need to worry to prepare everything from scratch because Slidegeeks experts have already done a huge research and work for you. You need to download Sample Asset Valuation Report Historical Operating Results Brand And Equity Evaluation Techniques Infographics PDF for your upcoming presentation. All the presentation templates are 100 precent editable and you can change the color and personalize the content accordingly. Download now.
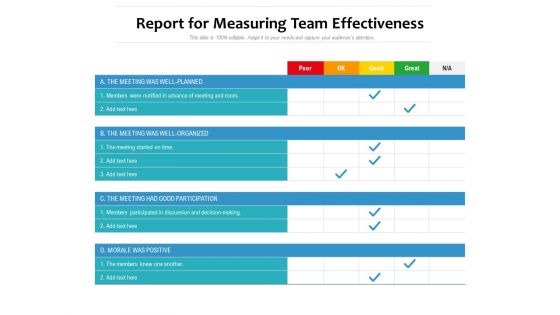
Report For Measuring Team Effectiveness Ppt PowerPoint Presentation Layouts Infographics PDF
Pitch your topic with ease and precision using this report for measuring team effectiveness ppt powerpoint presentation layouts infographics pdf. This layout presents information on morale was positive, the meeting had good participation, the meeting was well organized, the meeting was well planned. It is also available for immediate download and adjustment. So, changes can be made in the color, design, graphics or any other component to create a unique layout.
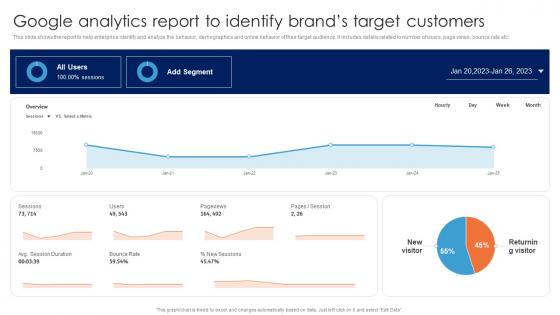
Google Analytics Report To Identify Brands Guide For Data Driven Advertising Infographics Pdf
This slide shows the report to help enterprise identify and analyze the behavior, demographics and online behavior of their target audience. It includes details related to number of users, page views, bounce rate etc.Slidegeeks is one of the best resources for PowerPoint templates. You can download easily and regulate Google Analytics Report To Identify Brands Guide For Data Driven Advertising Infographics Pdf for your personal presentations from our wonderful collection. A few clicks is all it takes to discover and get the most relevant and appropriate templates. Use our Templates to add a unique zing and appeal to your presentation and meetings. All the slides are easy to edit and you can use them even for advertisement purposes. This slide shows the report to help enterprise identify and analyze the behavior, demographics and online behavior of their target audience. It includes details related to number of users, page views, bounce rate etc.
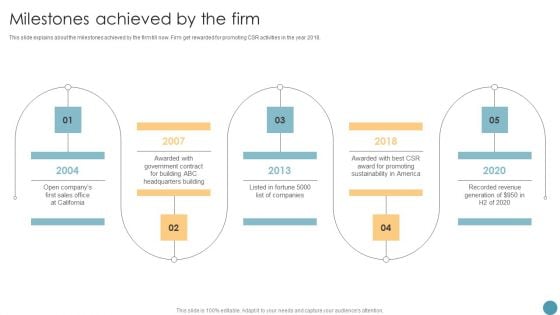
Feasibility Analysis Report For Construction Project Milestones Achieved By The Firm Infographics PDF
This slide explains about the milestones achieved by the firm till now. Firm get rewarded for promoting CSR activities in the year 2018. Make sure to capture your audiences attention in your business displays with our gratis customizable Feasibility Analysis Report For Construction Project Milestones Achieved By The Firm Infographics PDF. These are great for business strategies, office conferences, capital raising or task suggestions. If you desire to acquire more customers for your tech business and ensure they stay satisfied, create your own sales presentation with these plain slides.
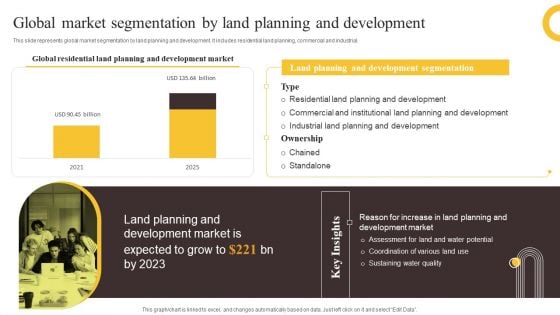
Global Construction Sector Industry Report Global Market Segmentation By Land Planning And Development Infographics PDF
This slide represents global market segmentation by land planning and development. It includes residential land planning, commercial and industrial. Welcome to our selection of the Global Construction Sector Industry Report Global Market Segmentation By Land Planning And Development Infographics PDF. These are designed to help you showcase your creativity and bring your sphere to life. Planning and Innovation are essential for any business that is just starting out. This collection contains the designs that you need for your everyday presentations. All of our PowerPoints are 100 percent editable, so you can customize them to suit your needs. This multi purpose template can be used in various situations. Grab these presentation templates today.
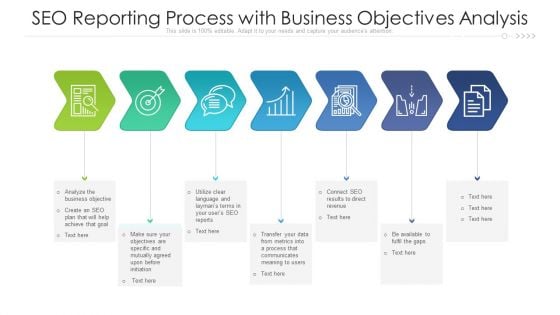
SEO Reporting Process With Business Objectives Analysis Ppt Infographics Gridlines PDF
Persuade your audience using this seo reporting process with business objectives analysis ppt infographics gridlines pdf. This PPT design covers seven stages, thus making it a great tool to use. It also caters to a variety of topics including revenue, objectives, business, goal, plan. Download this PPT design now to present a convincing pitch that not only emphasizes the topic but also showcases your presentation skills.
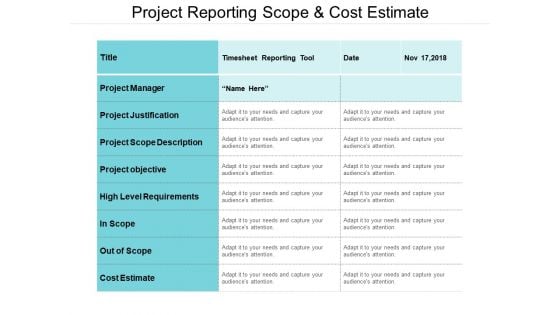
Project Reporting Scope And Cost Estimate Ppt PowerPoint Presentation Infographics Guidelines
Presenting this set of slides with name project reporting scope and cost estimate ppt powerpoint presentation infographics guidelines. The topics discussed in these slides are project management, project scope, project charter, project goals. This is a completely editable PowerPoint presentation and is available for immediate download. Download now and impress your audience.
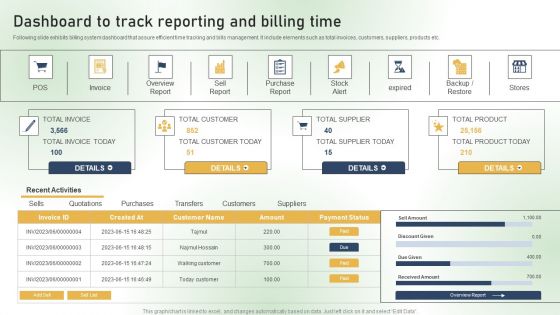
Dashboard To Track Reporting And Billing Time Ppt PowerPoint Presentation File Infographics PDF
Following slide exhibits billing system dashboard that assure efficient time tracking and bills management. It include elements such as total invoices, customers, suppliers, products etc. Coming up with a presentation necessitates that the majority of the effort goes into the content and the message you intend to convey. The visuals of a PowerPoint presentation can only be effective if it supplements and supports the story that is being told. Keeping this in mind our experts created Dashboard To Track Reporting And Billing Time Ppt PowerPoint Presentation File Infographics PDF to reduce the time that goes into designing the presentation. This way, you can concentrate on the message while our designers take care of providing you with the right template for the situation.
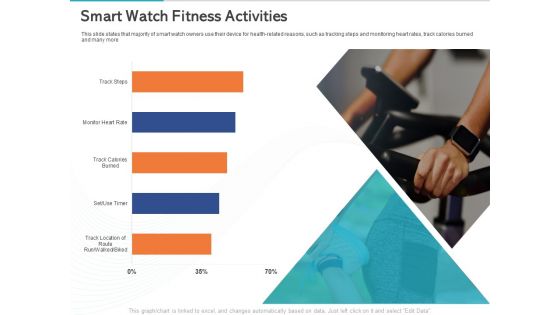
Gym Health And Fitness Market Industry Report Smart Watch Fitness Activities Ppt PowerPoint Presentation Infographics Ideas PDF
Presenting this set of slides with name gym health and fitness market industry report smart watch fitness activities ppt powerpoint presentation infographics ideas pdf. The topics discussed in these slide is smart watch fitness activities. This is a completely editable PowerPoint presentation and is available for immediate download. Download now and impress your audience.
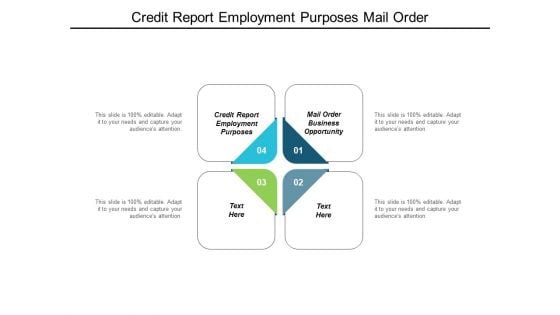
Credit Report Employment Purposes Mail Order Business Opportunity Ppt PowerPoint Presentation Infographic Template Samples
This is a credit report employment purposes mail order business opportunity ppt powerpoint presentation infographic template samples. This is a four stage process. The stages in this process are credit report employment purposes, mail order business opportunity.

 Home
Home