Innovation Dashboard

Revenue Kpi Dashboard Ppt Infographic Template
This is a revenue kpi dashboard ppt infographic template. This is a five stage process. The stages in this process are outcasts, successful adverts, earned revenue, sold products, operations.
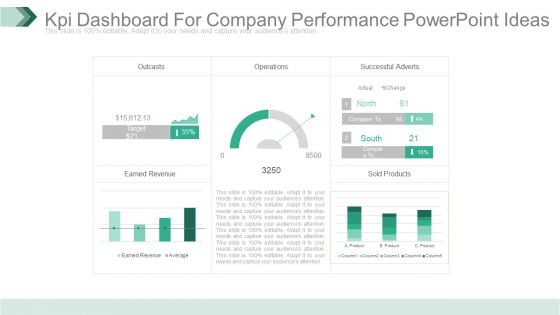
Kpi Dashboard For Company Performance Powerpoint Ideas
This is a kpi dashboard for company performance powerpoint ideas. This is a five stage process. The stages in this process are outcasts, operations, successful adverts, earned revenue, sold products.
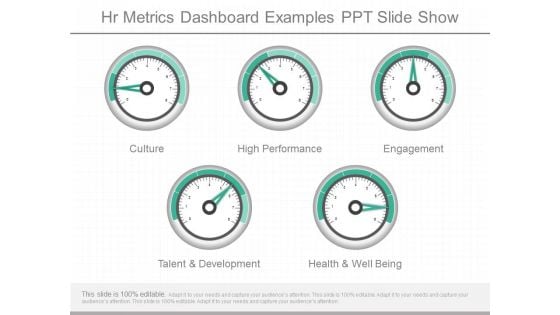
Hr Metrics Dashboard Examples Ppt Slide Show
This is a hr metrics dashboard examples ppt slide show. This is a five stage process. The stages in this process are culture, high performance, engagement, talent and development, health and well being.
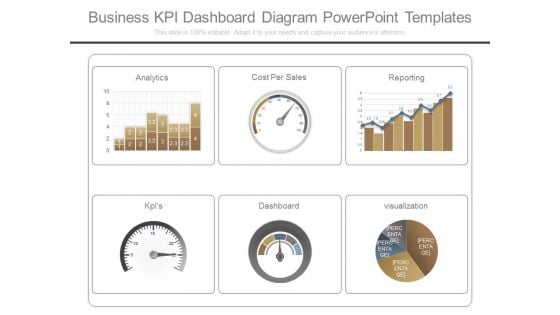
Business Kpi Dashboard Diagram Powerpoint Templates
This is a business kpi dashboard diagram powerpoint templates. This is a six stage process. The stages in this process are analytics, cost per sales, reporting, kpis, dashboard, visualization.
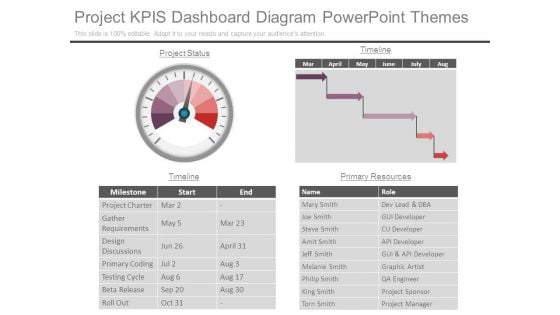
Project Kpis Dashboard Diagram Powerpoint Themes
This is a project kpis dashboard diagram powerpoint themes. This is a one stage process. The stages in this process are project status, timeline, name, role, milestone, start, end, primary resources, project charter, gather requirements, design discussions, primary coding, testing cycle, beta release, roll out, mary smith, joe smith, steve smith, amit smith, jeff smith, melanie smith, philip smith, king smith, torn smith, dev lead and dba, gui developer, cu developer, api developer, gui and api developer, graphic artist, qa engineer, project sponsor, project manager.
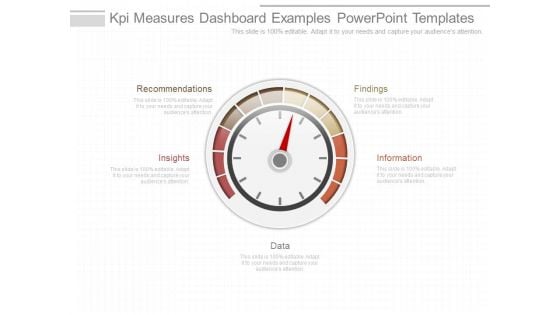
Kpi Measures Dashboard Examples Powerpoint Templates
This is a kpi measures dashboard examples powerpoint templates. This is a four stage process. The stages in this process are recommendations, insights, data, information, findings.
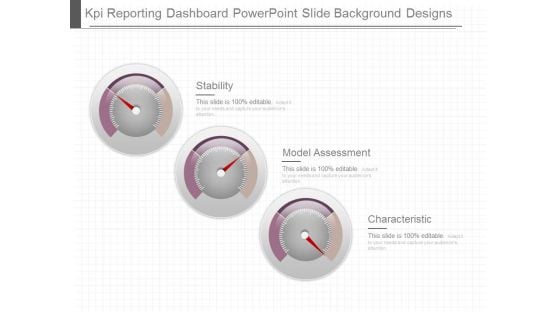
Kpi Reporting Dashboard Powerpoint Slide Background Designs
This is a kpi reporting dashboard powerpoint slide background designs. This is a three stage process. The stages in this process are stability, model assessment, characteristic.
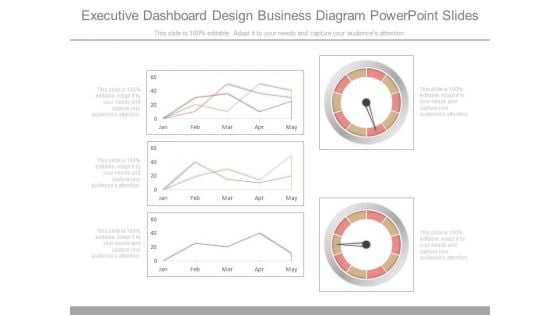
Executive Dashboard Design Business Diagram Powerpoint Slides
This is a executive dashboard design business diagram powerpoint slides. This is a three stage process. The stages in this process are jan, feb, mar, apr, may.
Project Tracking Dashboard Template Ppt Sample
This is a project tracking dashboard template ppt sample. This is a five stage process. The stages in this process are requirements, analytics, needs, performance, analysis.
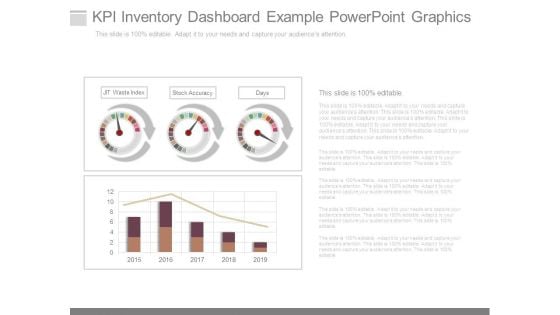
Kpi Inventory Dashboard Example Powerpoint Graphics
This is a kpi inventory dashboard example powerpoint graphics. This is a three stage process. The stages in this process are jit waste index, stock accuracy, days.
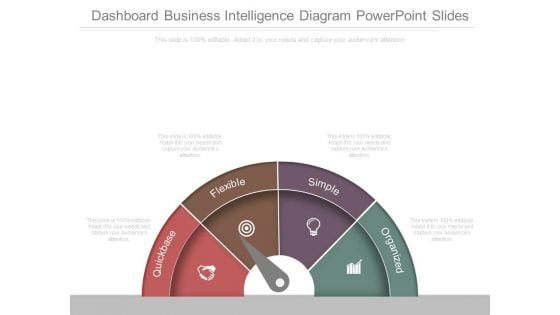
Dashboard Business Intelligence Diagram Powerpoint Slides
This is a dashboard business intelligence diagram powerpoint slides. This is a four stage process. The stages in this process are quickbase, flexible, simple, organized.
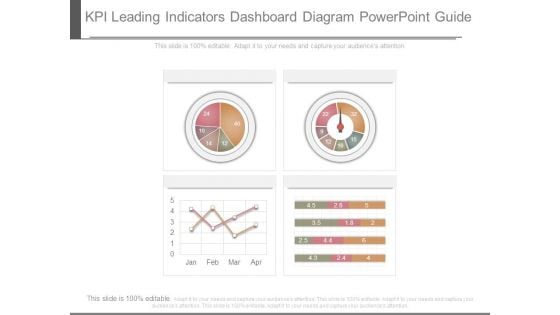
Kpi Leading Indicators Dashboard Diagram Powerpoint Guide
This is a kpi leading indicators dashboard diagram powerpoint guide. This is a four stage process. The stages in this process are business, success, process.

Hr Dashboard Solutions Diagram Powerpoint Slides
This is a hr dashboard solutions diagram powerpoint slides. This is a two stage process. The stages in this process are time to recruit by month, recruitment cost by month, sick, holiday, suspended, injured.
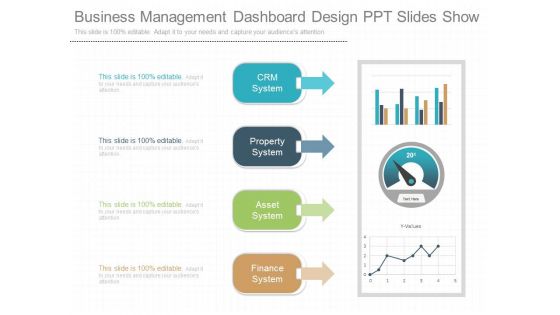
Business Management Dashboard Design Ppt Slides Show
This is a business management dashboard design ppt slides show. This is a four stage process. The stages in this process are crm system, property system, asset system, finance system.
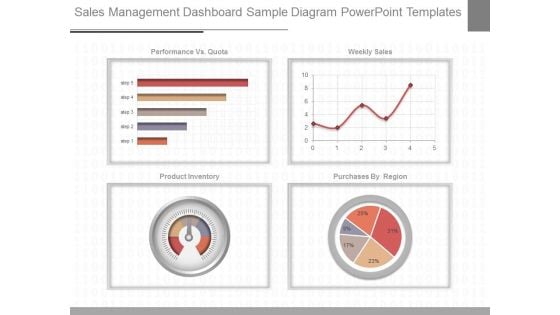
Sales Management Dashboard Sample Diagram Powerpoint Templates
This is a sales management dashboard sample diagram powerpoint templates. This is a four stage process. The stages in this process are performance vs quota, weekly sales, product inventory, purchases by region, step.
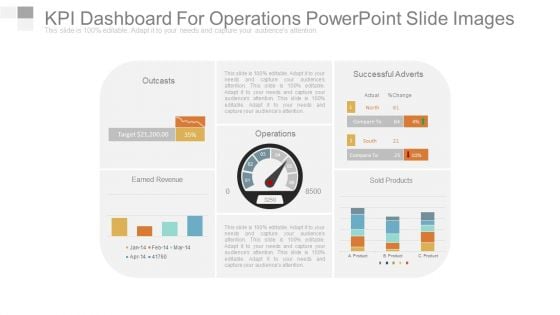
Kpi Dashboard For Operations Powerpoint Slide Images
This is a kpi dashboard for operations powerpoint slide images. This is a four stage process. The stages in this process are outcasts, earned revenue, operations, successful adverts, sold products.
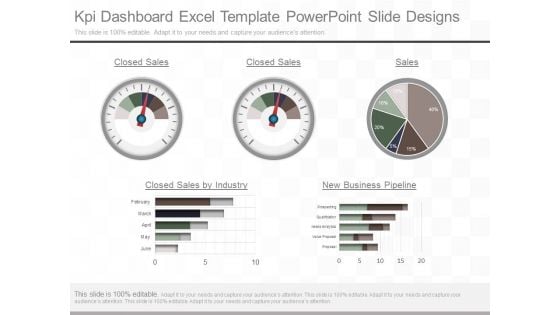
Kpi Dashboard Excel Template Powerpoint Slide Designs
This is a kpi dashboard excel template powerpoint slide designs. This is a five stage process. The stages in this process are closed sales, closed sales, sales, closed sales by industry, new business pipeline, february, march april, may, june, prospecting, qualification, needs analytics, value proposal, proposal.
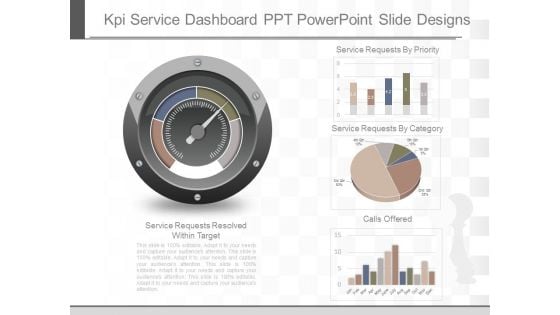
Kpi Service Dashboard Ppt Powerpoint Slide Designs
This is a kpi service dashboard ppt powerpoint slide designs. This is a four stage process. The stages in this process are service requests resolved within target, service requests by priority, service requests by category, calls offered, jan, feb, mar, apr, may, june, july, aug, sep, oct, nov, dec.
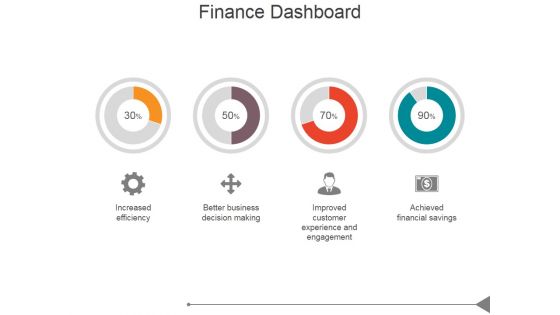
Finance Dashboard Ppt PowerPoint Presentation Diagrams
This is a finance dashboard ppt powerpoint presentation diagrams. This is a four stage process. The stages in this process are increased efficiency, better business decision making, improved customer experience and engagement, achieved financial savings.
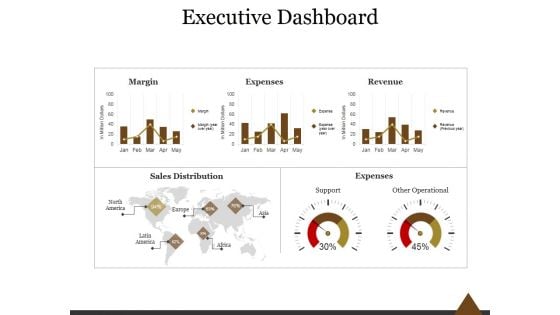
Executive Dashboard Ppt PowerPoint Presentation Professional
This is a executive dashboard ppt powerpoint presentation professional. This is a five stage process. The stages in this process are margin, expenses, revenue, sales distribution, expenses, support, other operational.

KPI Dashboard Showcasing Product Management Guidelines PDF
This slide showcases dashboard providing product development team performance status with determined KPIs. It provides details such as product development team score, average result scores and result KPIs. Pitch your topic with ease and precision using this KPI Dashboard Showcasing Product Management Guidelines PDF. This layout presents information on Average Rating, Innovation, Design. It is also available for immediate download and adjustment. So, changes can be made in the color, design, graphics or any other component to create a unique layout.
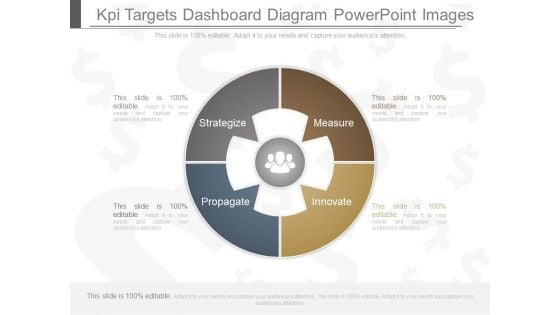
Kpi Targets Dashboard Diagram Powerpoint Images
This is a kpi targets dashboard diagram powerpoint images. This is a four stage process. The stages in this process are strategize, measure, propagate, innovate.
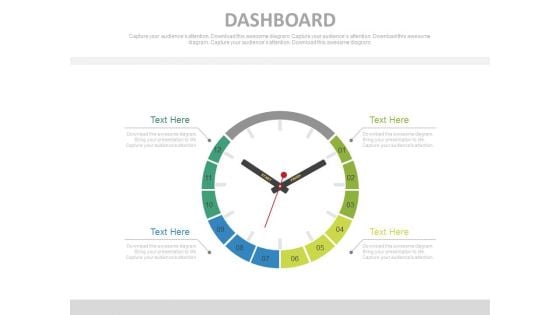
Clock Dashboard Design For Time Management Powerpoint Slides
This innovative, stunningly beautiful template has been designed with graphics of clock dashboard. It helps to portray concepts of time planning and management. This PowerPoint template helps to display your information in a useful, simple and orderly way.
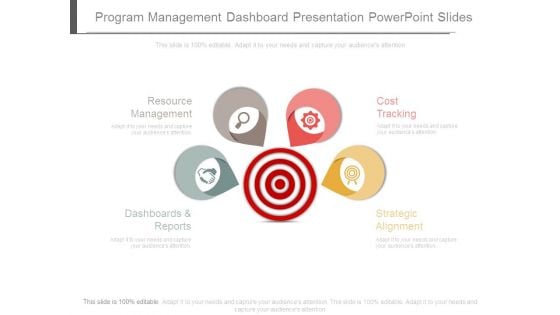
Program Management Dashboard Presentation Powerpoint Slides
This is a program management dashboard presentation powerpoint slides. This is a four stage process. The stages in this process are resource management, dashboards and reports, cost tracking, strategic alignment.
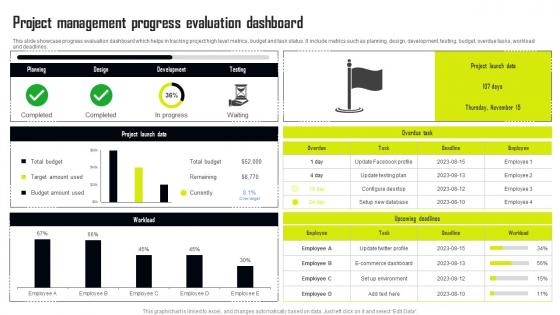
Project Management Progress Evaluation Dashboard Formats Pdf
This slide showcase progress evaluation dashboard which helps in tracking project high level metrics, budget and task status. It include metrics such as planning, design, development, testing, budget, overdue tasks, workload and deadlines. Pitch your topic with ease and precision using this Project Management Progress Evaluation Dashboard Formats Pdf This layout presents information on Planning, Design, Project Launch Data, Workload It is also available for immediate download and adjustment. So, changes can be made in the color, design, graphics or any other component to create a unique layout. This slide showcase progress evaluation dashboard which helps in tracking project high level metrics, budget and task status. It include metrics such as planning, design, development, testing, budget, overdue tasks, workload and deadlines.
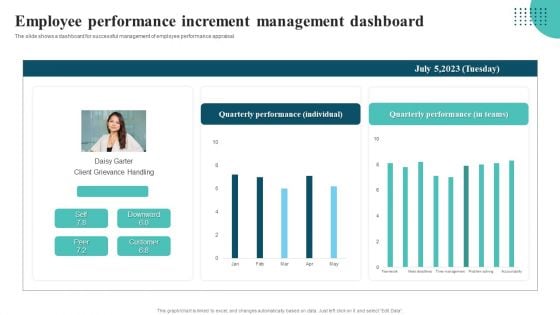
Employee Performance Increment Management Dashboard Summary PDF
The slide shows a dashboard for successful management of employee performance appraisal. Showcasing this set of slides titled Employee Performance Increment Management Dashboard Summary PDF. The topics addressed in these templates are Employee Performance Increment, Management Dashboard. All the content presented in this PPT design is completely editable. Download it and make adjustments in color, background, font etc. as per your unique business setting.
Sales Performance Evaluation Summary Dashboard Icons Pdf
This slide showcase Product sales performance summary dashboard to measure insights to ensure product success in marketplace. It includes elements such as total revenue, product sold, store orders, online orders, sales distribution etc.Showcasing this set of slides titled Sales Performance Evaluation Summary Dashboard Icons Pdf The topics addressed in these templates are Sales Distribution, Inventory Turnover Ratio, Order Comparison All the content presented in this PPT design is completely editable. Download it and make adjustments in color, background, font etc. as per your unique business setting. This slide showcase Product sales performance summary dashboard to measure insights to ensure product success in marketplace. It includes elements such as total revenue, product sold, store orders, online orders, sales distribution etc.
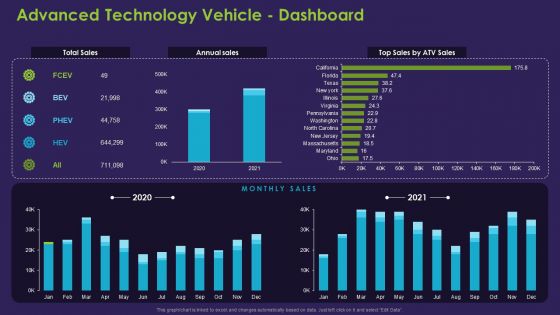
Advanced Technology Vehicle Dashboard Guidelines PDF
Deliver and pitch your topic in the best possible manner with this advanced technology vehicle dashboard guidelines pdf. Use them to share invaluable insights on advanced technology vehicle dashboard and impress your audience. This template can be altered and modified as per your expectations. So, grab it now.
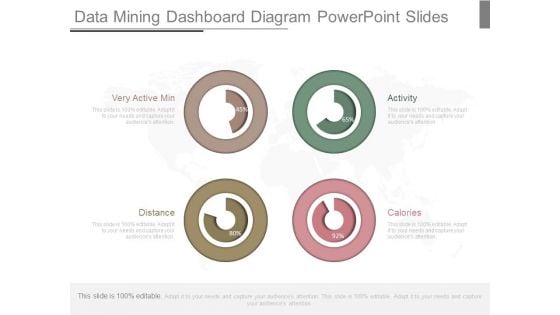
Data Mining Dashboard Diagram Powerpoint Slides
This is a data mining dashboard diagram powerpoint slides. This is a four stage process. The stages in this process are very active min, distance, calories, activity.
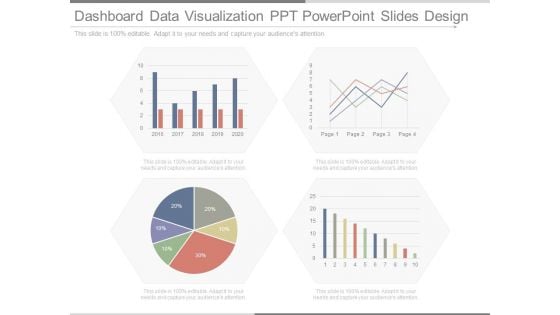
Dashboard Data Visualization Ppt Powerpoint Slides Design
This is a dashboard data visualization ppt powerpoint slides design. This is a four stage process. The stages in this process are business, presentation, success, marketing, finance.
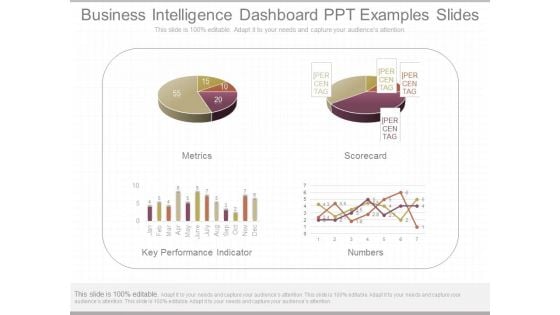
Business Intelligence Dashboard Ppt Examples Slides
This is a business intelligence dashboard ppt examples slides. This is a four stage process. The stages in this process are metrics, scorecard, key performance indicator, numbers.
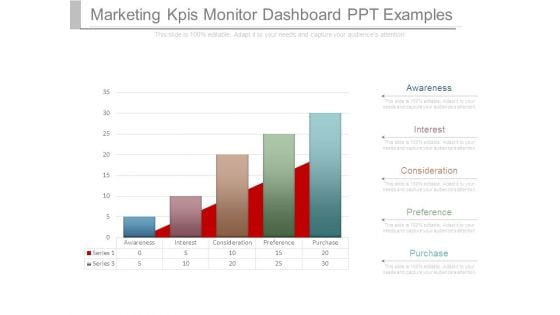
Marketing Kpis Monitor Dashboard Ppt Examples
This is a marketing kpis monitor dashboard ppt examples. This is a five stage process. The stages in this process are awareness, interest, consideration, preference, purchase.
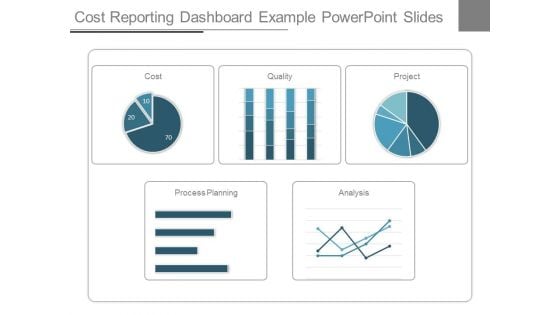
Cost Reporting Dashboard Example Powerpoint Slides
This is a cost reporting dashboard example powerpoint slides. This is a five stage process. The stages in this process are cost, quality, project, process planning, analysis.
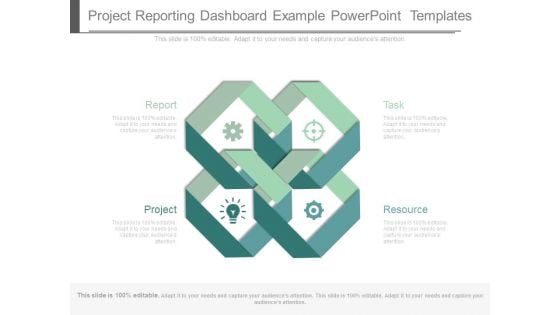
Project Reporting Dashboard Example Powerpoint Templates
This is a project reporting dashboard example powerpoint templates. This is a four stage process. The stages in this process are report, project, task, resource.
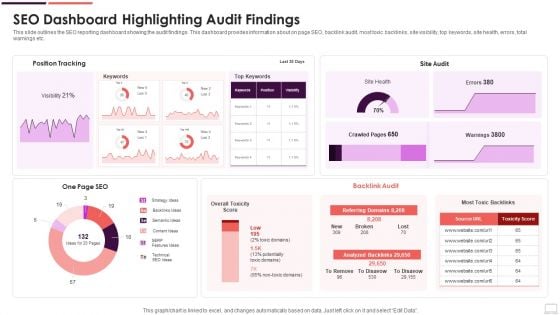
SEO Dashboard Highlighting Audit Findings Mockup PDF
This slide outlines the SEO reporting dashboard showing the audit findings. This dashboard provides information about on page SEO, backlink audit, most toxic backlinks, site visibility, top keywords, site health, errors, total warnings etc. Pitch your topic with ease and precision using this SEO Dashboard Highlighting Audit Findings Mockup PDF. This layout presents information on Strategy Ideas, Backlinks Ideas, Semantic Ideas. It is also available for immediate download and adjustment. So, changes can be made in the color, design, graphics or any other component to create a unique layout.
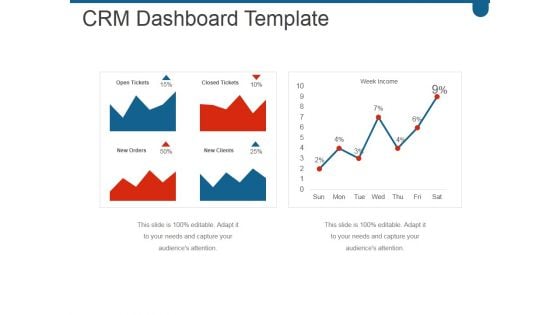
Crm Dashboard Template Ppt PowerPoint Presentation Graphics
This is a crm dashboard template ppt powerpoint presentation graphics. This is a two stage process. The stages in this process are business, marketing, success, growth, finance.
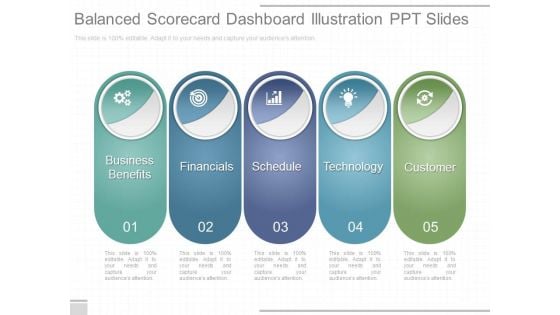
Balanced Scorecard Dashboard Illustration Ppt Slides
This is a balanced scorecard dashboard illustration ppt slides. This is a five stage process. The stages in this process are business benefits, financials, schedule, technology, customer.
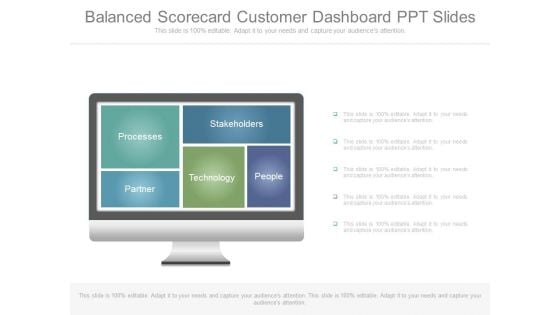
Balanced Scorecard Customer Dashboard Ppt Slides
This is a balanced scorecard customer dashboard ppt slides. This is a five stage process. The stages in this process are processes, partner, technology, stakeholders, people.
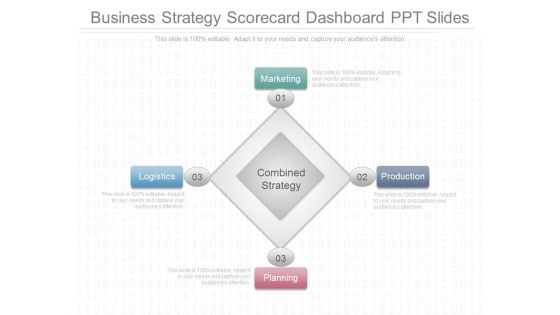
Business Strategy Scorecard Dashboard Ppt Slides
This is a business strategy scorecard dashboard ppt slides. This is a five stage process. The stages in this process are marketing, logistics, production, planning, combined strategy.
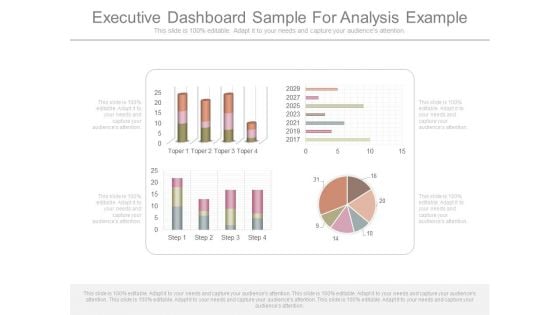
Executive Dashboard Sample For Analysis Example
This is a executive dashboard sample for analysis example. This is a four stage process. The stages in this process are topper, step.
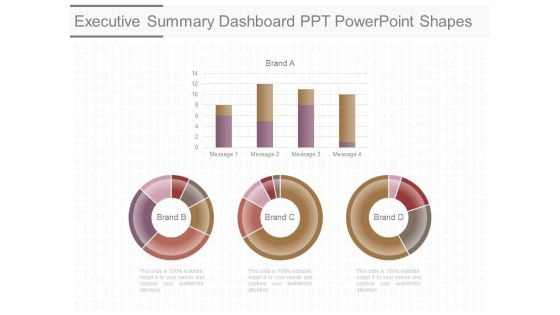
Executive Summary Dashboard Ppt Powerpoint Shapes
This is a executive summary dashboard ppt powerpoint shapes. This is a four stage process. The stages in this process are brand b, brand c, brand d.
Data Mining Monitoring Dashboard Icon Introduction PDF
Persuade your audience using this data mining monitoring dashboard icon introduction pdf . This PPT design covers four stages, thus making it a great tool to use. It also caters to a variety of topics including data mining monitoring dashboard icon . Download this PPT design now to present a convincing pitch that not only emphasizes the topic but also showcases your presentation skills.
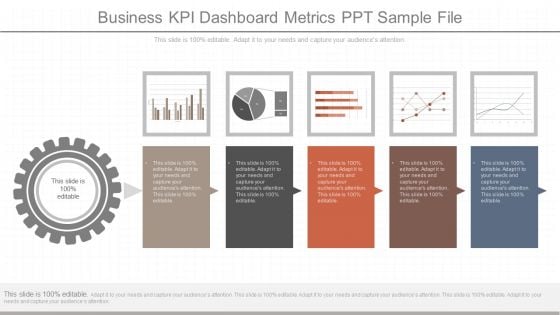
Business Kpi Dashboard Metrics Ppt Sample File
This is a business kpi dashboard metrics ppt sample file. This is a five stage process. The stages in this process are business, finance, management, success, marketing, presentation.

Devops Project Incident Administration Dashboard Diagrams PDF
This slide depicts developer operations DevOps project incident management dashboard. It provides information about after hour, daytime, escalation policy, escalations made, etc. Showcasing this set of slides titled Devops Project Incident Administration Dashboard Diagrams PDF. The topics addressed in these templates are Devops Project Incident, Administration Dashboard. All the content presented in this PPT design is completely editable. Download it and make adjustments in color, background, font etc. as per your unique business setting.
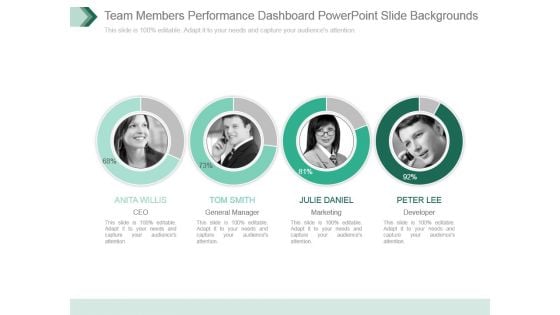
Team Members Performance Dashboard Powerpoint Slide Backgrounds
This is a team members performance dashboard powerpoint slide backgrounds. This is a four stage process. The stages in this process are ceo, general manager, marketing, developer.
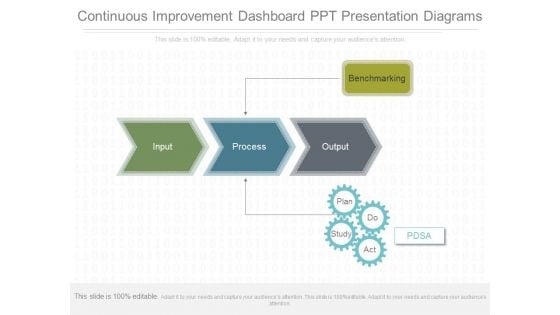
Continuous Improvement Dashboard Ppt Presentation Diagrams
This is a continuous improvement dashboard ppt presentation diagrams. This is a five stage process. The stages in this process are benchmarking, input, process, output, pdsa, plan, do, study, act.

WMS Implementation Inventory Management Dashboard Download PDF
The slide demonstrates information regarding the inventory management dashboard in order to track key activities. This is a wms implementation inventory management dashboard download pdf template with various stages. Focus and dispense information on wms implementation inventory management dashboard download pdf stages using this creative set, that comes with editable features. It contains large content boxes to add your information on topics like internal transfers, manufacturing, internal transfers. You can also showcase facts, figures, and other relevant content using this PPT layout. Grab it now.
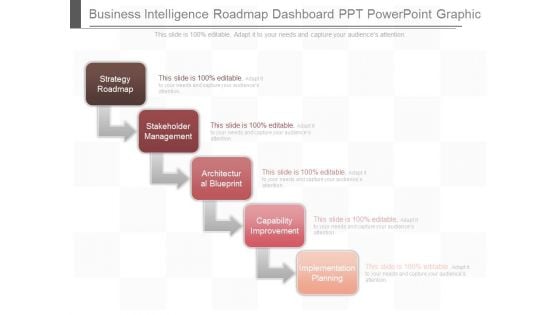
Business Intelligence Roadmap Dashboard Ppt Powerpoint Graphic
This is a business intelligence roadmap dashboard ppt powerpoint graphic. This is a five stage process. The stages in this process are strategy roadmap, stakeholder management, architectural blueprint, capability improvement, implementation planning.
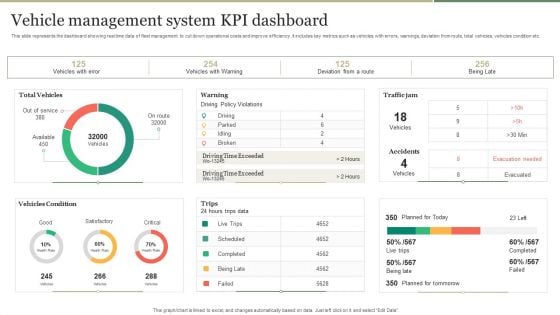
Vehicle Management System KPI Dashboard Introduction PDF
This slide represents the dashboard showing real time data of fleet management to cut down operational costs and improve efficiency. It includes key metrics such as vehicles with errors, warnings, deviation from route, total vehicles, vehicles condition etc. Pitch your topic with ease and precision using this Vehicle Management System KPI Dashboard Introduction PDF. This layout presents information on Vehicle Management System, KPI Dashboard. It is also available for immediate download and adjustment. So, changes can be made in the color, design, graphics or any other component to create a unique layout.
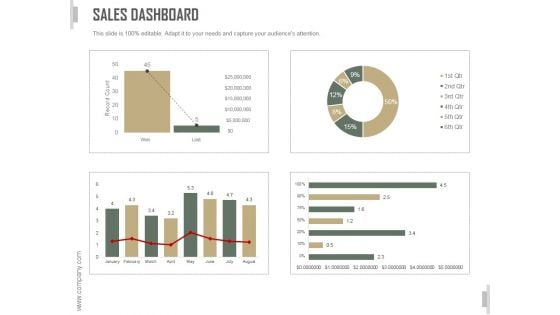
Sales Dashboard Slide Ppt PowerPoint Presentation Template
This is a sales dashboard slide ppt powerpoint presentation template. This is a three stage process. The stages in this process are business, strategy, marketing, analysis, bar graph, growth strategy.
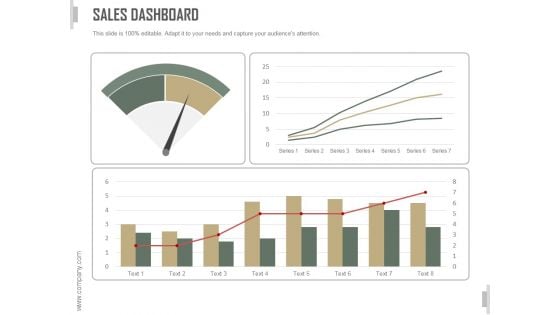
Sales Dashboard Ppt PowerPoint Presentation Design Templates
This is a sales dashboard ppt powerpoint presentation design templates. This is a four stage process. The stages in this process are business, strategy, marketing, analysis, bar graph, growth strategy.
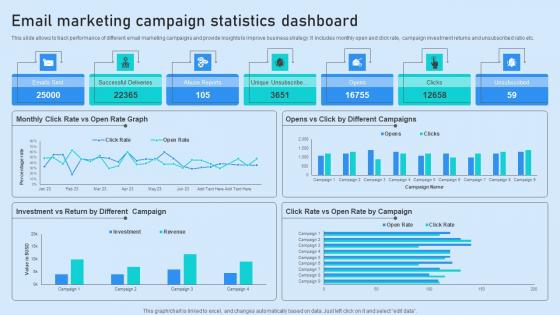
Email Marketing Campaign Statistics Dashboard Introduction Pdf
This slide allows to track performance of different email marketing campaigns and provide insights to improve business strategy. It includes monthly open and click rate, campaign investment returns and unsubscribed ratio etc. Showcasing this set of slides titled Email Marketing Campaign Statistics Dashboard Introduction Pdf. The topics addressed in these templates are Successful Deliveries, Abuse Reports, Unique Unsubscribe. All the content presented in this PPT design is completely editable. Download it and make adjustments in color, background, font etc. as per your unique business setting. This slide allows to track performance of different email marketing campaigns and provide insights to improve business strategy. It includes monthly open and click rate, campaign investment returns and unsubscribed ratio etc.

Monthly Product Sales Analysis Dashboard Infographics PDF
This slide illustrates a dashboard for product sales review to measure to help business monitor and improve productivity, employee engagement and meet revenue targets. It covers product names with sales reps, lead conversion, response time and outbound calls. Showcasing this set of slides titled Monthly Product Sales Analysis Dashboard Infographics PDF. The topics addressed in these templates are Lead Conversion Rate, Outbound Calls, Sales Analysis Dashboard. All the content presented in this PPT design is completely editable. Download it and make adjustments in color, background, font etc. as per your unique business setting.
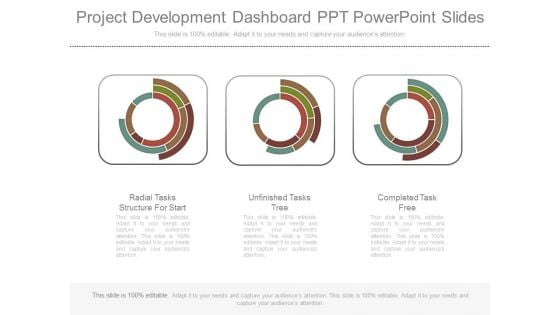
Project Development Dashboard Ppt Powerpoint Slides
This is a project development dashboard ppt powerpoint slides. This is a three stage process. The stages in this process are radial tasks structure for start, unfinished tasks tree, completed task free.
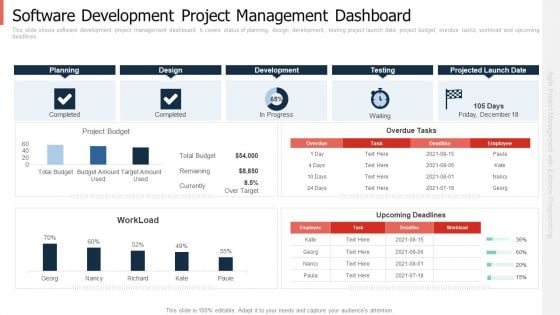
Software Development Project Management Dashboard Information PDF
This slide shows software development project management dashboard. It covers status of planning, design, development, testing project launch date, project budget, overdue tasks, workload and upcoming deadlines. Deliver an awe inspiring pitch with this creative software development project management dashboard information pdf bundle. Topics like budget, planning, development can be discussed with this completely editable template. It is available for immediate download depending on the needs and requirements of the user.
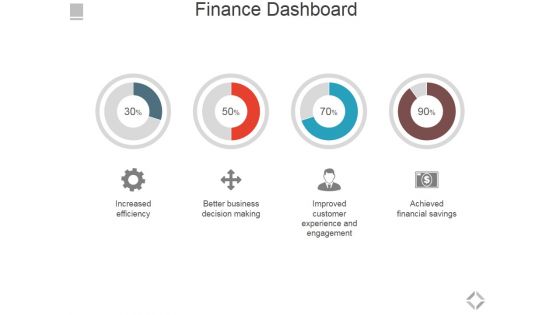
Finance Dashboard Ppt PowerPoint Presentation Layouts Infographics
This is a finance dashboard ppt powerpoint presentation layouts infographics. This is a four stage process. The stages in this process are increased efficiency, better business decision making, improved customer experience and engagement, achieved financial savings.

Agency Performance Dashboard Sample Of Ppt
This is a agency performance dashboard sample of ppt. This is a four stage process. The stages in this process are tra score, brand safety, view ability, ad fraud, industry snapshot.
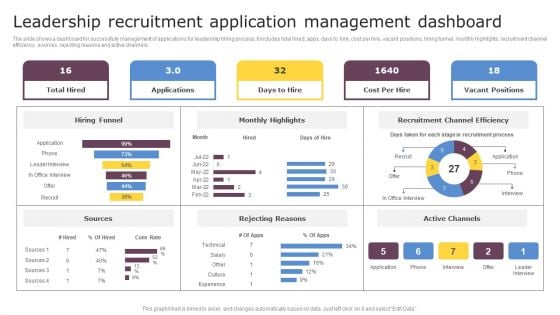
Leadership Recruitment Application Management Dashboard Introduction PDF
The slide shows a dashboard for successfully management of applications for leadership hiring process. It includes total hired, apps, days to hire, cost per hire, vacant positions, hiring funnel, monthly highlights, recruitment channel efficiency, sources, rejecting reasons and active channels. Showcasing this set of slides titled Leadership Recruitment Application Management Dashboard Introduction PDF. The topics addressed in these templates are Leadership Recruitment, Application Management Dashboard. All the content presented in this PPT design is completely editable. Download it and make adjustments in color, background, font etc. as per your unique business setting.

Customer Need Assessment Kpi Dashboard Infographics PDF
The following slide highlights the spas to assess customers changing needs and make strategies to improve. It consists of NPS, responses, weekly variations in needs, positive and negative feedback etc. Showcasing this set of slides titled customer need assessment kpi dashboard infographics pdf. The topics addressed in these templates are customer need assessment kpi dashboard. All the content presented in this PPT design is completely editable. Download it and make adjustments in color, background, font etc. as per your unique business setting.
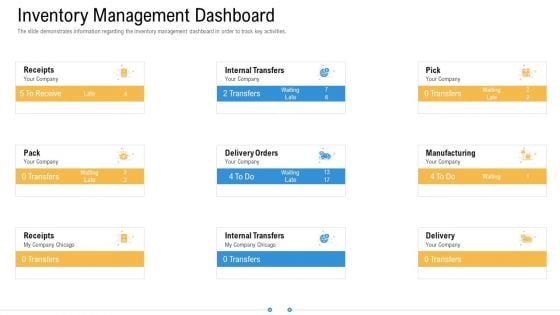
Storage Logistics Inventory Management Dashboard Infographics PDF
The slide demonstrates information regarding the inventory management dashboard in order to track key activities. Presenting storage logistics inventory management dashboard infographics pdf to provide visual cues and insights. Share and navigate important information on nine stages that need your due attention. This template can be used to pitch topics like manufacturing, internal transfers, internal transfers, delivery orders. In addtion, this PPT design contains high resolution images, graphics, etc, that are easily editable and available for immediate download.

 Home
Home