Kpi Comparison
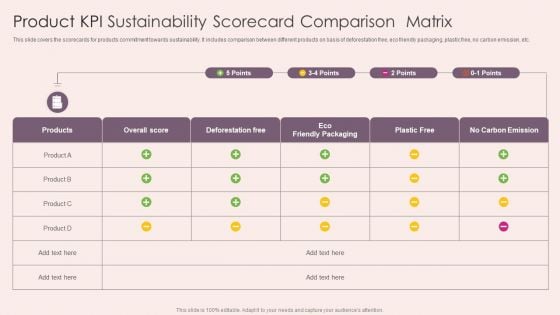
Product KPI Sustainability Scorecard Comparison Matrix Demonstration PDF
This slide covers the scorecards for products commitment towards sustainability. It includes comparison between different products on basis of deforestation free, eco friendly packaging, plastic free, no carbon emission, etc. Showcasing this set of slides titled Product KPI Sustainability Scorecard Comparison Matrix Demonstration PDF. The topics addressed in these templates are Product Kpi Sustainability, Scorecard Comparison Matrix. All the content presented in this PPT design is completely editable. Download it and make adjustments in color, background, font etc. as per your unique business setting.

Communication KPI Dashboard With KPI Comparison Ideas PDF
Pitch your topic with ease and precision using this Communication KPI Dashboard With KPI Comparison Ideas PDF This layout presents information on Increase In Brand, Employees Knowledge, Vision Statement It is also available for immediate download and adjustment. So, changes can be made in the color, design, graphics or any other component to create a unique layout.
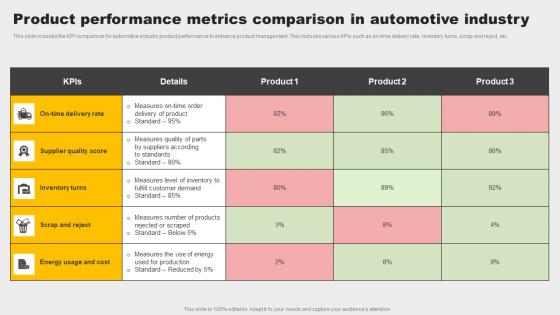
Product Performance Metrics Comparison In Automotive Industry Topics Pdf
This slide includes the KPI comparison for automotive industry product performance to enhance product management. This includes various KPIs such as on time delivery rate, inventory turns, scrap and reject, etc. Showcasing this set of slides titled Product Performance Metrics Comparison In Automotive Industry Topics Pdf. The topics addressed in these templates are Inventory Turns, Supplier Quality Score, Energy Usage And Cost. All the content presented in this PPT design is completely editable. Download it and make adjustments in color, background, font etc. as per your unique business setting. This slide includes the KPI comparison for automotive industry product performance to enhance product management. This includes various KPIs such as on time delivery rate, inventory turns, scrap and reject, etc.
Project Error Tracking KPI Dashboard Themes PDF
This slide illustrates the dashboard for the project issue tracking and management. It includes the column chart for issues assignee, incomplete issues by priority and project, monthly percentage increase in issues created and closed, etc. Pitch your topic with ease and precision using this Project Error Tracking KPI Dashboard Themes PDF. This layout presents information on Issues Assignee, Issue Status, Incomplete Issues. It is also available for immediate download and adjustment. So, changes can be made in the color, design, graphics or any other component to create a unique layout.
Catering Business Advertisement Plan KPI Dashboard With Revenue Comparison Icons PDF
This slide shows the KPI dashboard of the catering industry to evaluate the actual and potential targets. It includes KPIs such as expenditure, sales revenue, beverage, etc. Showcasing this set of slides titled Catering Business Advertisement Plan KPI Dashboard With Revenue Comparison Icons PDF. The topics addressed in these templates are Expenditure, Revenue Comparison, Department. All the content presented in this PPT design is completely editable. Download it and make adjustments in color, background, font etc. as per your unique business setting.
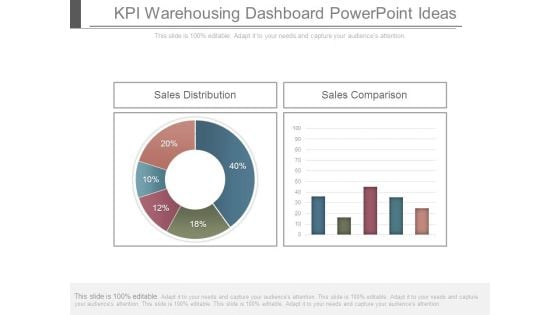
Kpi Warehousing Dashboard Powerpoint Ideas
This is a kpi warehousing dashboard powerpoint ideas. This is a two stage process. The stages in this process are sales distribution, sales comparison.
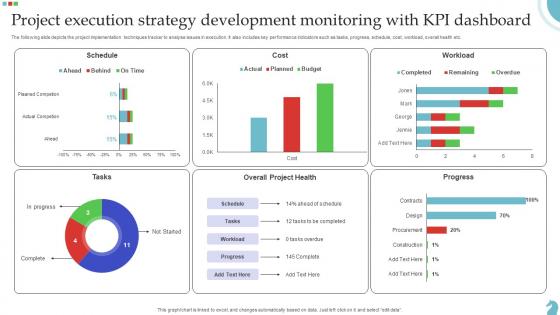
Project Execution Strategy Development Monitoring With Kpi Dashboard Download Pdf
The following slide depicts the project implementation techniques tracker to analyse issues in execution. It also includes key performance indicators such as tasks, progress, schedule, cost, workload, overall health etc. Pitch your topic with ease and precision using this Project Execution Strategy Development Monitoring With Kpi Dashboard Download Pdf. This layout presents information on Project Execution, Strategy Development, Monitoring Kpi Dashboard. It is also available for immediate download and adjustment. So, changes can be made in the color, design, graphics or any other component to create a unique layout. The following slide depicts the project implementation techniques tracker to analyse issues in execution. It also includes key performance indicators such as tasks, progress, schedule, cost, workload, overall health etc.
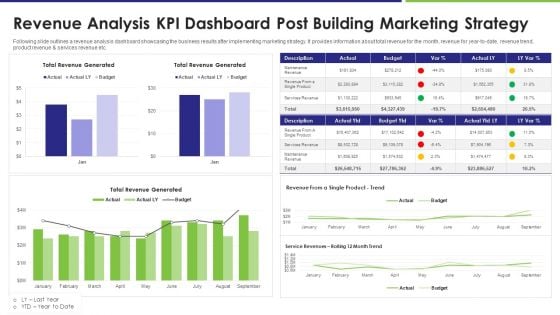
Revenue Analysis KPI Dashboard Post Building Marketing Strategy Infographics PDF
Following slide outlines a revenue analysis dashboard showcasing the business results after implementing marketing strategy. It provides information about total revenue for the month, revenue for year to date, revenue trend, product revenue and services revenue etc. Pitch your topic with ease and precision using this revenue analysis kpi dashboard post building marketing strategy infographics pdf. This layout presents information on revenue analysis kpi dashboard post building marketing strategy. It is also available for immediate download and adjustment. So, changes can be made in the color, design, graphics or any other component to create a unique layout.
Two Product KPI Attributes Comparison Scorecard Icon Formats PDF
Persuade your audience using this Two Product KPI Attributes Comparison Scorecard Icon Formats PDF. This PPT design covers four stages, thus making it a great tool to use. It also caters to a variety of topics including Product Kpi Attributes, Comparison Scorecard Icon. Download this PPT design now to present a convincing pitch that not only emphasizes the topic but also showcases your presentation skills.
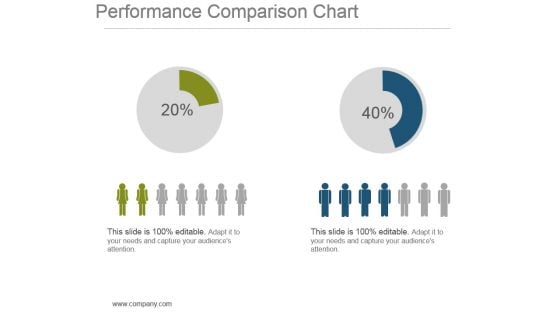
Performance Comparison Chart Powerpoint Show
This is a performance comparison chart powerpoint show. This is a two stage process. The stages in this process are finance, compare, strategy, management, planning.
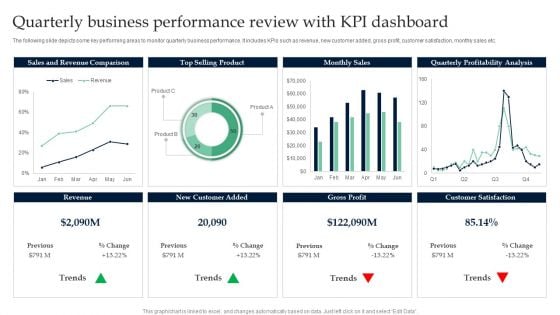
Quarterly Business Performance Review With KPI Dashboard Infographics PDF
Pitch your topic with ease and precision using this Quarterly Business Performance Review With KPI Dashboard Infographics PDF. This layout presents information on Sales And Revenue Comparison, Top Selling Product. It is also available for immediate download and adjustment. So, changes can be made in the color, design, graphics or any other component to create a unique layout.
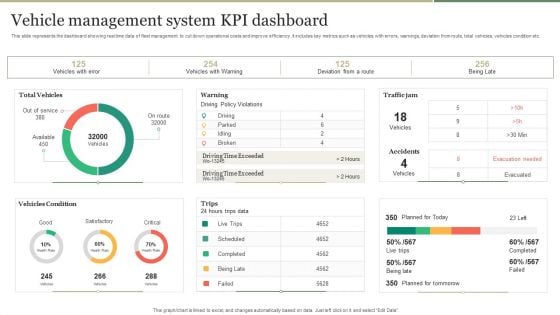
Vehicle Management System KPI Dashboard Introduction PDF
This slide represents the dashboard showing real time data of fleet management to cut down operational costs and improve efficiency. It includes key metrics such as vehicles with errors, warnings, deviation from route, total vehicles, vehicles condition etc. Pitch your topic with ease and precision using this Vehicle Management System KPI Dashboard Introduction PDF. This layout presents information on Vehicle Management System, KPI Dashboard. It is also available for immediate download and adjustment. So, changes can be made in the color, design, graphics or any other component to create a unique layout.
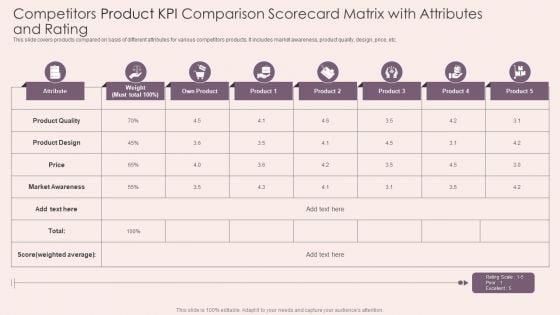
Competitors Product KPI Comparison Scorecard Matrix With Attributes And Rating Topics PDF
This slide covers products compared on basis of different attributes for various competitors products. It includes market awareness, product quality, design, price, etc. Showcasing this set of slides titled Competitors Product KPI Comparison Scorecard Matrix With Attributes And Rating Topics PDF. The topics addressed in these templates are Product Quality, Product Design, Price. All the content presented in this PPT design is completely editable. Download it and make adjustments in color, background, font etc. as per your unique business setting.
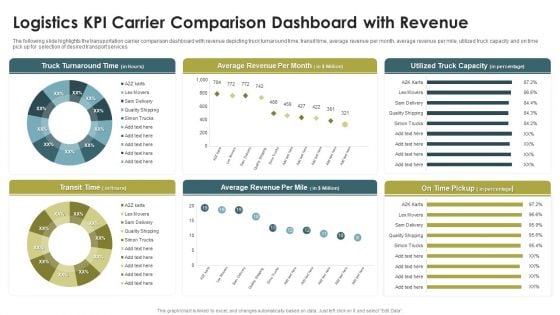
Logistics KPI Carrier Comparison Dashboard With Revenue Ppt Infographics Portfolio PDF
The following slide highlights the transportation carrier comparison dashboard with revenue depicting truck turnaround time, transit time, average revenue per month, average revenue per mile, utilized truck capacity and on time pick up for selection of desired transport services. Pitch your topic with ease and precision using this Logistics KPI Carrier Comparison Dashboard With Revenue Ppt Infographics Portfolio PDF. This layout presents information on Truck Turnaround Time, Average Revenue, Per Month, Transit Time. It is also available for immediate download and adjustment. So, changes can be made in the color, design, graphics or any other component to create a unique layout.

KPI Dashboard Of Customer And Product Sales Performance Comparison Information PDF
This slide shows the KPI dashboard of client and product sales comparison. It also includes sales by location and total sales. Pitch your topic with ease and precision using this KPI Dashboard Of Customer And Product Sales Performance Comparison Information PDF. This layout presents information on Product Sales, Client Sales, Tim Santana. It is also available for immediate download and adjustment. So, changes can be made in the color, design, graphics or any other component to create a unique layout.
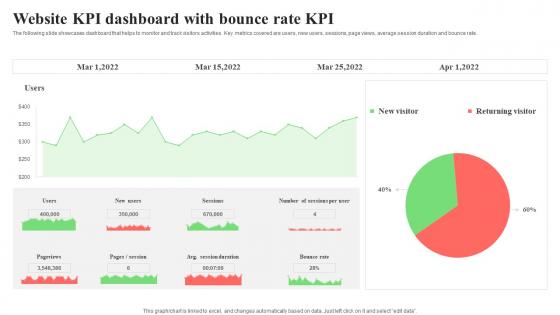
Website KPI Dashboard With Bounce Rate KPI Formats Pdf
The following slide showcases dashboard that helps to monitor and track visitors activities. Key metrics covered are users, new users, sessions, page views, average session duration and bounce rate. Pitch your topic with ease and precision using this Website KPI Dashboard With Bounce Rate KPI Formats Pdf. This layout presents information on Page Views, Average Session Duration, Bounce Rate. It is also available for immediate download and adjustment. So, changes can be made in the color, design, graphics or any other component to create a unique layout. The following slide showcases dashboard that helps to monitor and track visitors activities. Key metrics covered are users, new users, sessions, page views, average session duration and bounce rate.

Sales Employee Kpi Progress Evaluation Ideas Pdf
This slide showcase performance indicators for progress review which helps in improving employee engagement and achieving results faster. It include indicators such as number of sales, conversion rate, lead generation and client acquisition rate. Pitch your topic with ease and precision using this Sales Employee Kpi Progress Evaluation Ideas Pdf This layout presents information on Meeting Conversion Rate, Conversion Rate, Lead Generation It is also available for immediate download and adjustment. So, changes can be made in the color, design, graphics or any other component to create a unique layout. This slide showcase performance indicators for progress review which helps in improving employee engagement and achieving results faster. It include indicators such as number of sales, conversion rate, lead generation and client acquisition rate.

ITIL Incident Regulation Kpi Dashboard Background PDF
This slide covers ITIL problem management KPI dashboard to track status of problems. It involves KPI such as total number of incidents, problems, requests, average time to solve incidents.Pitch your topic with ease and precision using this ITIL Incident Regulation Kpi Dashboard Background PDF. This layout presents information on Active Problems, Average Incidents, Opened Problems. It is also available for immediate download and adjustment. So, changes can be made in the color, design, graphics or any other component to create a unique layout.
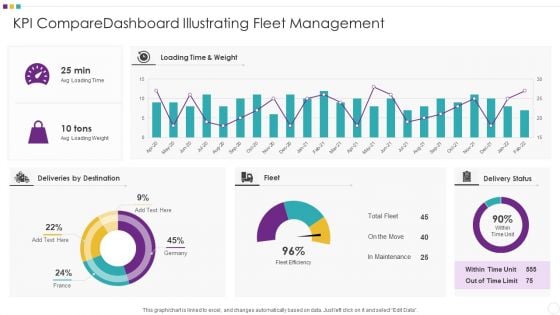
KPI Comparedashboard Illustrating Fleet Management Clipart PDF
Pitch your topic with ease and precision using this KPI Comparedashboard Illustrating Fleet Management Clipart PDF This layout presents information on KPI Comparedashboard Illustrating Fleet Management It is also available for immediate download and adjustment. So, changes can be made in the color, design, graphics or any other component to create a unique layout.
KPI Dashboard Of Client Support Icons PDF
This slide shows customer service delivery key performance indicators dashboard. It includes KPIs such as issues received, average time to close issues, first call resolution, top performers, etc. Pitch your topic with ease and precision using this KPI Dashboard Of Client Support Icons PDF. This layout presents information on KPI Dashboard, Client Support. It is also available for immediate download and adjustment. So, changes can be made in the color, design, graphics or any other component to create a unique layout.
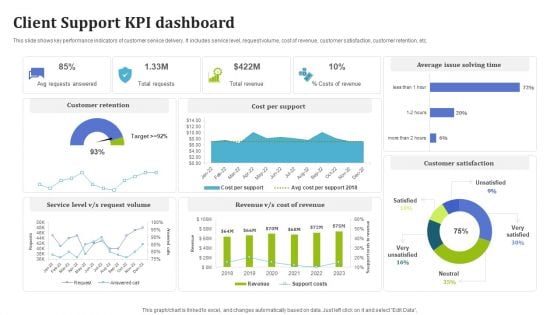
Client Support KPI Dashboard Rules PDF
This slide shows key performance indicators of customer service delivery. It includes service level, request volume, cost of revenue, customer satisfaction, customer retention, etc. Pitch your topic with ease and precision using this Client Support KPI Dashboard Rules PDF. This layout presents information on Customer Retention, Cost Per Support, Average Issue Solving Time. It is also available for immediate download and adjustment. So, changes can be made in the color, design, graphics or any other component to create a unique layout.
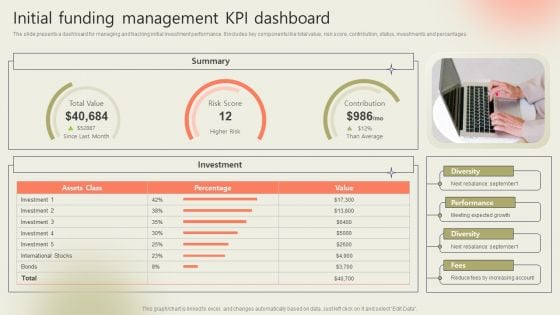
Initial Funding Management Kpi Dashboard Rules PDF
The slide presents a dashboard for managing and tracking initial investment performance. It includes key components like total value, risk score, contribution, status, investments and percentages. Pitch your topic with ease and precision using this Initial Funding Management Kpi Dashboard Rules PDF. This layout presents information on Performance, Diversity, Expected Growth. It is also available for immediate download and adjustment. So, changes can be made in the color, design, graphics or any other component to create a unique layout.

KPI Dashboard Showcasing Product Management Guidelines PDF
This slide showcases dashboard providing product development team performance status with determined KPIs. It provides details such as product development team score, average result scores and result KPIs. Pitch your topic with ease and precision using this KPI Dashboard Showcasing Product Management Guidelines PDF. This layout presents information on Average Rating, Innovation, Design. It is also available for immediate download and adjustment. So, changes can be made in the color, design, graphics or any other component to create a unique layout.

KPI Dashboard Highlighting Business Problems Microsoft PDF
This slide depicts a dashboard which highlights the problems faced by organizations to easily track the issues and offer solutions for the same. The various key performance indicators in this dashboard are pain points by status, unresolved pain points for march 2023 etc. Showcasing this set of slides titled KPI Dashboard Highlighting Business Problems Microsoft PDF. The topics addressed in these templates are Unresolved Pain Points, Resolved Pain Points, Project Components. All the content presented in this PPT design is completely editable. Download it and make adjustments in color, background, font etc. as per your unique business setting.
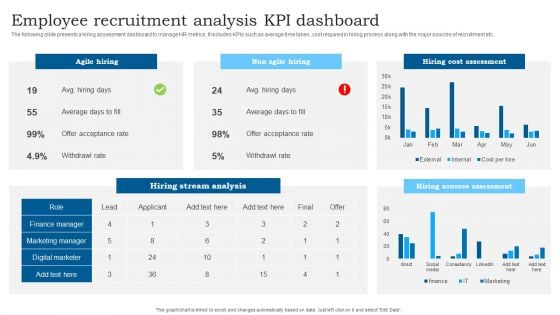
Employee Recruitment Analysis KPI Dashboard Slides PDF
The following slide presents a hiring assessment dashboard to manage HR metrics. It includes KPIs such as average time taken, cost required in hiring process along with the major sources of recruitment etc. Pitch your topic with ease and precision using this Employee Recruitment Analysis KPI Dashboard Slides PDF. This layout presents information on Agile Hiring, Non Agile Hiring, Hiring Cost Assessment. It is also available for immediate download and adjustment. So, changes can be made in the color, design, graphics or any other component to create a unique layout.
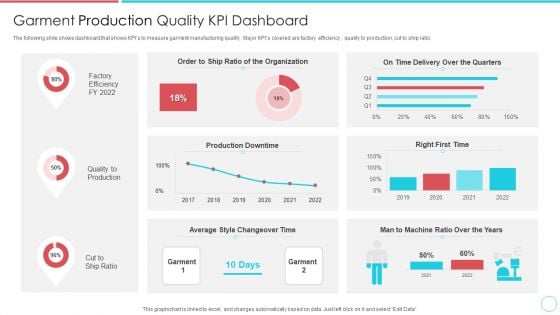
Garment Production Quality KPI Dashboard Portrait PDF
The following slide shows dashboard that shows KPIs to measure garment manufacturing quality . Major KPIs covered are factory efficiency , quality to production, cut to ship ratio.Pitch your topic with ease and precision using this Garment Production Quality KPI Dashboard Portrait PDF This layout presents information on Production Downtime, Time Delivery Over The Quarters, Average Style Changeover Time It is also available for immediate download and adjustment. So, changes can be made in the color, design, graphics or any other component to create a unique layout.
Tracking Goals Alignment KPI Dashboard Guidelines PDF
This slide showcases a tracking dashboard for determining the alignment and progress percentage of the assigned objectives. It also includes the objective evaluation KPIs such as active objectives, overall progress, total employees, objective as per employees, aligned, organizational and departmental objectives. Pitch your topic with ease and precision using this Tracking Goals Alignment KPI Dashboard Guidelines PDF. This layout presents information on Employee, Organizational Objectives, Departmental Objectives. It is also available for immediate download and adjustment. So, changes can be made in the color, design, graphics or any other component to create a unique layout.
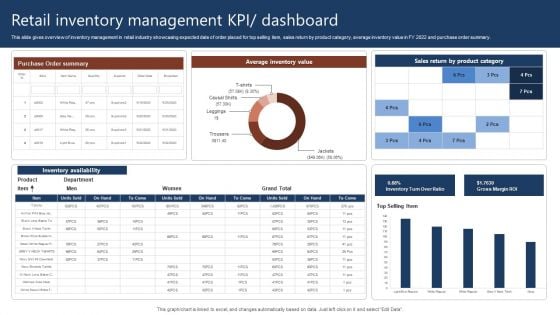
Retail Inventory Management Kpi Dashboard Rules PDF
This slide gives overview of inventory management in retail industry showcasing expected date of order placed for top selling item, sales return by product category, average inventory value in FY 2022 and purchase order summary. Pitch your topic with ease and precision using this Retail Inventory Management Kpi Dashboard Rules PDF. This layout presents information on Retail Inventory Management, Dashboard. It is also available for immediate download and adjustment. So, changes can be made in the color, design, graphics or any other component to create a unique layout.
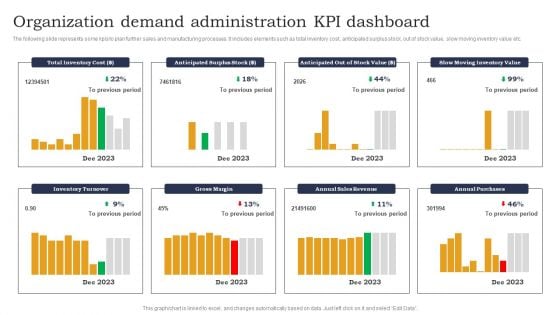
Organization Demand Administration KPI Dashboard Designs PDF
The following slide represents some kpis to plan further sales and manufacturing processes. It includes elements such as total inventory cost, anticipated surplus stock, out of stock value, slow moving inventory value etc. Pitch your topic with ease and precision using this Organization Demand Administration KPI Dashboard Designs PDF. This layout presents information on Anticipated Surplus Stock, Out Of Stock, Slow Moving Inventory. It is also available for immediate download and adjustment. So, changes can be made in the color, design, graphics or any other component to create a unique layout.
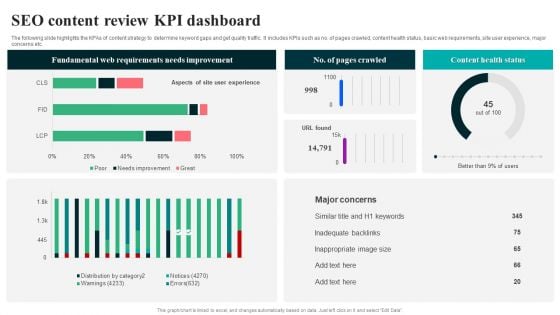
SEO Content Review KPI Dashboard Summary PDF
The following slide highlights the KPAs of content strategy to determine keyword gaps and get quality traffic. It includes KPIs such as no. of pages crawled, content health status, basic web requirements, site user experience, major concerns etc. Pitch your topic with ease and precision using this SEO Content Review KPI Dashboard Summary PDF. This layout presents information on Fundamental Web Requirements, Needs Improvement. It is also available for immediate download and adjustment. So, changes can be made in the color, design, graphics or any other component to create a unique layout.

Logistics KPI Status Dashboard With Monthly KPI Ppt Infographic Template Layout PDF
The following slide highlights the transportation status dashboard with monthly KPI illustrating order status with customer, order date and delivery date. It shows financial performance for four quarters as well as todays order, inventory and monthly KPI with Inventory, shipping cost for past 30 days. Pitch your topic with ease and precision using this Logistics KPI Status Dashboard With Monthly KPI Ppt Infographic Template Layout PDF. This layout presents information on Order Status, Today Order, Inventory, Monthly KPI. It is also available for immediate download and adjustment. So, changes can be made in the color, design, graphics or any other component to create a unique layout.
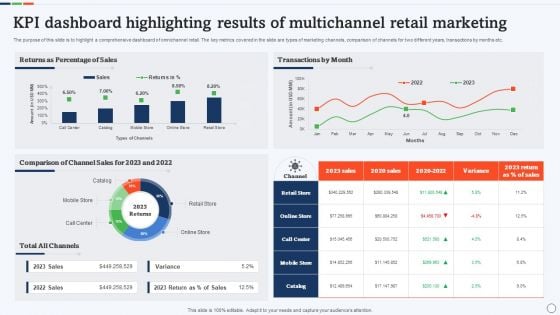
KPI Dashboard Highlighting Results Of Multichannel Retail Marketing Rules PDF
The purpose of this slide is to highlight a comprehensive dashboard of omnichannel retail. The key metrics covered in the slide are types of marketing channels, comparison of channels for two different years, transactions by months etc. Pitch your topic with ease and precision using this KPI Dashboard Highlighting Results Of Multichannel Retail Marketing Rules PDF. This layout presents information on Comparison Of Channel Sales, Percentage Of Sales, Transactions By Month. It is also available for immediate download and adjustment. So, changes can be made in the color, design, graphics or any other component to create a unique layout.

Commercial Marketing KPI With Accumulated Sales And Profit Portrait PDF
This slide template covers about key performing indicators like number of sales with revenue and profit generated in comparison with cost input and breakdown.Showcasing this set of slides titled Commercial Marketing KPI With Accumulated Sales And Profit Portrait PDF. The topics addressed in these templates are Cost Breakdown, Accumulated Revenue, Incremental Sales. All the content presented in this PPT design is completely editable. Download it and make adjustments in color, background, font etc. as per your unique business setting.
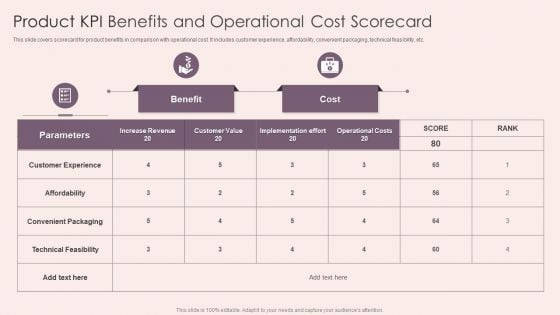
Product KPI Benefits And Operational Cost Scorecard Portrait PDF
This slide covers scorecard for product benefits in comparison with operational cost. It includes customer experience, affordability, convenient packaging, technical feasibility, etc. Pitch your topic with ease and precision using this Product KPI Benefits And Operational Cost Scorecard Portrait PDF. This layout presents information on Customer Experience, Technical Feasibility, Benefit. It is also available for immediate download and adjustment. So, changes can be made in the color, design, graphics or any other component to create a unique layout.
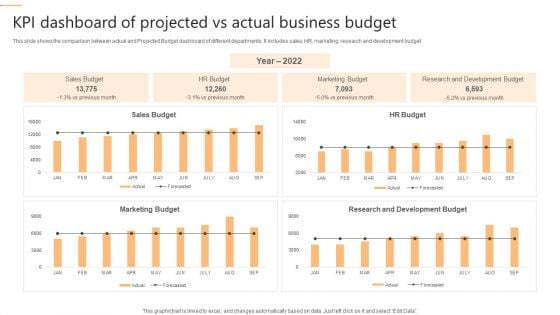
KPI Dashboard Of Projected Vs Actual Business Budget Pictures PDF
This slide shows the comparison between actual and Projected Budget dashboard of different departments. It includes sales, HR, marketing, research and development budget. Showcasing this set of slides titled KPI Dashboard Of Projected Vs Actual Business Budget Pictures PDF. The topics addressed in these templates are Marketing Budget, Development Budget, Sales Budget. All the content presented in this PPT design is completely editable. Download it and make adjustments in color, background, font etc. as per your unique business setting.
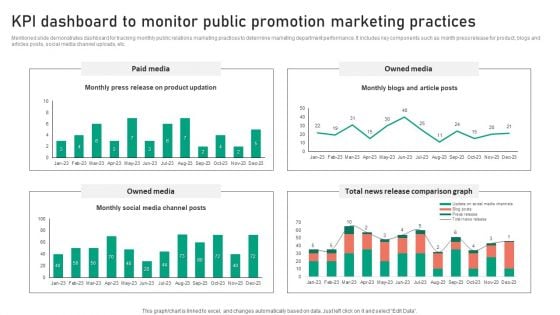
KPI Dashboard To Monitor Public Promotion Marketing Practices Template PDF
Mentioned slide demonstrates dashboard for tracking monthly public relations marketing practices to determine marketing department performance. It includes key components such as month press release for product, blogs and articles posts, social media channel uploads, etc. Pitch your topic with ease and precision using this KPI Dashboard To Monitor Public Promotion Marketing Practices Template PDF. This layout presents information on Paid Media, Owned Media, Total News Release, Comparison Graph. It is also available for immediate download and adjustment. So, changes can be made in the color, design, graphics or any other component to create a unique layout.
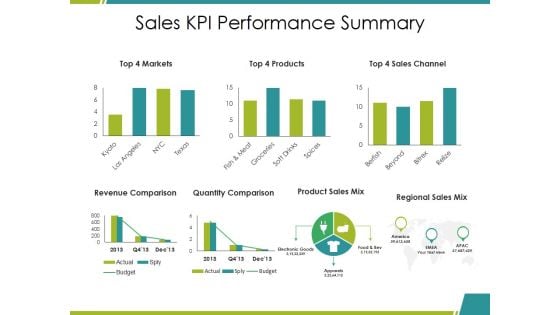
Sales Kpi Performance Summary Ppt PowerPoint Presentation Infographic Template Elements
This is a sales kpi performance summary ppt powerpoint presentation infographic template elements. This is a seven stage process. The stages in this process are revenue comparison, quantity comparison, product sales mix, regional sales mix, budget.

Sales Kpi Performance Summary Ppt PowerPoint Presentation Infographic Template Infographics
This is a sales kpi performance summary ppt powerpoint presentation infographic template infographics. This is a seven stage process. The stages in this process are revenue comparison, quantity comparison, product sales mix, regional sales mix.

Sales Kpi Performance Summary Ppt PowerPoint Presentation Ideas Graphics Template
This is a sales kpi performance summary ppt powerpoint presentation ideas graphics template. This is a seven stage process. The stages in this process are revenue comparison, quantity comparison, product sales mix, regional sales mix.
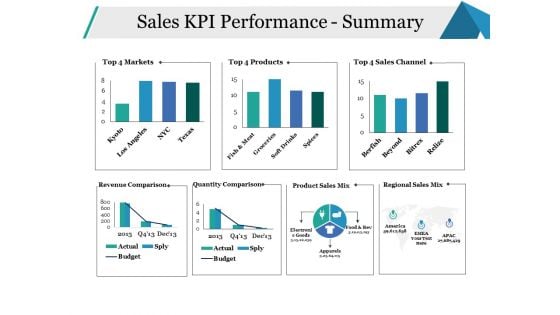
Sales KPI Performance Summary Ppt PowerPoint Presentation Infographics Model
This is a sales kpi performance summary ppt powerpoint presentation infographics model. This is a seven stage process. The stages in this process are sales channel, revenue comparison, quantity comparison, business, marketing.
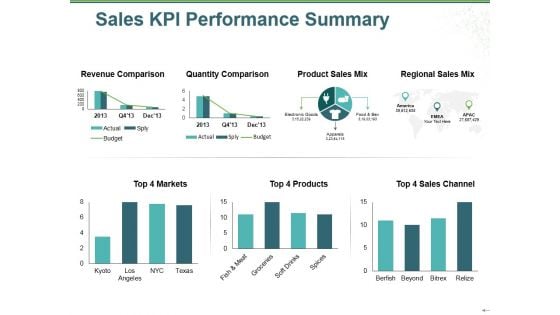
Sales Kpi Performance Summary Ppt PowerPoint Presentation Show Inspiration
This is a sales kpi performance summary ppt powerpoint presentation show inspiration. This is a two stage process. The stages in this process are revenue comparison, quantity comparison, product sales mix, regional sales mix, budget.

Sales Kpi Performance Summary Ppt PowerPoint Presentation Show Themes
This is a sales kpi performance summary ppt powerpoint presentation show themes. This is a three stage process. The stages in this process are revenue comparison, quantity comparison, product sales mix, markets, sales channel.
Digital Marketing Web Traffic Bounce Rate KPI Icon Structure Pdf
Pitch your topic with ease and precision using this Digital Marketing Web Traffic Bounce Rate KPI Icon Structure Pdf. This layout presents information on Digital Marketing, Web Traffic, Bounce Rate, KPI Icon. It is also available for immediate download and adjustment. So, changes can be made in the color, design, graphics or any other component to create a unique layout. Our Digital Marketing Web Traffic Bounce Rate KPI Icon Structure Pdf are topically designed to provide an attractive backdrop to any subject. Use them to look like a presentation pro.
Internet Security Kpi Icon With Monitor Summary Pdf
Pitch your topic with ease and precision using this Internet Security Kpi Icon With Monitor Summary Pdf This layout presents information on Internet Security KPI, Icon Monitor It is also available for immediate download and adjustment. So, changes can be made in the color, design, graphics or any other component to create a unique layout. Our Internet Security Kpi Icon With Monitor Summary Pdf are topically designed to provide an attractive backdrop to any subject. Use them to look like a presentation pro.
Learning And Improvement KPI Training Dashboard Icon Graphics Pdf
Pitch your topic with ease and precision using this Learning And Improvement KPI Training Dashboard Icon Graphics Pdf. This layout presents information on Learning And Improvement KPI, Training Dashboard Icon. It is also available for immediate download and adjustment. So, changes can be made in the color, design, graphics or any other component to create a unique layout. Our Learning And Improvement KPI Training Dashboard Icon Graphics Pdf are topically designed to provide an attractive backdrop to any subject. Use them to look like a presentation pro.

KPI Dashboard For Estimating Monthly Cash Flow Infographics Pdf
Following slide demonstrates KPI dashboard to forecast monthly business money flow for cash flow management planning. It includes components such as projected profit before tax, net operating cash flow, net financial cash flow, net investing cash flow, etc. Showcasing this set of slides titled KPI Dashboard For Estimating Monthly Cash Flow Infographics Pdf. The topics addressed in these templates are KPI Dashboard, Estimating Monthly Cash Flow, Net Financial Cash Flow. All the content presented in this PPT design is completely editable. Download it and make adjustments in color, background, font etc. as per your unique business setting. Following slide demonstrates KPI dashboard to forecast monthly business money flow for cash flow management planning. It includes components such as projected profit before tax, net operating cash flow, net financial cash flow, net investing cash flow, etc.
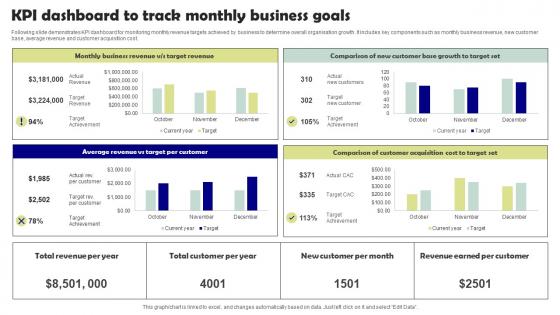
KPI Dashboard To Track Monthly Business Goals Microsoft Pdf
Following slide demonstrates KPI dashboard for monitoring monthly revenue targets achieved by business to determine overall organisation growth. It includes key components such as monthly business revenue, new customer base, average revenue and customer acquisition cost. Pitch your topic with ease and precision using this KPI Dashboard To Track Monthly Business Goals Microsoft Pdf. This layout presents information on Target Per Customer, Target Set. It is also available for immediate download and adjustment. So, changes can be made in the color, design, graphics or any other component to create a unique layout. Following slide demonstrates KPI dashboard for monitoring monthly revenue targets achieved by business to determine overall organisation growth. It includes key components such as monthly business revenue, new customer base, average revenue and customer acquisition cost.
KPI Dashboard For Tracking Policy Administration Progress Summary Pdf
Following slide demonstrates KPI dashboard to monitor business policies progress to improve organisation performance. It includes key component such as policies pending for review policy verification in process, expired policies, policy by control status, etc. Showcasing this set of slides titled KPI Dashboard For Tracking Policy Administration Progress Summary Pdf. The topics addressed in these templates are Process, Expired Policies, Policy Control Status. All the content presented in this PPT design is completely editable. Download it and make adjustments in color, background, font etc. as per your unique business setting. Following slide demonstrates KPI dashboard to monitor business policies progress to improve organisation performance. It includes key component such as policies pending for review policy verification in process, expired policies, policy by control status, etc.
Strategic Brand Management KPI Dashboard To Monitor Icons Pdf
Mentioned slide shows the KPI dashboard that can be used to track win and lost sales opportunities. It includes metrics namely won opportunities, lost opportunities, pipeline by territory, total opportunities. This Strategic Brand Management KPI Dashboard To Monitor Icons Pdf from Slidegeeks makes it easy to present information on your topic with precision. It provides customization options, so you can make changes to the colors, design, graphics, or any other component to create a unique layout. It is also available for immediate download, so you can begin using it right away. Slidegeeks has done good research to ensure that you have everything you need to make your presentation stand out. Make a name out there for a brilliant performance. Mentioned slide shows the KPI dashboard that can be used to track win and lost sales opportunities. It includes metrics namely won opportunities, lost opportunities, pipeline by territory, total opportunities.
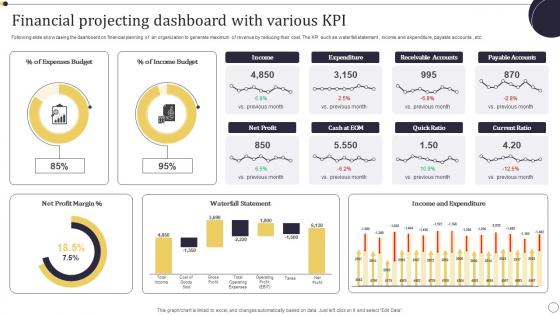
Financial Projecting Dashboard With Various KPI Themes Pdf
Following slide showcasing the dashboard on financial planning of an organization to generate maximum of revenue by reducing their cost. The KPI such as waterfall statement , income and expenditure, payable accounts , etc . Pitch your topic with ease and precision using this Financial Projecting Dashboard With Various KPI Themes Pdf. This layout presents information on Income Budget, Expenses Budget, Net Profit Margin. It is also available for immediate download and adjustment. So, changes can be made in the color, design, graphics or any other component to create a unique layout. Following slide showcasing the dashboard on financial planning of an organization to generate maximum of revenue by reducing their cost. The KPI such as waterfall statement , income and expenditure, payable accounts , etc .

Learning And Improvement KPI Activities For Workforce Dashboard Formats Pdf
This slide provides glimpse about statistics related to progress status of training activities for employees. It includes activities, current courses status, etc. Pitch your topic with ease and precision using this Learning And Improvement KPI Activities For Workforce Dashboard Formats Pdf. This layout presents information on Learning And Improvement KPI, Workforce Dashboard, Current Courses Status. It is also available for immediate download and adjustment. So, changes can be made in the color, design, graphics or any other component to create a unique layout. This slide provides glimpse about statistics related to progress status of training activities for employees. It includes activities, current courses status, etc.
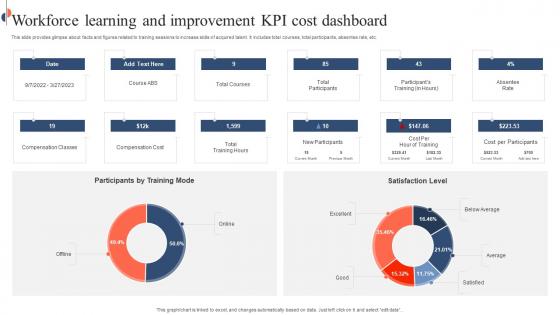
Workforce Learning And Improvement KPI Cost Dashboard Rules Pdf
This slide provides glimpse about facts and figures related to training sessions to increase skills of acquired talent. It includes total courses, total participants, absentee rate, etc. Pitch your topic with ease and precision using this Workforce Learning And Improvement KPI Cost Dashboard Rules Pdf. This layout presents information on Workforce Learning, Improvement KPI, Cost Dashboard. It is also available for immediate download and adjustment. So, changes can be made in the color, design, graphics or any other component to create a unique layout. This slide provides glimpse about facts and figures related to training sessions to increase skills of acquired talent. It includes total courses, total participants, absentee rate, etc.
Healthcare Project Management KPI Tracking Sheet Demonstration PDF
This slide depicts healthcare project management key performance indicators KPI tracking sheet. It contains information about KPI, details, progress, measurement and comments. Pitch your topic with ease and precision using this healthcare project management kpi tracking sheet demonstration pdf. This layout presents information on kpi, management, progress, cost, scope, measurement. It is also available for immediate download and adjustment. So, changes can be made in the color, design, graphics or any other component to create a unique layout.
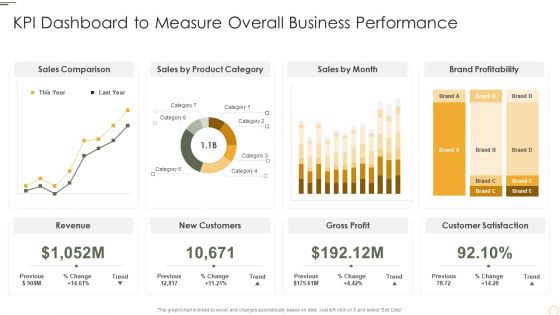
KPI Dashboard To Measure Overall Business Performance Themes PDF
Deliver and pitch your topic in the best possible manner with this KPI Dashboard To Measure Overall Business Performance Themes PDF. Use them to share invaluable insights on Sales Comparison, Product Category, Brand Profitability and impress your audience. This template can be altered and modified as per your expectations. So, grab it now.
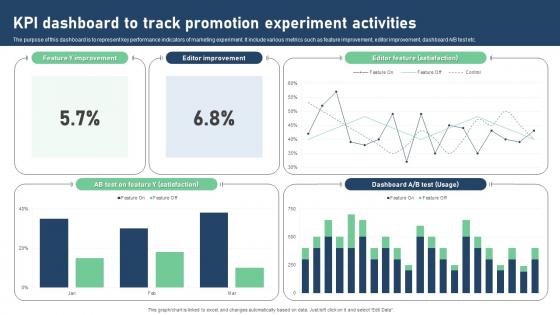
Kpi Dashboard To Track Promotion Experiment Activities Portrait Pdf
The purpose of this dashboard is to represent key performance indicators of marketing experiment. It include various metrics such as feature improvement, editor improvement, dashboard A or B test etc. Pitch your topic with ease and precision using this Kpi Dashboard To Track Promotion Experiment Activities Portrait Pdf. This layout presents information on KPI Dashboard, Track Promotion, Experiment Activities, Editor Improvement. It is also available for immediate download and adjustment. So, changes can be made in the color, design, graphics or any other component to create a unique layout. The purpose of this dashboard is to represent key performance indicators of marketing experiment. It include various metrics such as feature improvement, editor improvement, dashboard A or B test etc.
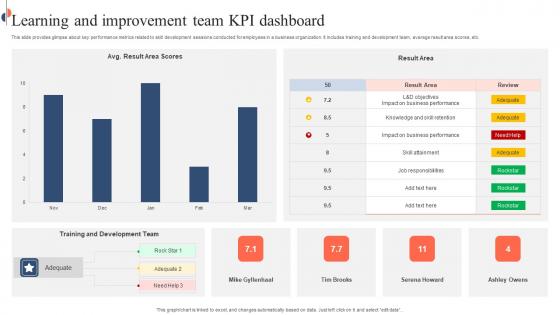
Learning And Improvement Team KPI Dashboard Slides Pdf
This slide provides glimpse about key performance metrics related to skill development sessions conducted for employees in a business organization. It includes training and development team, average result area scores, etc. Pitch your topic with ease and precision using this Learning And Improvement Team KPI Dashboard Slides Pdf. This layout presents information on Learning And Improvement Team, KPI Dashboard, Development Team. It is also available for immediate download and adjustment. So, changes can be made in the color, design, graphics or any other component to create a unique layout. This slide provides glimpse about key performance metrics related to skill development sessions conducted for employees in a business organization. It includes training and development team, average result area scores, etc.
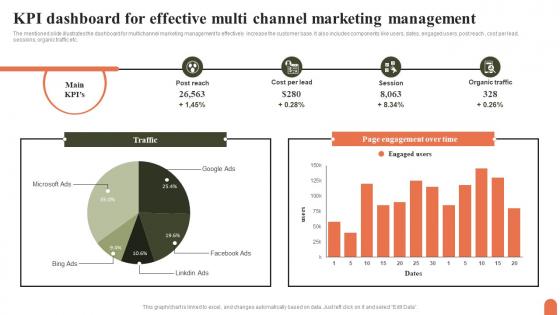
KPI Dashboard For Effective Multi Channel Marketing Management Topics Pdf
The mentioned slide illustrates the dashboard for multichannel marketing management to effectively increase the customer base. It also includes components like users, dates, engaged users, post reach , cost per lead, sessions, organic traffic etc. Showcasing this set of slides titled KPI Dashboard For Effective Multi Channel Marketing Management Topics Pdf. The topics addressed in these templates are KPI Dashboard, Effective Multi Channel, Marketing Management. All the content presented in this PPT design is completely editable. Download it and make adjustments in color, background, font etc. as per your unique business setting. The mentioned slide illustrates the dashboard for multichannel marketing management to effectively increase the customer base. It also includes components like users, dates, engaged users, post reach , cost per lead, sessions, organic traffic etc.
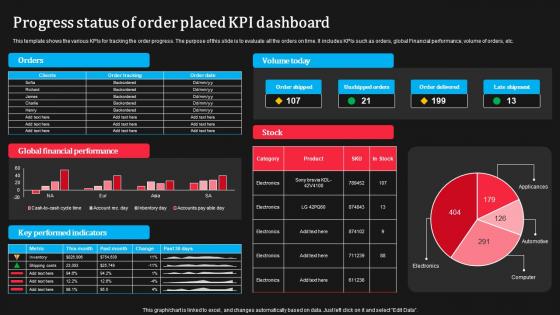
Progress Status Of Order Placed KPI Dashboard Sample Pdf
This template shows the various KPIs for tracking the order progress. The purpose of this slide is to evaluate all the orders on time. It includes KPIs such as orders, global Financial performance, volume of orders, etc.Pitch your topic with ease and precision using this Progress Status Of Order Placed KPI Dashboard Sample Pdf This layout presents information on Progress Status, Order Placed, KPI Dashboard It is also available for immediate download and adjustment. So, changes can be made in the color, design, graphics or any other component to create a unique layout. This template shows the various KPIs for tracking the order progress. The purpose of this slide is to evaluate all the orders on time. It includes KPIs such as orders, global Financial performance, volume of orders, etc.
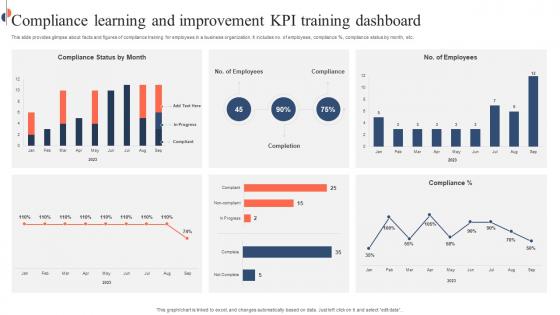
Compliance Learning And Improvement KPI Training Dashboard Sample Pdf
This slide provides glimpse about facts and figures of compliance training for employees in a business organization. It includes no. of employees, compliance percent, compliance status by month, etc. Pitch your topic with ease and precision using this Compliance Learning And Improvement KPI Training Dashboard Sample Pdf. This layout presents information on Compliance Learning, Improvement KPI, Training Dashboard, Compliance Training. It is also available for immediate download and adjustment. So, changes can be made in the color, design, graphics or any other component to create a unique layout. This slide provides glimpse about facts and figures of compliance training for employees in a business organization. It includes no. of employees, compliance percent, compliance status by month, etc.
Bounce Rate KPI Ppt PowerPoint Presentation Complete Deck With Slides

 Home
Home