Kpi Success
Marketing Success Metrics Website Landing Page Kpi Tracking Dashboard Elements PDF
This slide covers a dashboard for analysing the metrics of the website landing page. It includes kpis such as conversions, conversion rate, sessions, bounce rate, engagement sickness, etc. From laying roadmaps to briefing everything in detail, our templates are perfect for you. You can set the stage with your presentation slides. All you have to do is download these easy-to-edit and customizable templates. Marketing Success Metrics Website Landing Page Kpi Tracking Dashboard Elements PDF will help you deliver an outstanding performance that everyone would remember and praise you for. Do download this presentation today.
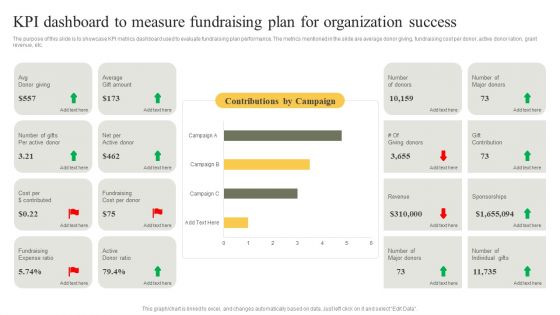
KPI Dashboard To Measure Fundraising Plan For Organization Success Infographics PDF
The purpose of this slide is to showcase KPI metrics dashboard used to evaluate fundraising plan performance. The metrics mentioned in the slide are average donor giving, fundraising cost per donor, active donor ration, grant revenue, etc. Showcasing this set of slides titled KPI Dashboard To Measure Fundraising Plan For Organization Success Infographics PDF. The topics addressed in these templates are Fundraising Cost, Average, Ratio. All the content presented in this PPT design is completely editable. Download it and make adjustments in color, background, font etc. as per your unique business setting.
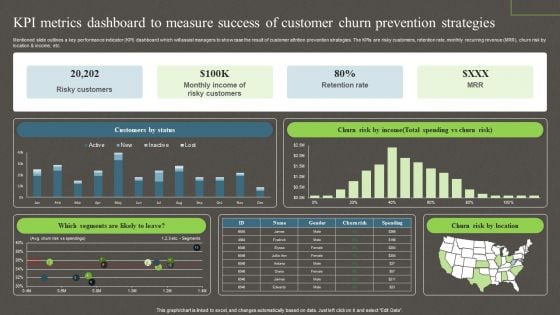
Kpi Metrics Dashboard To Measure Success Of Customer Churn Prevention Strategies Ppt PowerPoint Presentation File Model PDF
Mentioned slide outlines a key performance indicator KPI dashboard which will assist managers to showcase the result of customer attrition prevention strategies. The KPIs are risky customers, retention rate, monthly recurring revenue MRR, churn risk by location and income, etc. This Kpi Metrics Dashboard To Measure Success Of Customer Churn Prevention Strategies Ppt PowerPoint Presentation File Model PDF from Slidegeeks makes it easy to present information on your topic with precision. It provides customization options, so you can make changes to the colors, design, graphics, or any other component to create a unique layout. It is also available for immediate download, so you can begin using it right away. Slidegeeks has done good research to ensure that you have everything you need to make your presentation stand out. Make a name out there for a brilliant performance.
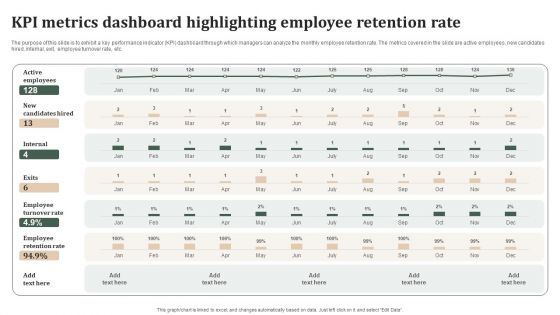
Successful Staff Retention Techniques KPI Metrics Dashboard Highlighting Employee Retention Rate Pictures PDF
The purpose of this slide is to exhibit a key performance indicator KPI dashboard through which managers can analyze the monthly employee retention rate. The metrics covered in the slide are active employees, new candidates hired, internal, exit, employee turnover rate, etc. Make sure to capture your audiences attention in your business displays with our gratis customizable Successful Staff Retention Techniques KPI Metrics Dashboard Highlighting Employee Retention Rate Pictures PDF. These are great for business strategies, office conferences, capital raising or task suggestions. If you desire to acquire more customers for your tech business and ensure they stay satisfied, create your own sales presentation with these plain slides.
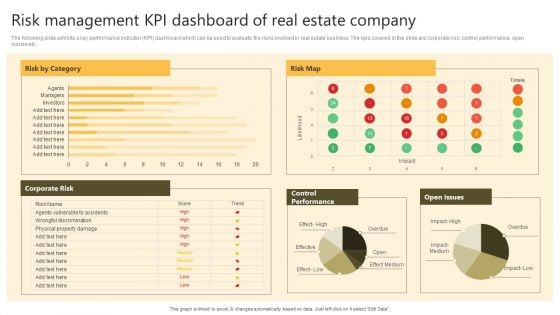
Successful Risk Administration Risk Management Kpi Dashboard Of Real Estate Company Template PDF
The following slide exhibits a key performance indicator KPI dashboard which can be used to evaluate the risks involved in real estate business. The kpis covered in the slide are corporate risk, control performance, open issues etc. This Successful Risk Administration Risk Management Kpi Dashboard Of Real Estate Company Template PDF is perfect for any presentation, be it in front of clients or colleagues. It is a versatile and stylish solution for organizing your meetings. The Successful Risk Administration Risk Management Kpi Dashboard Of Real Estate Company Template PDF features a modern design for your presentation meetings. The adjustable and customizable slides provide unlimited possibilities for acing up your presentation. Slidegeeks has done all the homework before launching the product for you. So, do not wait, grab the presentation templates today.
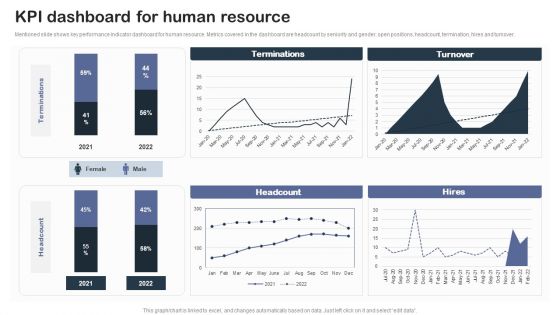
Staff Succession Planning And Development Strategy Kpi Dashboard For Human Clipart PDF
Mentioned slide shows key performance indicator dashboard for human resource. Metrics covered in the dashboard are headcount by seniority and gender, open positions, headcount, termination, hires and turnover.If your project calls for a presentation, then Slidegeeks is your go-to partner because we have professionally designed, easy-to-edit templates that are perfect for any presentation. After downloading, you can easily edit Staff Succession Planning And Development Strategy Kpi Dashboard For Human Clipart PDF and make the changes accordingly. You can rearrange slides or fill them with different images. Check out all the handy templates.
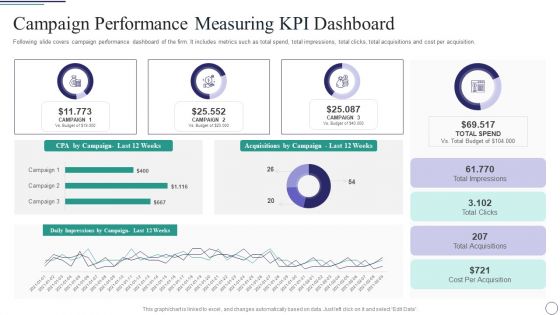
Successful Brand Development Plan Campaign Performance Measuring KPI Dashboard Portrait PDF
Following slide covers campaign performance dashboard of the firm. It includes metrics such as total spend, total impressions, total clicks, total acquisitions and cost per acquisition.Deliver an awe inspiring pitch with this creative successful brand development plan campaign performance measuring kpi dashboard portrait pdf bundle. Topics like campaign performance measuring kpi dashboard can be discussed with this completely editable template. It is available for immediate download depending on the needs and requirements of the user.
Successful Brand Development Plan Business Performance Measuring KPI Dashboard Icons PDF
Following slide covers business performance dashboard of the firm. It include KPIs such as average weekly sales revenue, above sales target, sales revenue and profit generated.Deliver and pitch your topic in the best possible manner with this successful brand development plan business performance measuring kpi dashboard icons pdf Use them to share invaluable insights on average revenue, customer lifetime value, customer acquisition cost and impress your audience. This template can be altered and modified as per your expectations. So, grab it now.
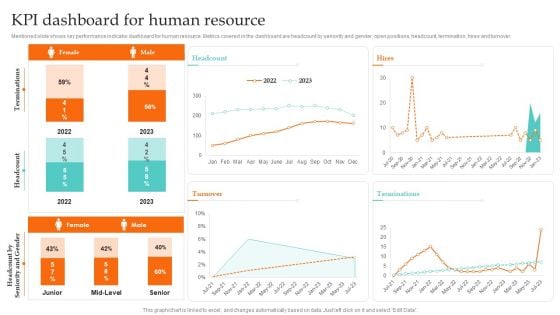
Kpi Dashboard For Human Resource Ultimate Guide To Employee Succession Planning Topics PDF
Mentioned slide shows key performance indicator dashboard for human resource. Metrics covered in the dashboard are headcount by seniority and gender, open positions, headcount, termination, hires and turnover.Present like a pro with Kpi Dashboard For Human Resource Ultimate Guide To Employee Succession Planning Topics PDF Create beautiful presentations together with your team, using our easy-to-use presentation slides. Share your ideas in real-time and make changes on the fly by downloading our templates. So whether you are in the office, on the go, or in a remote location, you can stay in sync with your team and present your ideas with confidence. With Slidegeeks presentation got a whole lot easier. Grab these presentations today.
Kpi Tracker Ppt Slides
This is a kpi tracker ppt slides. This is a three stage process. The stages in this process are total calls attempted, successful, no answer, call busy, disconnected, wrong number, unavailable, not interested, demo booked.

Engineering Kpi Examples Ppt Slides
This is an engineering kpi examples ppt slides. This is a four stage process. The stages in this process are strategize, innovate, measure, propagate.
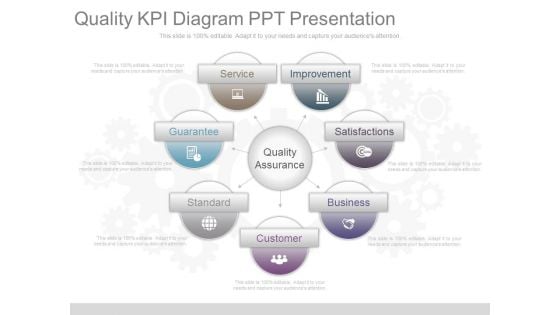
Quality Kpi Diagram Ppt Presentation
This is a quality kpi diagram ppt presentation. This is a seven stage process. The stages in this process are improvement, satisfactions, business, customer, standard, guarantee, service, quality assurance.
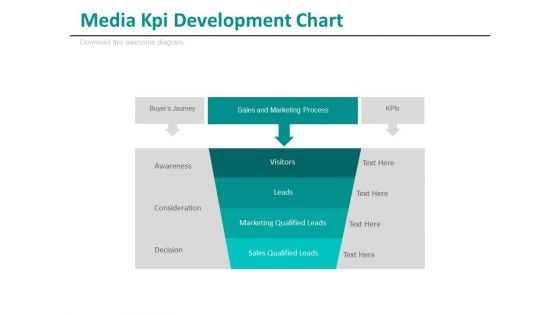
Media Kpi Development Chart Ppt Slides
This is a media KPI development chart ppt slides. This is a one stage process. The stages in this process are business, media, success.
Kpi Tracking Software Services Ppt Powerpoint Graphics
This is a kpi tracking software services ppt powerpoint graphics. This is a three stage process. The stages in this process are operations, revenue, manufacturing.

Revenue Kpi Dashboard Ppt Infographic Template
This is a revenue kpi dashboard ppt infographic template. This is a five stage process. The stages in this process are outcasts, successful adverts, earned revenue, sold products, operations.
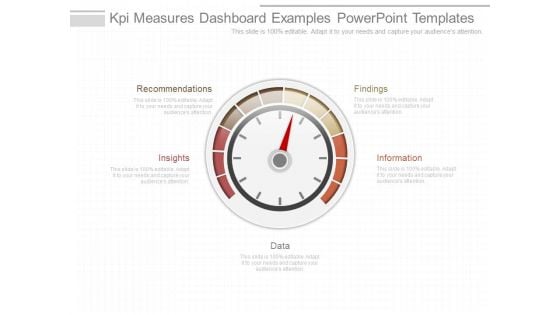
Kpi Measures Dashboard Examples Powerpoint Templates
This is a kpi measures dashboard examples powerpoint templates. This is a four stage process. The stages in this process are recommendations, insights, data, information, findings.
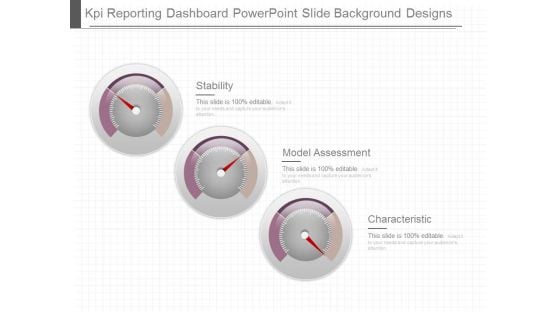
Kpi Reporting Dashboard Powerpoint Slide Background Designs
This is a kpi reporting dashboard powerpoint slide background designs. This is a three stage process. The stages in this process are stability, model assessment, characteristic.
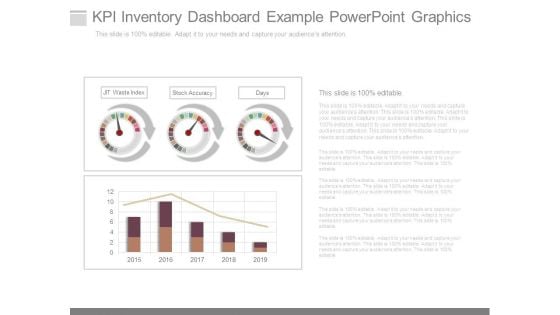
Kpi Inventory Dashboard Example Powerpoint Graphics
This is a kpi inventory dashboard example powerpoint graphics. This is a three stage process. The stages in this process are jit waste index, stock accuracy, days.
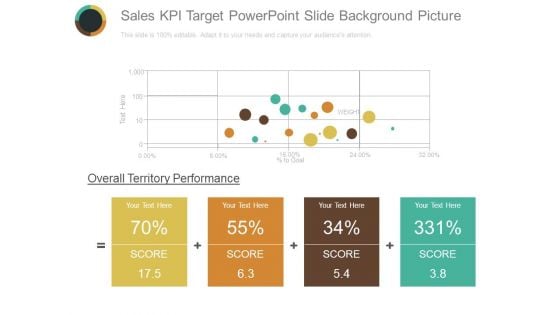
Sales Kpi Target Powerpoint Slide Background Picture
This is a sales kpi target powerpoint slide background picture. This is a four stage process. The stages in this process are business, management, marketing, finance, strategy.
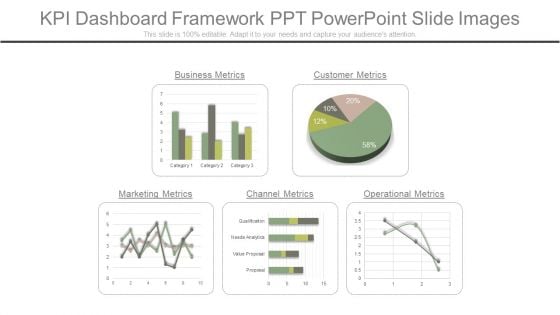
Kpi Dashboard Framework Ppt Powerpoint Slide Images
This is a kpi dashboard framework ppt powerpoint slide images. This is a five stage process. The stages in this process are business metrics, customer metrics, operational metrics, channel metrics, marketing metrics.
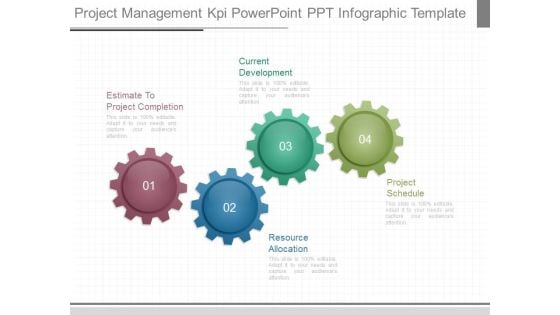
Project Management Kpi Powerpoint Ppt Infographic Template
This is a project management kpi powerpoint ppt infographic template. This is a four stage process. The stages in this process are estimate to project completion, resource allocation, current development, project schedule.
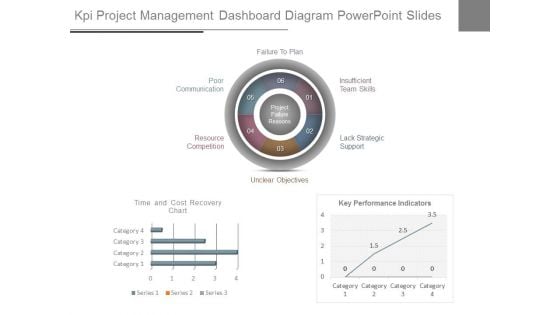
Kpi Project Management Dashboard Diagram Powerpoint Slides
This is a kpi project management dashboard diagram powerpoint slides. This is a three stage process. The stages in this process are unclear objectives, resource competition, poor communication, failure to plan, insufficient team skills, lack strategic support.
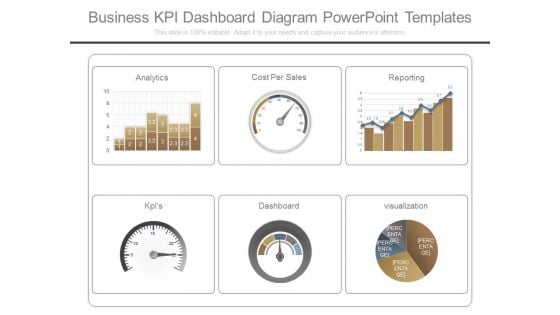
Business Kpi Dashboard Diagram Powerpoint Templates
This is a business kpi dashboard diagram powerpoint templates. This is a six stage process. The stages in this process are analytics, cost per sales, reporting, kpis, dashboard, visualization.
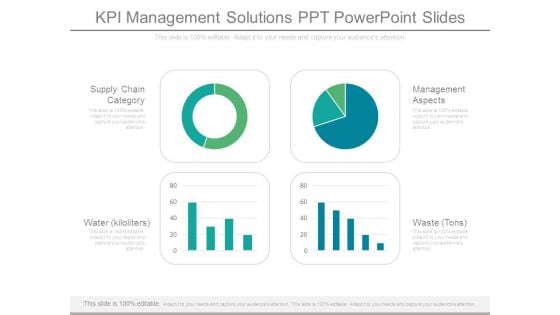
Kpi Management Solutions Ppt Powerpoint Slides
This is a kpi management solutions ppt powerpoint slides. This is a four stage process. The stages in this process are supply chain category, water kiloliters, waste tons, management aspects.
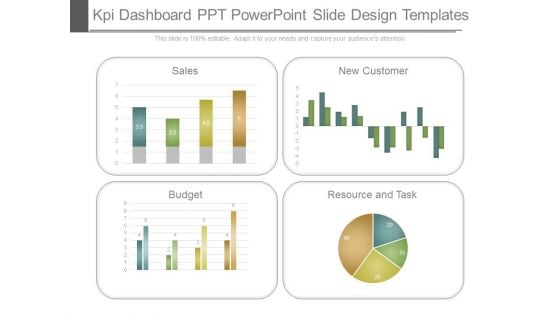
Kpi Dashboard Ppt Powerpoint Slide Design Templates
This is a kpi dashboard ppt powerpoint slide design templates. This is a four stage process. The stages in this process are sales, new customer, budget, resource and task.
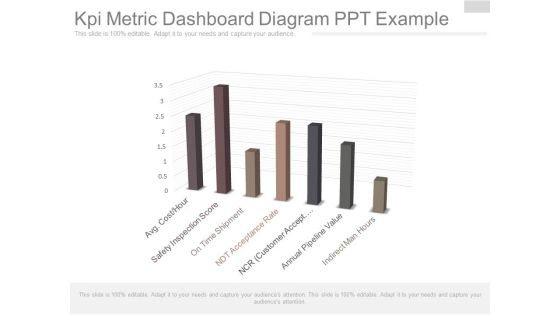
Kpi Metric Dashboard Diagram Ppt Example
This is a kpi metric dashboard diagram ppt example. This is a seven stage process. The stages in this process are avg cost hour, safety inspection score, on time shipment, ndt acceptance rate, ncr customer accept, annual pipeline value, indirect man hours.
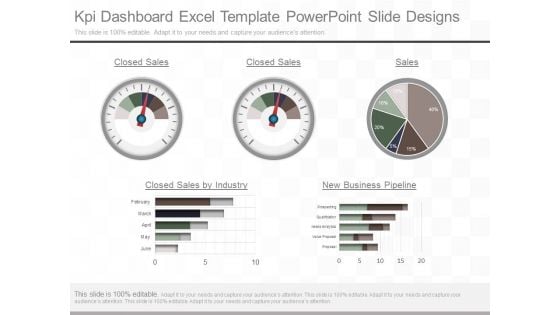
Kpi Dashboard Excel Template Powerpoint Slide Designs
This is a kpi dashboard excel template powerpoint slide designs. This is a five stage process. The stages in this process are closed sales, closed sales, sales, closed sales by industry, new business pipeline, february, march april, may, june, prospecting, qualification, needs analytics, value proposal, proposal.
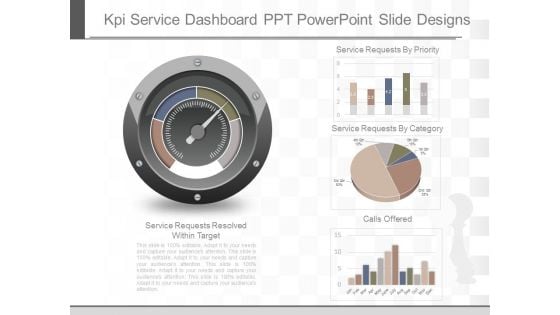
Kpi Service Dashboard Ppt Powerpoint Slide Designs
This is a kpi service dashboard ppt powerpoint slide designs. This is a four stage process. The stages in this process are service requests resolved within target, service requests by priority, service requests by category, calls offered, jan, feb, mar, apr, may, june, july, aug, sep, oct, nov, dec.
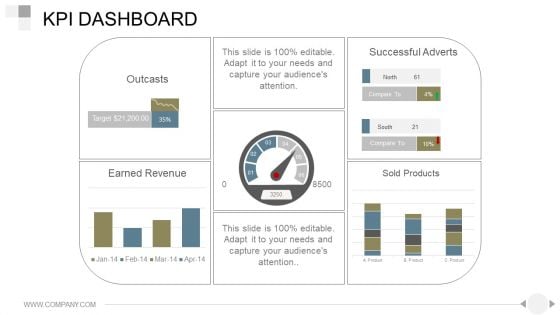
Kpi Dashboard Ppt PowerPoint Presentation Good
This is a kpi dashboard ppt powerpoint presentation good. This is a one stage process. The stages in this process are outcasts, earned revenue, successful adverts, sold products.
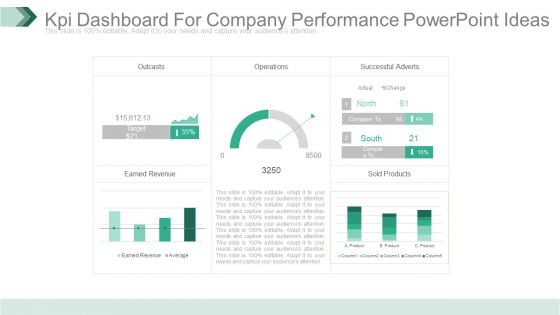
Kpi Dashboard For Company Performance Powerpoint Ideas
This is a kpi dashboard for company performance powerpoint ideas. This is a five stage process. The stages in this process are outcasts, operations, successful adverts, earned revenue, sold products.
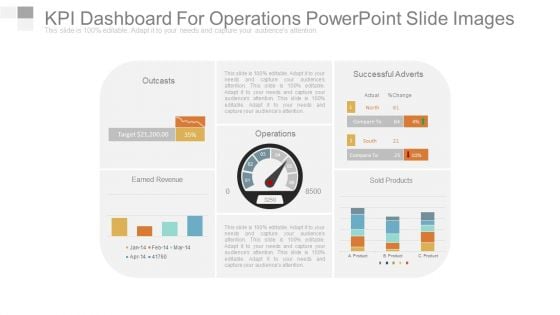
Kpi Dashboard For Operations Powerpoint Slide Images
This is a kpi dashboard for operations powerpoint slide images. This is a four stage process. The stages in this process are outcasts, earned revenue, operations, successful adverts, sold products.
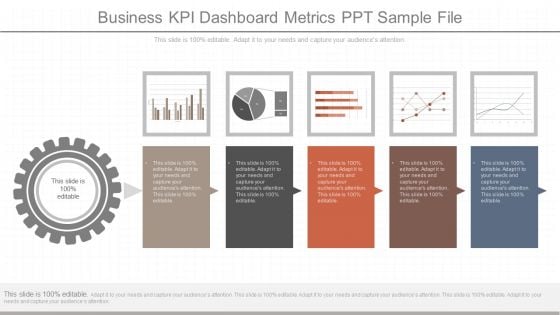
Business Kpi Dashboard Metrics Ppt Sample File
This is a business kpi dashboard metrics ppt sample file. This is a five stage process. The stages in this process are business, finance, management, success, marketing, presentation.
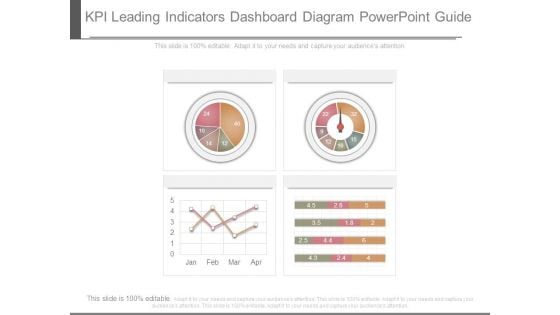
Kpi Leading Indicators Dashboard Diagram Powerpoint Guide
This is a kpi leading indicators dashboard diagram powerpoint guide. This is a four stage process. The stages in this process are business, success, process.
Team Skills Kpi Tracker Ppt Examples Professional
This is a team skills kpi tracker ppt examples professional. This is a three stage process. The stages in this process are disconnected, demo booked, wrong number, unavailable, call busy, no answer, disconnected, successful.
Kpi Tracker For Customer Calls Powerpoint Images
This is a kpi tracker for customer calls powerpoint images. This is a three stage process. The stages in this process are successful, no answer, call busy, disconnected, wrong number, unavailable, disconnected, demo booked.
Team Kpi Tracker Ppt PowerPoint Presentation Good
This is a team kpi tracker ppt powerpoint presentation good. This is a three stage process. The stages in this process are successful, no answer, call busy, disconnected, wrong number, unavailable, not interested, demo booked.
Team Kpi Tracker Ppt PowerPoint Presentation Templates
This is a team kpi tracker ppt powerpoint presentation templates. This is a eight stage process. The stages in this process are no answer, successful, call busy, disconnected, wrong number, demo booked.
Team Performance Kpi Tracker Powerpoint Slide Templates
This is a team performance kpi tracker powerpoint slide templates. This is a eight stage process. The stages in this process are successful, no answer, call busy, disconnected, wrong number, unavailable, disconnected, demo booked.

Sales Employee Kpi Progress Evaluation Ideas Pdf
This slide showcase performance indicators for progress review which helps in improving employee engagement and achieving results faster. It include indicators such as number of sales, conversion rate, lead generation and client acquisition rate. Pitch your topic with ease and precision using this Sales Employee Kpi Progress Evaluation Ideas Pdf This layout presents information on Meeting Conversion Rate, Conversion Rate, Lead Generation It is also available for immediate download and adjustment. So, changes can be made in the color, design, graphics or any other component to create a unique layout. This slide showcase performance indicators for progress review which helps in improving employee engagement and achieving results faster. It include indicators such as number of sales, conversion rate, lead generation and client acquisition rate.
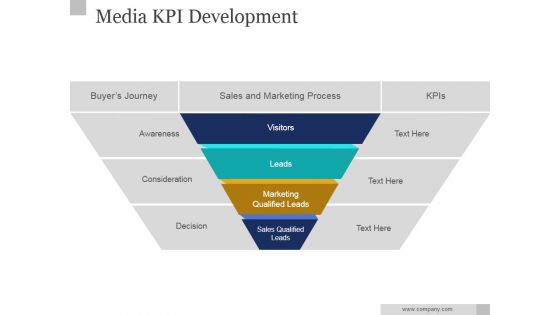
Media KPI Development Ppt PowerPoint Presentation Clipart
This is a media kpi development ppt powerpoint presentation clipart. This is a four stage process. The stages in this process are visitors, leads, consideration, decision, awareness.
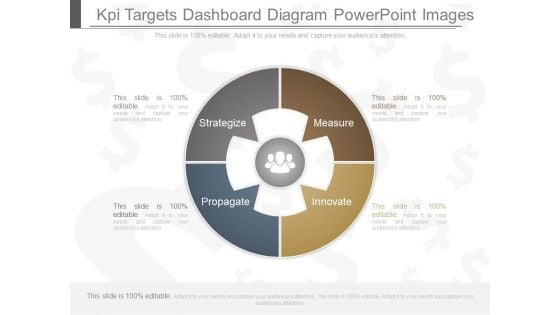
Kpi Targets Dashboard Diagram Powerpoint Images
This is a kpi targets dashboard diagram powerpoint images. This is a four stage process. The stages in this process are strategize, measure, propagate, innovate.
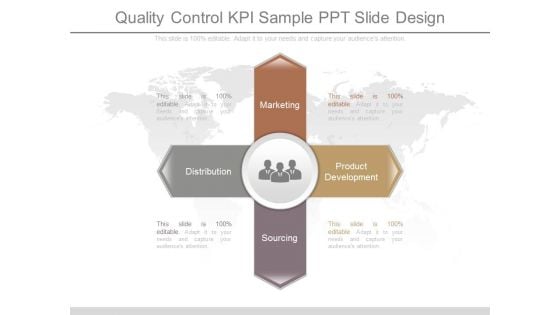
Quality Control Kpi Sample Ppt Slide Design
This is a quality control kpi sample ppt slide design. This is a four stage process. The stages in this process are marketing, distribution, product development, sourcing.
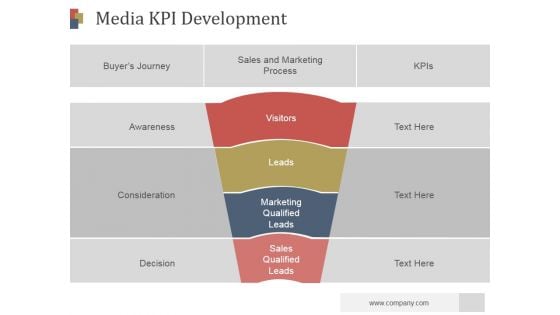
Media Kpi Development Ppt PowerPoint Presentation Themes
This is a media kpi development ppt powerpoint presentation themes. This is a four stage process. The stages in this process are buyers journey, visitors, leads, marketing qualified leads, sales qualified leads.

Kpi Engineering Process Cycle Diagram Ppt Sample
This is a kpi engineering process cycle diagram ppt sample. This is a six stage process. The stages in this process are program discovery, database optimization, program implementation, program delivery, program maintenance, analysis and reporting.
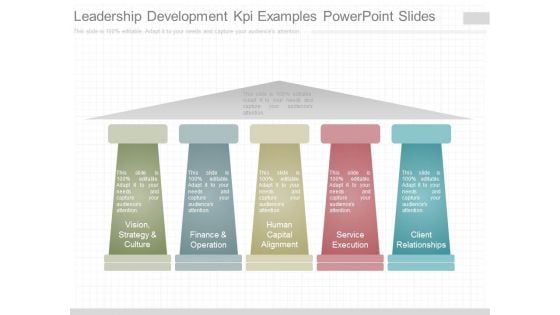
Leadership Development Kpi Examples Powerpoint Slides
This is a leadership development kpi examples powerpoint slides. This is a five stage process. The stages in this process are vision, strategy and culture, finance and operation, human capital alignment, service execution, client relationships.
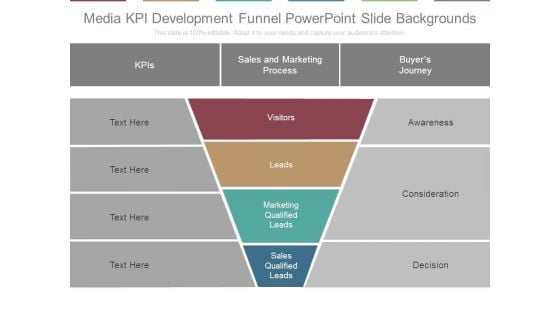
Media Kpi Development Funnel Powerpoint Slide Backgrounds
This is a media kpi development funnel powerpoint slide backgrounds. This is a four stage process. The stages in this process are kpis, sales and marketing process, buyers journey, awareness, consideration, decision, visitors, leads, marketing qualified leads, sales qualified leads.
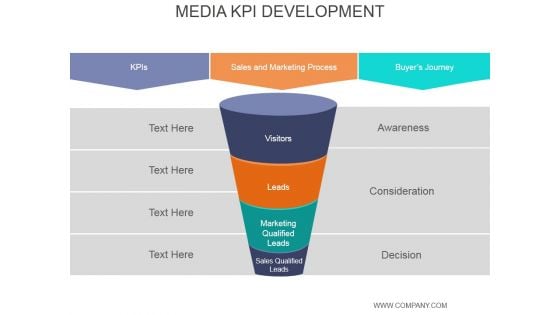
Media Kpi Development Ppt PowerPoint Presentation Portfolio
This is a media kpi development ppt powerpoint presentation portfolio. This is a five stage process. The stages in this process are awareness, consideration, decision, sales qualified leads, marketing qualified, leads, visitors.
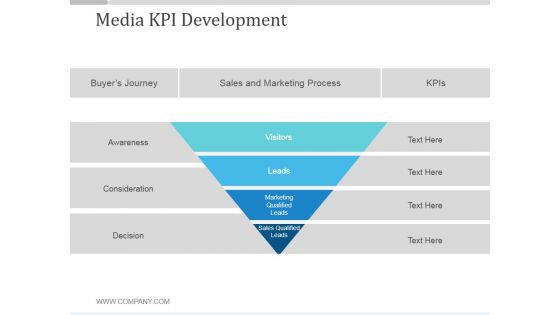
Media Kpi Development Ppt PowerPoint Presentation Gallery
This is a media kpi development ppt powerpoint presentation gallery. This is a four stage process. The stages in this process are visitors, leads, marketing qualified leads, sales qualified leads, buyers journey, sales and marketing process.
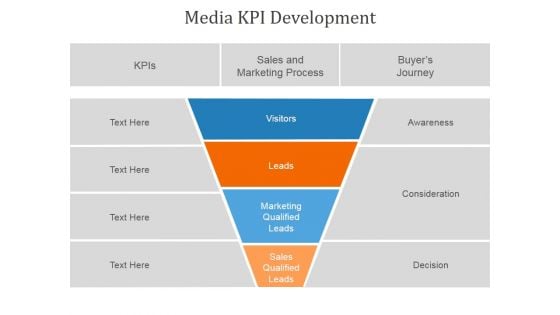
Media Kpi Development Ppt PowerPoint Presentation Slides
This is a media kpi development ppt powerpoint presentation slides. This is a four stage process. The stages in this process are sales and marketing process, visitors, leads, marketing qualified leads, sales qualified leads.

Customer Need Assessment Kpi Dashboard Infographics PDF
The following slide highlights the spas to assess customers changing needs and make strategies to improve. It consists of NPS, responses, weekly variations in needs, positive and negative feedback etc. Showcasing this set of slides titled customer need assessment kpi dashboard infographics pdf. The topics addressed in these templates are customer need assessment kpi dashboard. All the content presented in this PPT design is completely editable. Download it and make adjustments in color, background, font etc. as per your unique business setting.
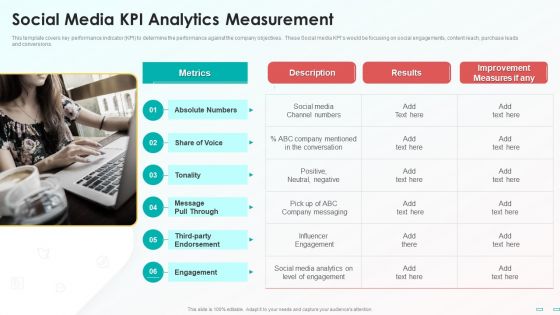
Social Media Kpi Analytics Measurement Demonstration PDF
This template covers key performance indicator KPI to determine the performance against the company objectives. These Social media KPIs would be focusing on social engagements, content reach, purchase leads and conversions. Presenting Social Media Kpi Analytics Measurement Demonstration PDF to provide visual cues and insights. Share and navigate important information on one stages that need your due attention. This template can be used to pitch topics like Metrics, Social Media, Improvement Measures. In addtion, this PPT design contains high resolution images, graphics, etc, that are easily editable and available for immediate download.
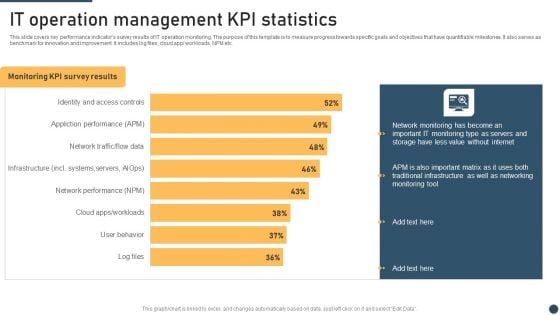
It Operation Management Kpi Statistics Graphics PDF
This slide covers key performance indicators survey results of IT operation monitoring. The purpose of this template is to measure progress towards specific goals and objectives that have quantifiable milestones. It also serves as benchmark for innovation and improvement. It includes log files, cloud app workloads, NPM etc. Showcasing this set of slides titled It Operation Management Kpi Statistics Graphics PDF. The topics addressed in these templates are KPI Statistics, Management, Network Monitoring. All the content presented in this PPT design is completely editable. Download it and make adjustments in color, background, font etc. as per your unique business setting.
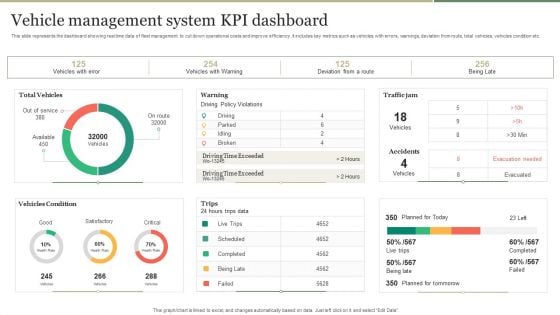
Vehicle Management System KPI Dashboard Introduction PDF
This slide represents the dashboard showing real time data of fleet management to cut down operational costs and improve efficiency. It includes key metrics such as vehicles with errors, warnings, deviation from route, total vehicles, vehicles condition etc. Pitch your topic with ease and precision using this Vehicle Management System KPI Dashboard Introduction PDF. This layout presents information on Vehicle Management System, KPI Dashboard. It is also available for immediate download and adjustment. So, changes can be made in the color, design, graphics or any other component to create a unique layout.

KPI Dashboard Showcasing Product Management Guidelines PDF
This slide showcases dashboard providing product development team performance status with determined KPIs. It provides details such as product development team score, average result scores and result KPIs. Pitch your topic with ease and precision using this KPI Dashboard Showcasing Product Management Guidelines PDF. This layout presents information on Average Rating, Innovation, Design. It is also available for immediate download and adjustment. So, changes can be made in the color, design, graphics or any other component to create a unique layout.
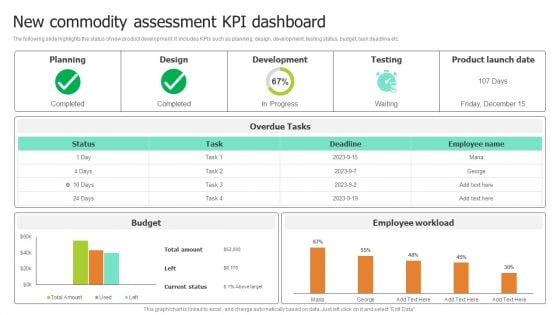
New Commodity Assessment Kpi Dashboard Pictures PDF
The following slide highlights the status of new product development. It includes KPIs such as planning, design, development, testing status, budget, task deadline etc.Showcasing this set of slides titled New Commodity Assessment Kpi Dashboard Pictures PDF. The topics addressed in these templates are Development, Product Launch Date, Overdue Tasks. All the content presented in this PPT design is completely editable. Download it and make adjustments in color, background, font etc. as per your unique business setting.
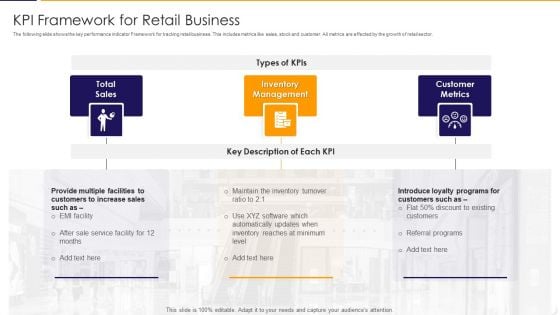
KPI Framework For Retail Business Elements PDF
The following slide shows the key performance indicator Framework for tracking retail business. This includes metrics like sales, stock and customer. All metrics are affected by the growth of retail sector. Presenting kpi framework for retail business elements pdf to dispense important information. This template comprises three stages. It also presents valuable insights into the topics including total sales, inventory management, customer metrics. This is a completely customizable PowerPoint theme that can be put to use immediately. So, download it and address the topic impactfully.
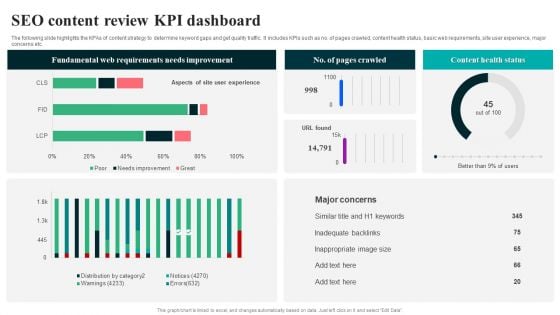
SEO Content Review KPI Dashboard Summary PDF
The following slide highlights the KPAs of content strategy to determine keyword gaps and get quality traffic. It includes KPIs such as no. of pages crawled, content health status, basic web requirements, site user experience, major concerns etc. Pitch your topic with ease and precision using this SEO Content Review KPI Dashboard Summary PDF. This layout presents information on Fundamental Web Requirements, Needs Improvement. It is also available for immediate download and adjustment. So, changes can be made in the color, design, graphics or any other component to create a unique layout.
Tracking Goals Alignment KPI Dashboard Guidelines PDF
This slide showcases a tracking dashboard for determining the alignment and progress percentage of the assigned objectives. It also includes the objective evaluation KPIs such as active objectives, overall progress, total employees, objective as per employees, aligned, organizational and departmental objectives. Pitch your topic with ease and precision using this Tracking Goals Alignment KPI Dashboard Guidelines PDF. This layout presents information on Employee, Organizational Objectives, Departmental Objectives. It is also available for immediate download and adjustment. So, changes can be made in the color, design, graphics or any other component to create a unique layout.
Development And Operations KPI Dashboard IT Devops Performance KPI Dashboard Icons PDF
This template covers DevOps assessment key performance indicators such as activity by application, storefront users, revenue by hours etc. Deliver an awe inspiring pitch with this creative development and operations kpi dashboard it devops performance kpi dashboard icons pdf bundle. Topics like revenue, service can be discussed with this completely editable template. It is available for immediate download depending on the needs and requirements of the user.
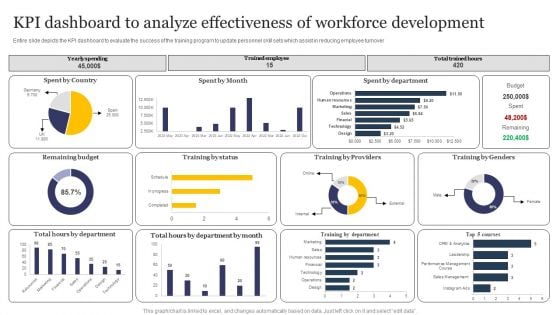
KPI Dashboard To Analyze Effectiveness Of Workforce Development Formats PDF
Entire slide depicts the KPI dashboard to evaluate the success of the training program to update personnel skill sets which assist in reducing employee turnover. Pitch your topic with ease and precision using this KPI Dashboard To Analyze Effectiveness Of Workforce Development Formats PDF. This layout presents information on Kpi Dashboard, Analyze Effectiveness, Workforce Development. It is also available for immediate download and adjustment. So, changes can be made in the color, design, graphics or any other component to create a unique layout.

 Home
Home