Kpis And Metrics
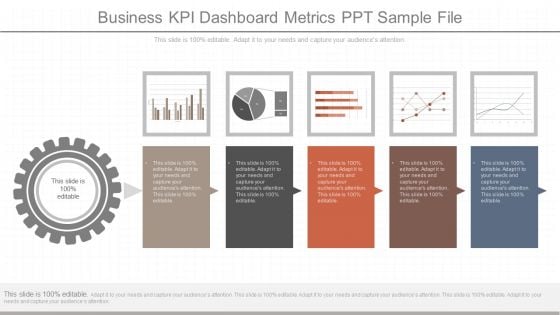
Business Kpi Dashboard Metrics Ppt Sample File
This is a business kpi dashboard metrics ppt sample file. This is a five stage process. The stages in this process are business, finance, management, success, marketing, presentation.
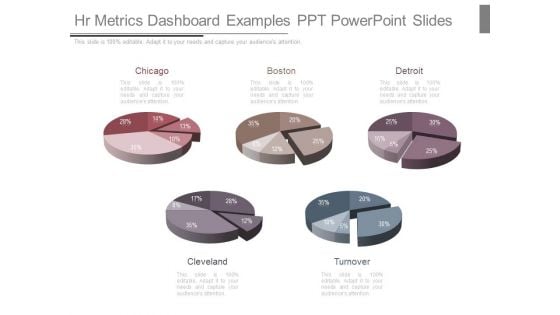
Hr Metrics Dashboard Examples Ppt Powerpoint Slides
This is a hr metrics dashboard examples ppt powerpoint slides. This is a five stage process. The stages in this process are chicago, boston, detroit, cleveland, turnover.
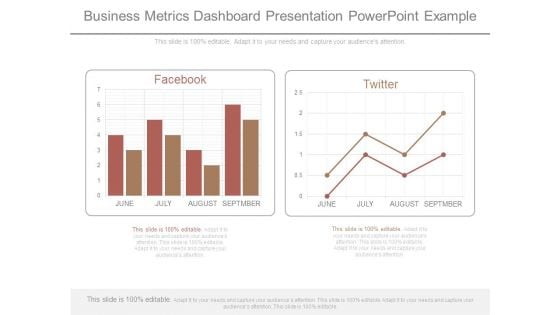
Business Metrics Dashboard Presentation Powerpoint Example
This is a business metrics dashboard presentation powerpoint example. This is a two stage process. The stages in this process are facebook, twitter.

Web Marketing Metrics Diagram Powerpoint Slides
This is a web marketing metrics diagram powerpoint slides. This is a five stage process. The stages in this process are define, measure, analyze, action, improve or eliminate.
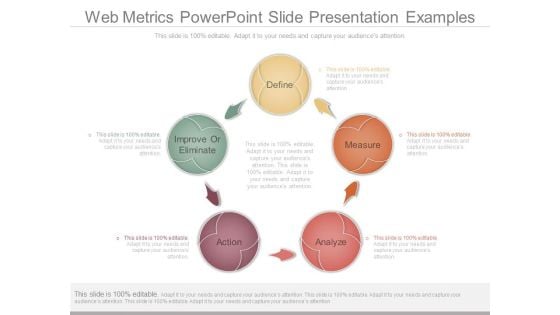
Web Metrics Powerpoint Slide Presentation Examples
This is a web metrics powerpoint slide presentation examples. This is a five stage process. The stages in this process are define, measure, analyze, action, improve or eliminate.
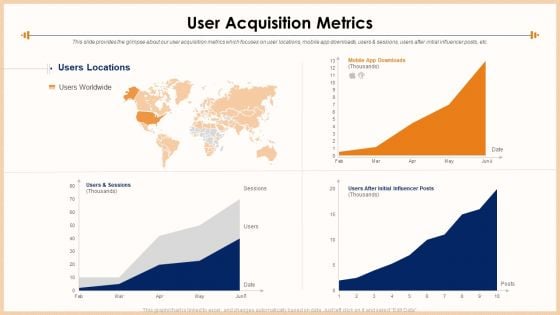
Exercise Equipment User Acquisition Metrics Designs PDF
This slide provides the glimpse about our user acquisition metrics which focuses on user locations, mobile app downloads, users and sessions, users after initial influencer posts, etc. Deliver an awe inspiring pitch with this creative exercise equipment user acquisition metrics designs pdf bundle. Topics like user acquisition metrics can be discussed with this completely editable template. It is available for immediate download depending on the needs and requirements of the user.
Operational Risk Metrics Dashboard Icon Mockup PDF
Presenting Operational Risk Metrics Dashboard Icon Mockup PDF to dispense important information. This template comprises four stages. It also presents valuable insights into the topics including Operational Risk Metrics Dashboard Icon. This is a completely customizable PowerPoint theme that can be put to use immediately. So, download it and address the topic impactfully.
KPI Dashboard Metrics Security Icon Download PDF
Persuade your audience using this KPI Dashboard Metrics Security Icon Download PDF. This PPT design covers two stages, thus making it a great tool to use. It also caters to a variety of topics including Kpi Dashboard, Metrics Security Icon. Download this PPT design now to present a convincing pitch that not only emphasizes the topic but also showcases your presentation skills.
Maintenance Performance Metrics Dashboard Icon Inspiration PDF
Presenting Maintenance Performance Metrics Dashboard Icon Inspiration PDF to dispense important information. This template comprises three stages. It also presents valuable insights into the topics including Maintenance Performance, Metrics Dashboard Icon. This is a completely customizable PowerPoint theme that can be put to use immediately. So, download it and address the topic impactfully.
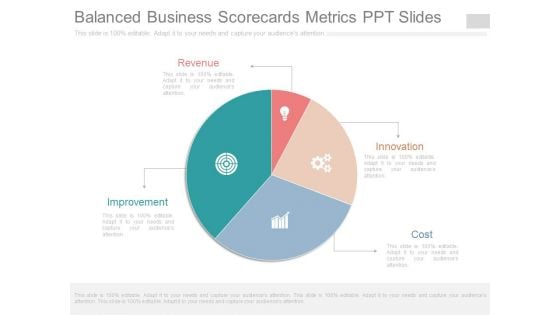
Balanced Business Scorecards Metrics Ppt Slides
This is a balanced business scorecards metrics ppt slides. This is a four stage process. The stages in this process are revenue, improvement, innovation, cost.

Business Development Metrics Sample Diagram Powerpoint Slides
This is a business development metrics sample diagram powerpoint slides. This is a four stage process. The stages in this process are place, price, target market, product, promotion.
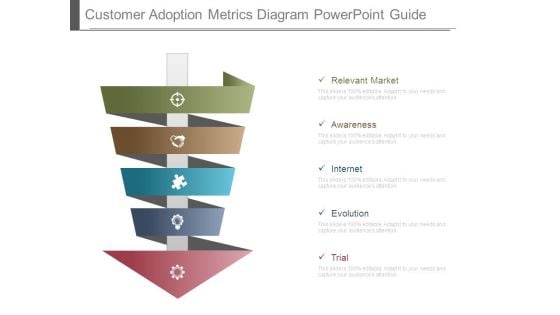
Customer Adoption Metrics Diagram Powerpoint Guide
This is a customer adoption metrics diagram powerpoint guide. This is a five stage process. The stages in this process are relevant market, awareness, internet, evolution, trial.

Performance Metrics Application Example Ppt Model
This is a performance metrics application example ppt model. This is a six stage process. The stages in this process are goal, cost, audience, budgeting, forecasting, insight.
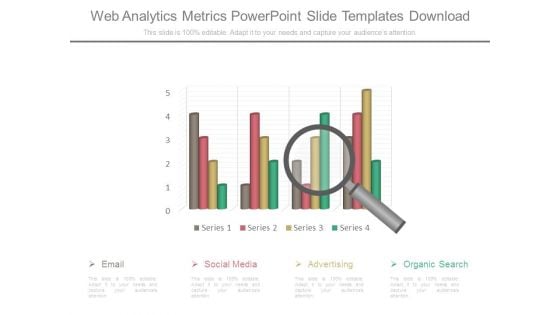
Web Analytics Metrics Powerpoint Slide Templates Download
This is a web analytics metrics powerpoint slide templates download. This is a one stage process. The stages in this process are email, social media, advertising, organic search.
Set And Track Metrics Ppt Examples
This is a set and track metrics ppt examples. This is a five stage process. The stages in this process are business, management, strategy, presentation, marketing.
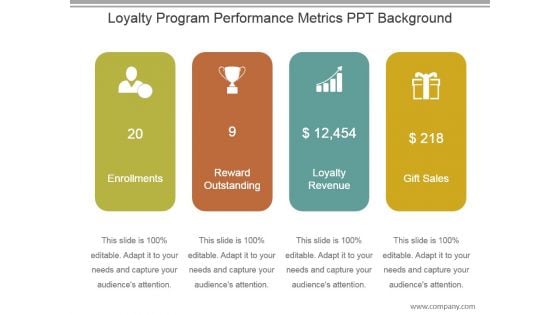
Loyalty Program Performance Metrics Ppt Background
This is a loyalty program performance metrics ppt background. This is a four stage process. The stages in this process are enrollments, reward outstanding, revenue, gift sales.
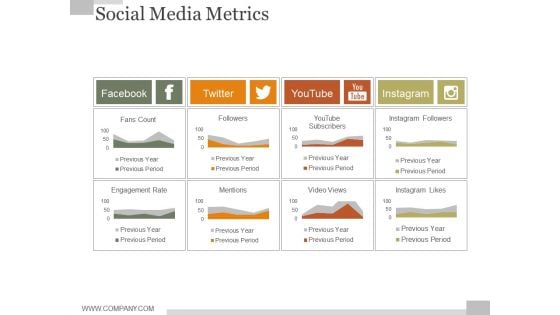
Social Media Metrics Ppt PowerPoint Presentation Graphics
This is a social media metrics ppt powerpoint presentation graphics. This is a four stage process. The stages in this process are facebook, twitter, youtube, instagram.
Setting Campaign Metrics Ppt PowerPoint Presentation Designs
This is a setting campaign metrics ppt powerpoint presentation designs. This is a five stage process. The stages in this process are business, strategy, marketing, management, planning.
Setting Campaign Metrics Ppt PowerPoint Presentation Templates
This is a setting campaign metrics ppt powerpoint presentation templates. This is a five stage process. The stages in this process are business, marketing, icons, strategy.
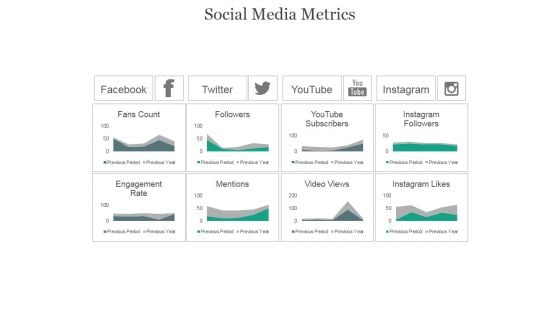
Social Media Metrics Ppt PowerPoint Presentation Slide
This is a social media metrics ppt powerpoint presentation slide. This is a four stage process. The stages in this process are facebook, twitter, youtube, instagram, fans count.
Setting Campaign Metrics Ppt PowerPoint Presentation Summary
This is a setting campaign metrics ppt powerpoint presentation summary. This is a five stage process. The stages in this process are process, strategy, management, marketing, business.
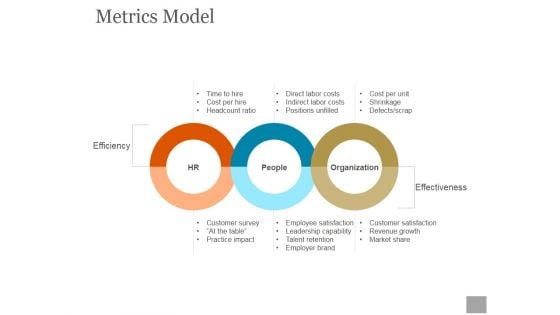
Metrics Model Ppt PowerPoint Presentation Guidelines
This is a metrics model ppt powerpoint presentation guidelines. This is a three stage process. The stages in this process are hr, people, organization, efficiency, effectiveness.
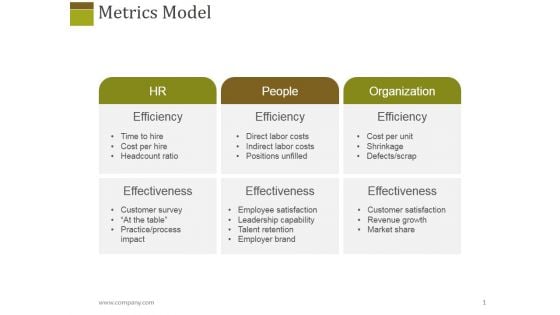
Metrics Model Ppt PowerPoint Presentation Ideas Guidelines
This is a metrics model ppt powerpoint presentation ideas guidelines. This is a six stage process. The stages in this process are hr, people, organization, efficiency.
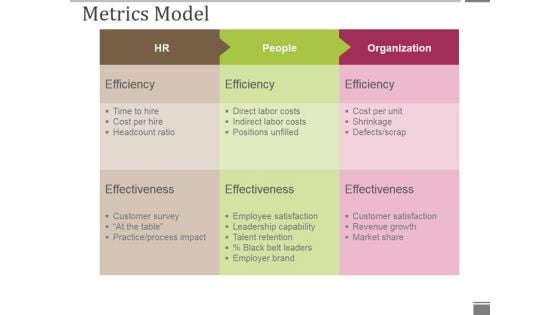
Metrics Model Ppt PowerPoint Presentation Ideas Pictures
This is a metrics model ppt powerpoint presentation ideas pictures. This is a three stage process. The stages in this process are effectiveness, efficiency, people, organization.
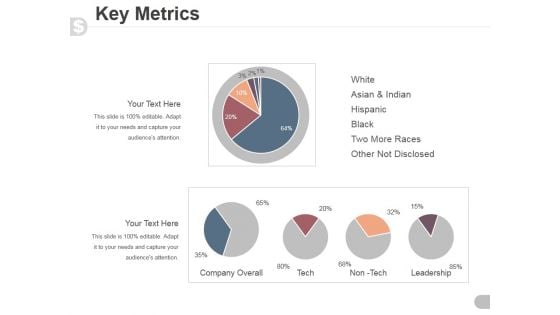
Key Metrics Ppt PowerPoint Presentation Visual Aids
This is a key metrics ppt powerpoint presentation visual aids. This is a five stage process. The stages in this process are white, asian and indian, hispanic, black, two more races, other not disclosed.
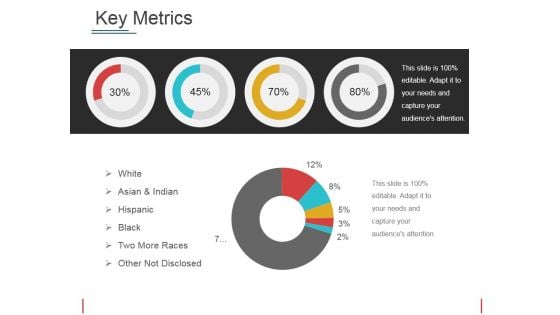
Key Metrics Ppt PowerPoint Presentation Model Professional
This is a key metrics ppt powerpoint presentation model professional. This is a four stage process. The stages in this process are white, asian and indian, hispanic, black, two more races, other not disclosed.
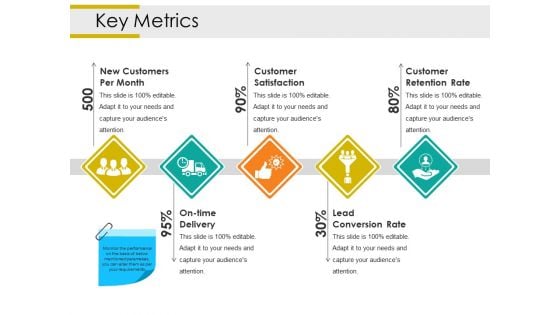
Key Metrics Ppt PowerPoint Presentation Layouts Good
This is a key metrics ppt powerpoint presentation layouts good. This is a five stage process. The stages in this process are new customers per month, customer satisfaction, customer retention rate, lead conversion rate, on time delivery.
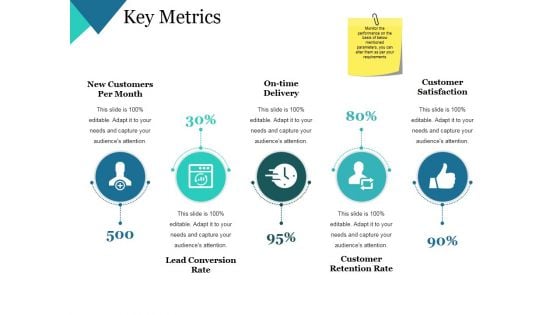
Key Metrics Ppt PowerPoint Presentation Themes
This is a key metrics ppt powerpoint presentation themes. This is a five stage process. The stages in this process are new customers per month, on time delivery, customer satisfaction, customer retention rate, lead conversion rate.

Key Metrics Ppt PowerPoint Presentation Professional Slideshow
This is a key metrics ppt powerpoint presentation professional slideshow. This is a five stage process. The stages in this process are new customers per month, on time delivery, customer satisfaction, lead conversion rate, customer retention rate.
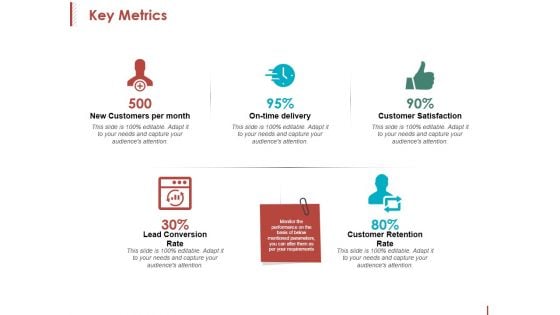
Key Metrics Ppt PowerPoint Presentation Inspiration Format
This is a key metrics ppt powerpoint presentation inspiration format. This is a five stage process. The stages in this process are new customers per month, on time delivery, customer satisfaction, customer retention rate.
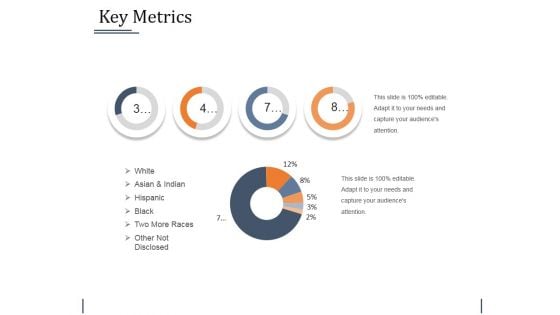
Key Metrics Ppt PowerPoint Presentation Outline Templates
This is a key metrics ppt powerpoint presentation outline templates. This is a four stage process. The stages in this process are white, asian and indian, hispanic, black, two more races, other not disclosed.
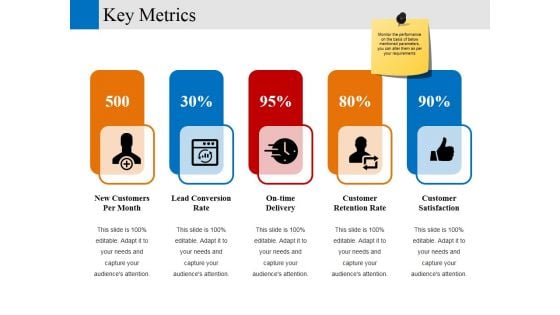
Key Metrics Ppt PowerPoint Presentation Layouts Ideas
This is a key metrics ppt powerpoint presentation layouts ideas. This is a five stage process. The stages in this process are new customers per month, lead conversion rate, on time delivery, customer retention rate, customer satisfaction.
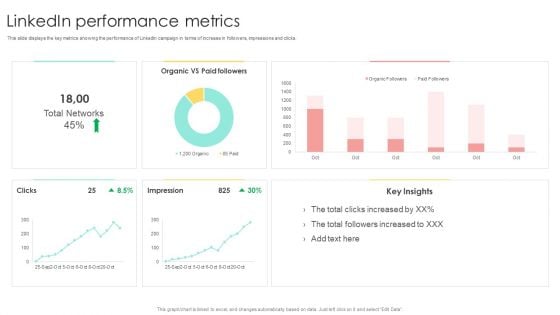
Media Advertising Linkedin Performance Metrics Mockup PDF
This slide displays the key metrics showing the performance of LinkedIn campaign in terms of increase in followers, impressions and clicks. Crafting an eye-catching presentation has never been more straightforward. Let your presentation shine with this tasteful yet straightforward Media Advertising Linkedin Performance Metrics Mockup PDF template. It offers a minimalistic and classy look that is great for making a statement. The colors have been employed intelligently to add a bit of playfulness while still remaining professional. Construct the ideal Media Advertising Linkedin Performance Metrics Mockup PDF that effortlessly grabs the attention of your audience Begin now and be certain to wow your customers
New Commodity Development Assessment Metrics Icons PDF
The following slide highlights the key metrics to evaluate product performance. It includes elements such as product wise revenue, time to the market etc.Pitch your topic with ease and precision using this New Commodity Development Assessment Metrics Icons PDF. This layout presents information on Annual Product, Wise Revenue, Shown Continuous. It is also available for immediate download and adjustment. So, changes can be made in the color, design, graphics or any other component to create a unique layout.
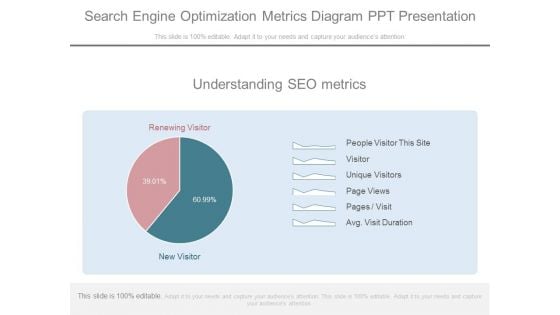
Search Engine Optimization Metrics Diagram Ppt Presentation
This is a search engine optimization metrics diagram ppt presentation. This is a two stage process. The stages in this process are understanding seo metrics, people visitor this site, visitor, unique visitors, page views, pages visit, avg visit duration, renewing visitor, new visitor.
Devops Performance Assessment Metrics Icons PDF
This is a devops performance assessment metrics icons pdf template with various stages. Focus and dispense information on four stages using this creative set, that comes with editable features. It contains large content boxes to add your information on topics like devops performance assessment metrics. You can also showcase facts, figures, and other relevant content using this PPT layout. Grab it now.
Student Enrollment Education Metrics Icon Topics PDF
Presenting Student Enrollment Education Metrics Icon Topics PDF to dispense important information. This template comprises four stages. It also presents valuable insights into the topics including Student Enrollment, Education Metrics, Icon. This is a completely customizable PowerPoint theme that can be put to use immediately. So, download it and address the topic impactfully.
Robotic Process Automation Metrics Icon Download PDF
Pitch your topic with ease and precision using this Robotic Process Automation Metrics Icon Download PDF. This layout presents information on Automation Metrics Icon, Robotic Process. It is also available for immediate download and adjustment. So, changes can be made in the color, design, graphics or any other component to create a unique layout.
Pilot Program Success Metrics Icon Demonstration PDF
Persuade your audience using this Pilot Program Success Metrics Icon Demonstration PDF. This PPT design covers three stages, thus making it a great tool to use. It also caters to a variety of topics including Pilot Program Success, Metrics Icon. Download this PPT design now to present a convincing pitch that not only emphasizes the topic but also showcases your presentation skills.
Sales Target Metrics Achievement Icon Download PDF
Persuade your audience using this Sales Target Metrics Achievement Icon Download PDF. This PPT design covers four stages, thus making it a great tool to use. It also caters to a variety of topics including Sales Target Metrics, Achievement Icon. Download this PPT design now to present a convincing pitch that not only emphasizes the topic but also showcases your presentation skills.
Icon Depicting Operations Metrics Monitoring Diagrams PDF
Presenting Icon Depicting Operations Metrics Monitoring Diagrams PDF to dispense important information. This template comprises Three stages. It also presents valuable insights into the topics including Icon Depicting Operations, Metrics Monitoring. This is a completely customizable PowerPoint theme that can be put to use immediately. So, download it and address the topic impactfully.
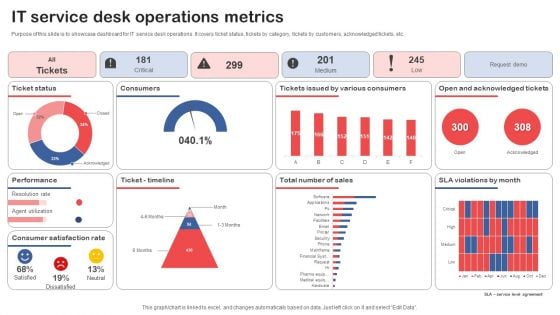
IT Service Desk Operations Metrics Summary PDF
Showcasing this set of slides titled IT Service Desk Operations Metrics Summary PDF. The topics addressed in these templates are IT Service, Desk Operations Metrics. All the content presented in this PPT design is completely editable. Download it and make adjustments in color, background, font etc. as per your unique business setting.
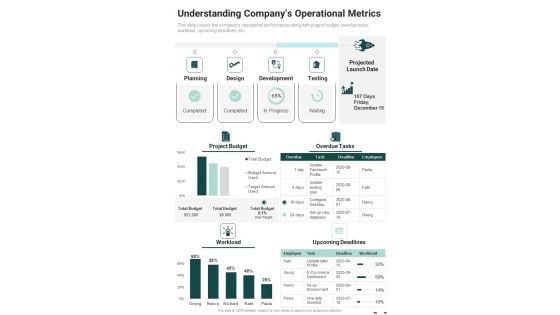
Understanding Companys Operational Metrics One Pager Documents
Presenting you an exemplary Understanding Companys Operational Metrics One Pager Documents. Our one-pager comprises all the must-have essentials of an inclusive document. You can edit it with ease, as its layout is completely editable. With such freedom, you can tweak its design and other elements to your requirements. Download this Understanding Companys Operational Metrics One Pager Documents brilliant piece now.
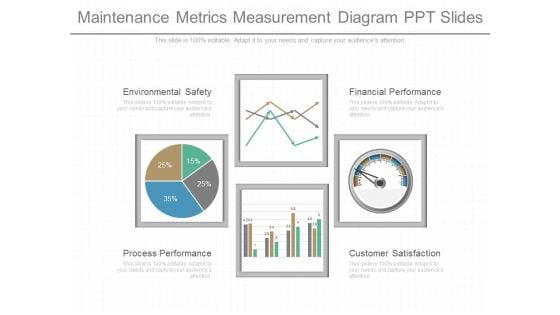
Maintenance Metrics Measurement Diagram Ppt Slides
This is a maintenance metrics measurement diagram ppt slides. This is a four stage process. The stages in this process are environmental safety, process performance, financial performance, customer satisfaction.
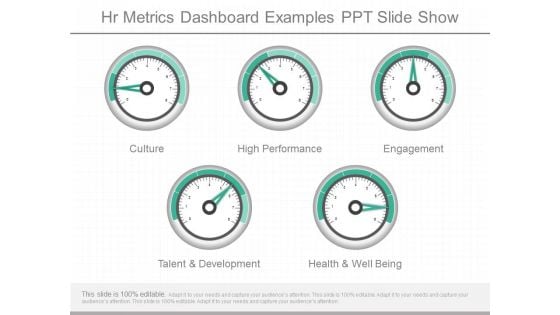
Hr Metrics Dashboard Examples Ppt Slide Show
This is a hr metrics dashboard examples ppt slide show. This is a five stage process. The stages in this process are culture, high performance, engagement, talent and development, health and well being.
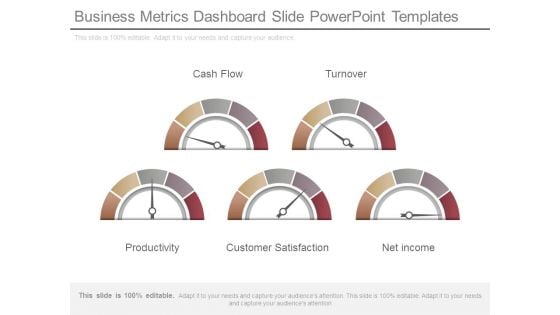
Business Metrics Dashboard Slide Powerpoint Templates
This is a business metrics dashboard slide powerpoint templates. This is a five stage process. The stages in this process are cash flow, turnover, productivity, customer satisfaction, net income.
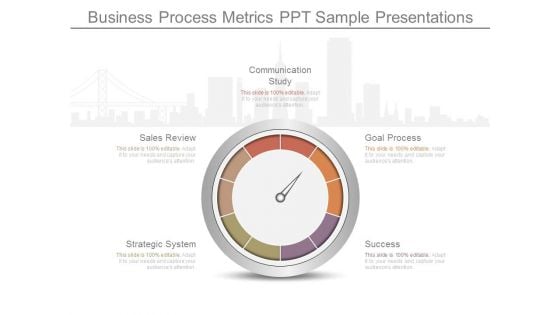
Business Process Metrics Ppt Sample Presentations
This is a business process metrics ppt sample presentations. This is a five stage process. The stages in this process are communication study, goal process, success, strategic system, sales review.
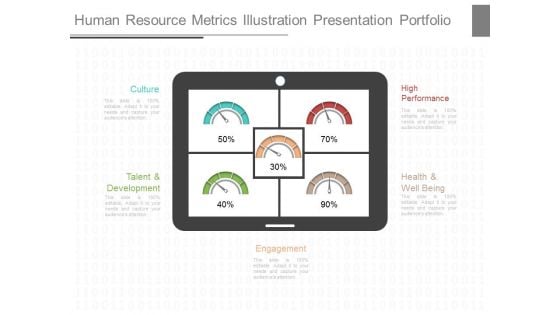
Human Resource Metrics Illustration Presentation Portfolio
This is a human resource metrics illustration presentation portfolio. This is a five stage process. The stages in this process are culture, high performance, talent and development, health and well being, engagement.
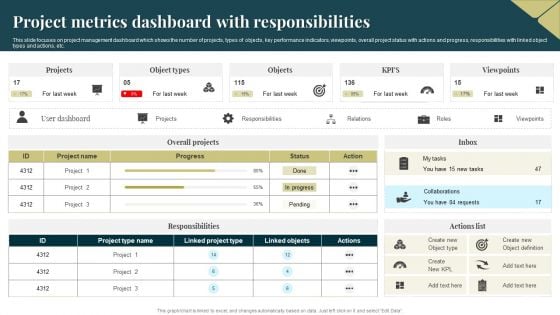
Project Metrics Dashboard With Responsibilities Graphics PDF
This slide focuses on project management dashboard which shows the number of projects, types of objects, key performance indicators, viewpoints, overall project status with actions and progress, responsibilities with linked object types and actions, etc. Pitch your topic with ease and precision using this Project Metrics Dashboard With Responsibilities Graphics PDF. This layout presents information on Project Metrics, Dashboard With Responsibilities. It is also available for immediate download and adjustment. So, changes can be made in the color, design, graphics or any other component to create a unique layout.
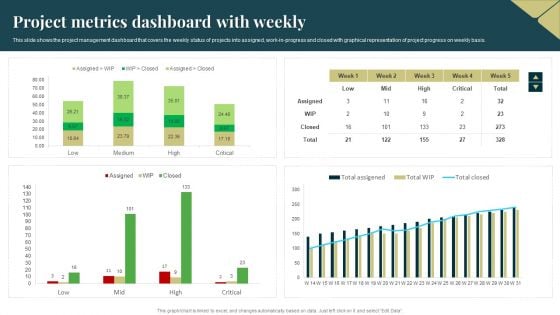
Project Metrics Dashboard With Weekly Formats PDF
This slide shows the project management dashboard that covers the weekly status of projects into assigned, work in progress and closed with graphical representation of project progress on weekly basis. Showcasing this set of slides titled Project Metrics Dashboard With Weekly Formats PDF. The topics addressed in these templates are Project Metrics, Dashboard With Weekly. All the content presented in this PPT design is completely editable. Download it and make adjustments in color, background, font etc. as per your unique business setting.
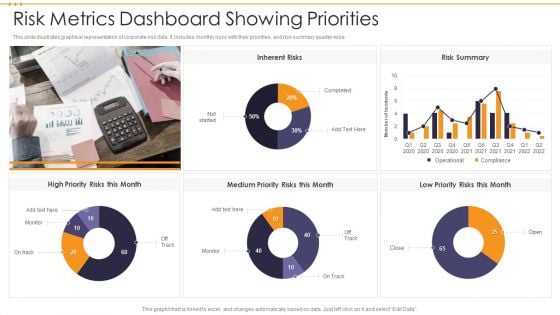
Risk Metrics Dashboard Showing Priorities Infographics PDF
This slide illustrates graphical representation of corporate risk data. It includes monthly risks with their priorities, and risk summary quarter wise. Showcasing this set of slides titled Risk Metrics Dashboard Showing Priorities Infographics PDF. The topics addressed in these templates are Risk Metrics Dashboard Showing Priorities. All the content presented in this PPT design is completely editable. Download it and make adjustments in color, background, font etc. as per your unique business setting.
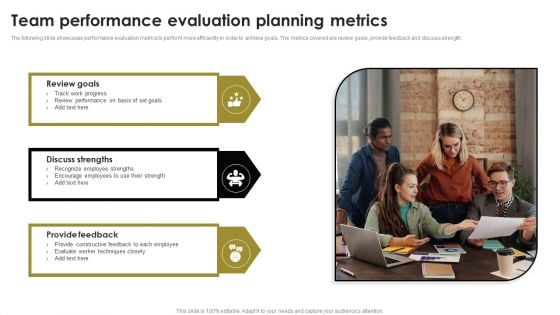
Team Performance Evaluation Planning Metrics Ideas PDF
The following slide showcases performance evaluation metrics to perform more efficiently in order to achieve goals. The metrics covered are review goals, provide feedback and discuss strength. Persuade your audience using this Team Performance Evaluation Planning Metrics Ideas PDF. This PPT design covers three stages, thus making it a great tool to use. It also caters to a variety of topics including Discuss Strengths, Review Goals, Provide Feedback. Download this PPT design now to present a convincing pitch that not only emphasizes the topic but also showcases your presentation skills.
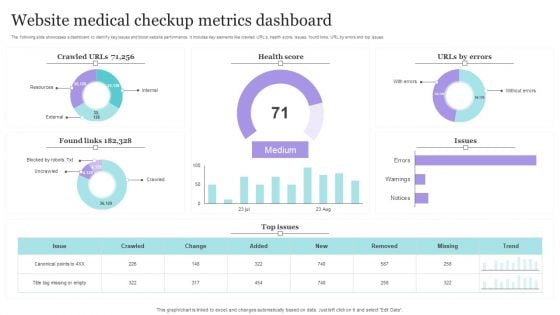
Website Medical Checkup Metrics Dashboard Introduction PDF
The following slide showcases a dashboard to identify key issues and boost website performance. It includes key elements like crawled URLs, health score, issues, found links, URL by errors and top issues. Showcasing this set of slides titled Website Medical Checkup Metrics Dashboard Introduction PDF. The topics addressed in these templates are Website Medical Checkup, Metrics Dashboard. All the content presented in this PPT design is completely editable. Download it and make adjustments in color, background, font etc. as per your unique business setting.
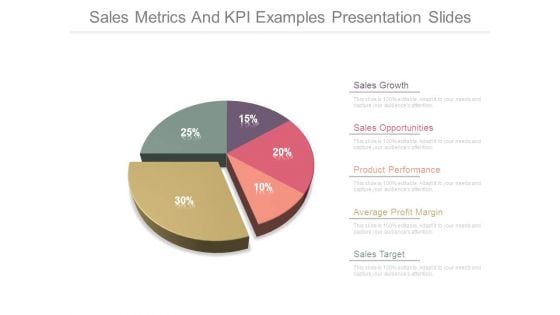
Sales Metrics And Kpi Examples Presentation Slides
This is a sales metrics and kpi examples presentation slides. This is a five stage process. The stages in this process are sales growth, sales opportunities, product performance, average profit margin, sales target.
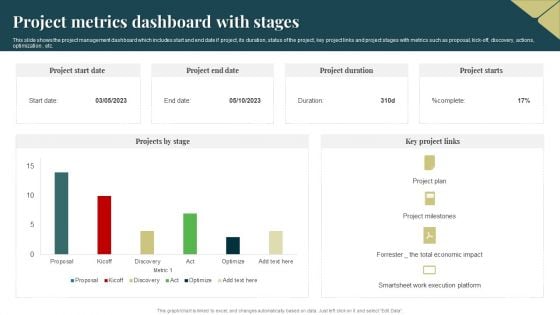
Project Metrics Dashboard With Stages Download PDF
This slide shows the project management dashboard which includes start and end date if project, its duration, status of the project, key project links and project stages with metrics such as proposal, kick off, discovery, actions, optimization , etc. Pitch your topic with ease and precision using this Project Metrics Dashboard With Stages Download PDF. This layout presents information on Economic, Project Plan, Execution. It is also available for immediate download and adjustment. So, changes can be made in the color, design, graphics or any other component to create a unique layout.
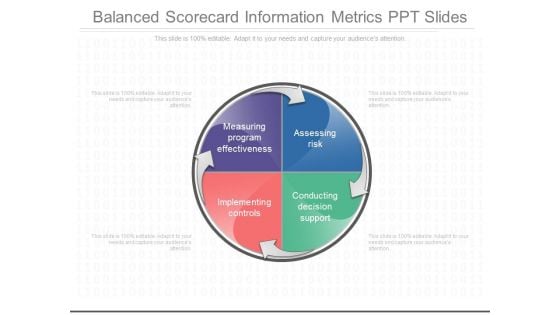
Balanced Scorecard Information Metrics Ppt Slides
This is a balanced scorecard information metrics ppt slides. This is a four stage process. The stages in this process are assessing risk, conducting decision support, measuring program effectiveness, implementing controls.
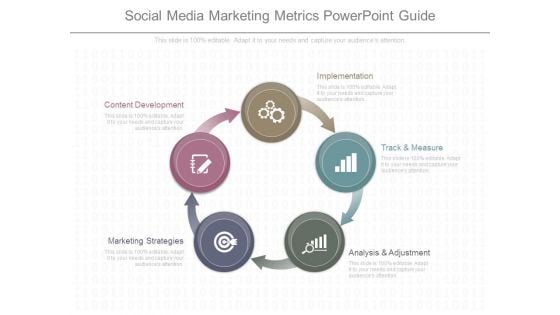
Social Media Marketing Metrics Powerpoint Guide
This is a social media marketing metrics powerpoint guide. This is a five stage process. The stages in this process are implementation, track and measure, analysis and adjustment, marketing strategies, content development.
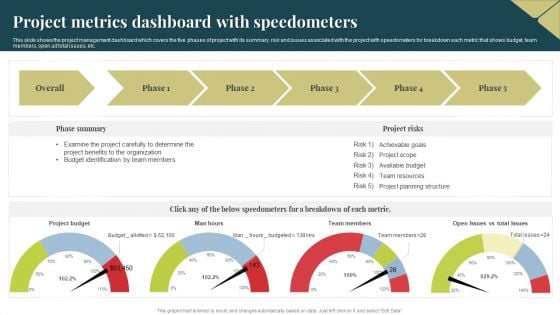
Project Metrics Dashboard With Speedometers Themes PDF
This slide shows the project management dashboard which covers the five phases of project with its summary, risk and issues associated with the project with speedometers for breakdown each metric that shows budget, team members, open ad total issues, etc. Showcasing this set of slides titled Project Metrics Dashboard With Speedometers Themes PDF. The topics addressed in these templates are Budget, Project Benefits, Organization. All the content presented in this PPT design is completely editable. Download it and make adjustments in color, background, font etc. as per your unique business setting.
Metrics Showcasing Project Management Operations Icons PDF
This slide exhibits project management operations dashboard. It covers task status, budget status, pending tasks, activity progress status etc to track project progress. Showcasing this set of slides titled Metrics Showcasing Project Management Operations Icons PDF. The topics addressed in these templates are Metrics Showcasing, Project Management Operations. All the content presented in this PPT design is completely editable. Download it and make adjustments in color, background, font etc. as per your unique business setting.

Performance Driver Metrics Diagram Powerpoint Show
This is a performance driver metrics diagram powerpoint show. This is a five stage process. The stages in this process are values, behavior, habits of action, habits of thinking, competence.

 Home
Home