Meter
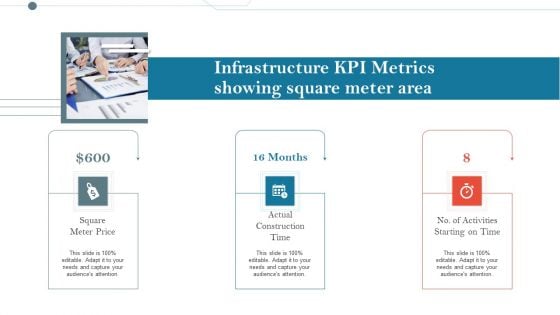
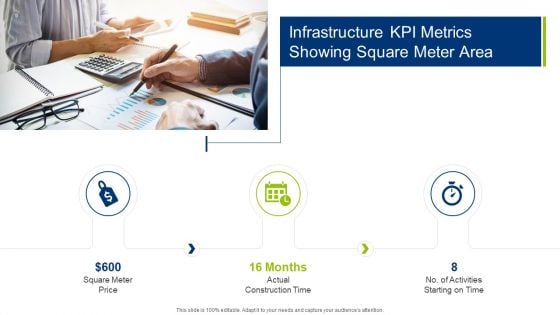
Construction Management Services And Action Plan Infrastructure KPI Metrics Showing Square Meter Area Information PDF
Presenting construction management services and action plan infrastructure kpi metrics showing square meter area information pdf to provide visual cues and insights. Share and navigate important information on three stages that need your due attention. This template can be used to pitch topics like infrastructure kpi metrics showing square meter area. In addtion, this PPT design contains high resolution images, graphics, etc, that are easily editable and available for immediate download.
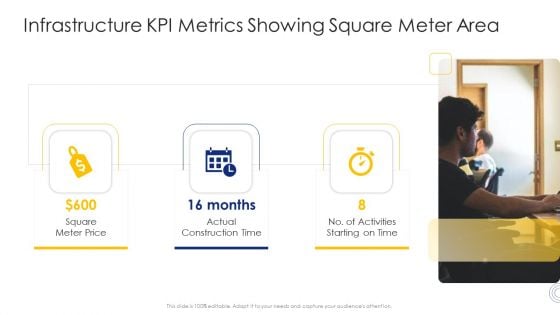
Construction Engineering And Industrial Facility Management Infrastructure KPI Metrics Showing Square Meter Area Ideas PDF
Presenting construction engineering and industrial facility management infrastructure kpi metrics showing square meter area ideas pdf to provide visual cues and insights. Share and navigate important information on three stages that need your due attention. This template can be used to pitch topics like square meter price, actual construction time, no of activities starting on time . In addtion, this PPT design contains high resolution images, graphics, etc, that are easily editable and available for immediate download.
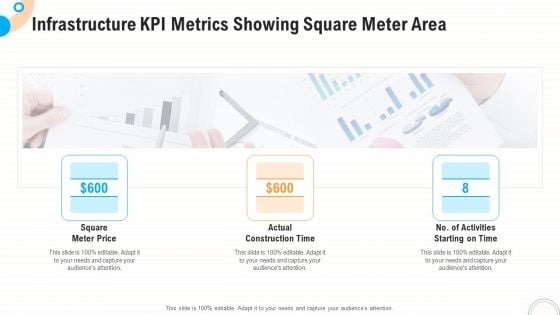
Fiscal And Operational Assessment Infrastructure KPI Metrics Showing Square Meter Area Guidelines PDF
Presenting fiscal and operational assessment infrastructure kpi metrics showing square meter area guidelines pdf to provide visual cues and insights. Share and navigate important information on three stages that need your due attention. This template can be used to pitch topics like square meter price, actual construction time, activities starting. In addtion, this PPT design contains high resolution images, graphics, etc, that are easily editable and available for immediate download.
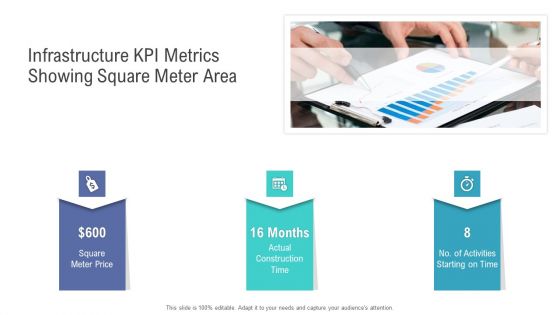
Financial Functional Assessment Infrastructure KPI Metrics Showing Square Meter Area Summary PDF
Presenting financial functional assessment infrastructure kpi metrics showing square meter area summary pdf to provide visual cues and insights. Share and navigate important information on three stages that need your due attention. This template can be used to pitch topics like square meter price, actual construction time, activities. In addition, this PPT design contains high-resolution images, graphics, etc, that are easily editable and available for immediate download.
Infrastructure Building Administration Infrastructure KPI Metrics Showing Square Meter Area Portrait PDF
This is a infrastructure building administration infrastructure kpi metrics showing square meter area portrait pdf template with various stages. Focus and dispense information on three stages using this creative set, that comes with editable features. It contains large content boxes to add your information on topics like square meter price actual, construction time, activities starting on time. You can also showcase facts, figures, and other relevant content using this PPT layout. Grab it now.

Construction Management Services Infrastructure KPI Metrics Showing Square Meter Area Designs PDF
Presenting construction management services infrastructure kpi metrics showing square meter area designs pdf to provide visual cues and insights. Share and navigate important information on three stages that need your due attention. This template can be used to pitch topics like square meter price, actual construction time, activities. In addition, this PPT design contains high-resolution images, graphics, etc, that are easily editable and available for immediate download.
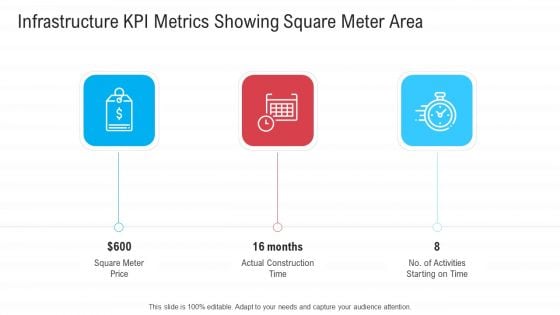
Infrastructure Designing And Administration Infrastructure KPI Metrics Showing Square Meter Area Guidelines PDF
Presenting infrastructure designing and administration infrastructure kpi metrics showing square meter area guidelines pdf to provide visual cues and insights. Share and navigate important information on three stages that need your due attention. This template can be used to pitch topics like square meter price, actual construction time, no of activities starting on time. In addtion, this PPT design contains high resolution images, graphics, etc, that are easily editable and available for immediate download.
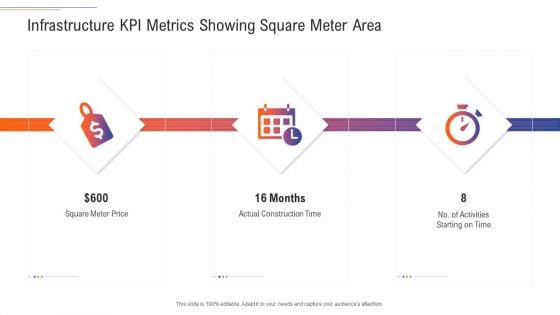
Support Services Management Infrastructure KPI Metrics Showing Square Meter Area Ideas PDF
Presenting support services management infrastructure kpi metrics showing square meter area ideas pdf to provide visual cues and insights. Share and navigate important information on three stages that need your due attention. This template can be used to pitch topics like square meter price, actual construction time, no of activities starting on time. In addtion, this PPT design contains high resolution images, graphics, etc, that are easily editable and available for immediate download.
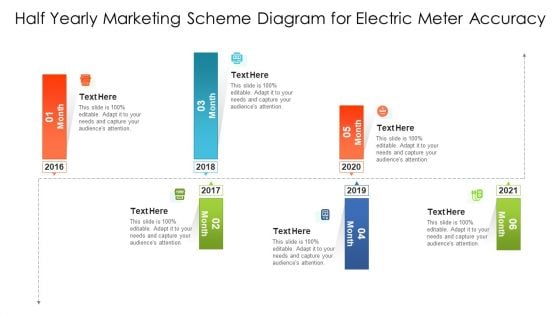
Half Yearly Marketing Scheme Diagram For Electric Meter Accuracy Ppt PowerPoint Presentation Gallery Maker PDF
Persuade your audience using this half yearly marketing scheme diagram for electric meter accuracy ppt powerpoint presentation gallery maker pdf. This PPT design covers six stages, thus making it a great tool to use. It also caters to a variety of topics including half yearly marketing scheme diagram for electric meter accuracy. Download this PPT design now to present a convincing pitch that not only emphasizes the topic but also showcases your presentation skills.
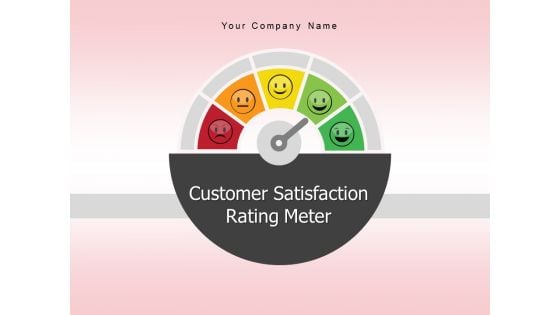
Customer Satisfaction Rating Meter Feedback Rating Scale Sale Services Excellent Ppt PowerPoint Presentation Complete Deck
Presenting this set of slides with name customer satisfaction rating meter feedback rating scale sale services excellent ppt powerpoint presentation complete deck. The topics discussed in these slides are feedback rating scale, sale services, excellent, product, services. This is a completely editable PowerPoint presentation and is available for immediate download. Download now and impress your audience.
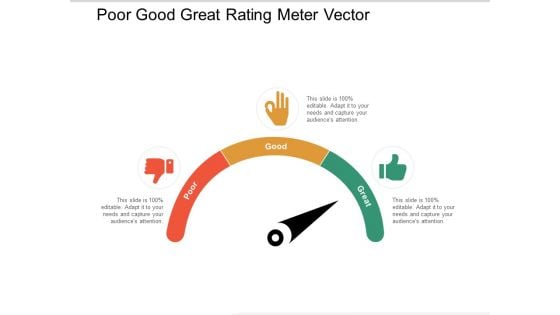
Poor Good Great Rating Meter Vector Ppt PowerPoint Presentation Show Slide Download
Presenting this set of slides with name poor good great rating meter vector ppt powerpoint presentation show slide download. This is a three stage process. The stages in this process are product quality, product improvement, rating scale. This is a completely editable PowerPoint presentation and is available for immediate download. Download now and impress your audience.
Red Yellow Green Meter With Emoticons For Feedback Ppt PowerPoint Presentation Ideas Template
Presenting this set of slides with name red yellow green meter with emoticons for feedback ppt powerpoint presentation ideas template. This is a three stage process. The stages in this process are product quality, product improvement, rating scale. This is a completely editable PowerPoint presentation and is available for immediate download. Download now and impress your audience.
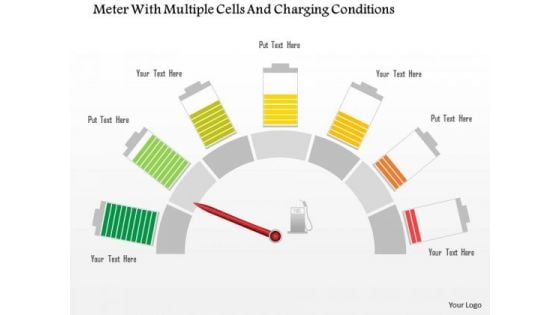
Business Diagram Meter With Multiple Cells And Charging Conditions Presentation Template
This Power Point template slide has been designed with graphic of meter and multiple cells. This PPT slide contains the concept of power consumption and charging. Use this PPT in your presentation and build an innovative presentation for power related topics.
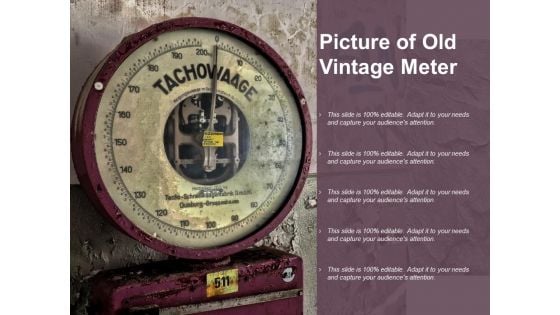
Picture Of Old Vintage Meter Ppt PowerPoint Presentation Infographic Template Sample
Presenting this set of slides with name picture of old vintage meter ppt powerpoint presentation infographic template sample. This is a one stage process. The stages in this process are weighing scale, measure, weighing machine. This is a completely editable PowerPoint presentation and is available for immediate download. Download now and impress your audience.
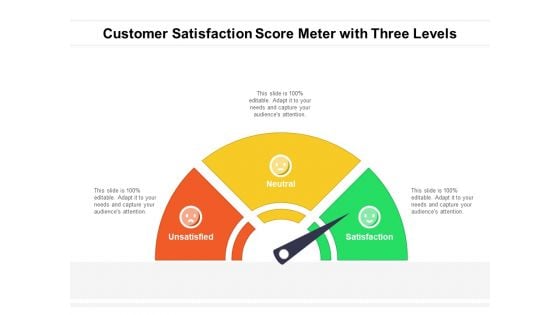
Customer Satisfaction Score Meter With Three Levels Ppt PowerPoint Presentation Gallery Smartart PDF
Presenting customer satisfaction score meter with three levels ppt powerpoint presentation gallery smartart pdf to dispense important information. This template comprises three stages. It also presents valuable insights into the topics including unsatisfied, neutral, satisfaction. This is a completely customizable PowerPoint theme that can be put to use immediately. So, download it and address the topic impactfully.
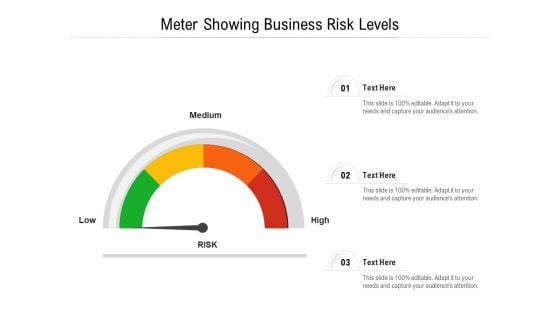
Meter Showing Business Risk Levels Ppt PowerPoint Presentation Show Slide PDF
Persuade your audience using this meter showing business risk levels ppt powerpoint presentation show slide pdf. This PPT design covers three stages, thus making it a great tool to use. It also caters to a variety of topics including low, medium, high. Download this PPT design now to present a convincing pitch that not only emphasizes the topic but also showcases your presentation skills.
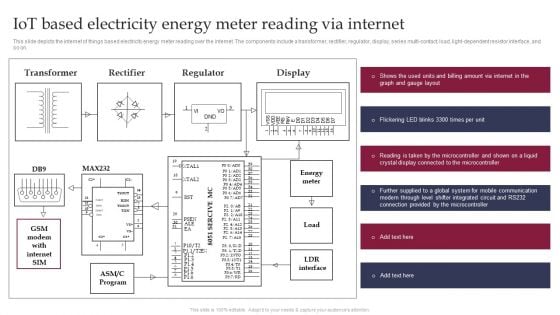
Smart Grid Technology Iot Based Electricity Energy Meter Reading Background PDF
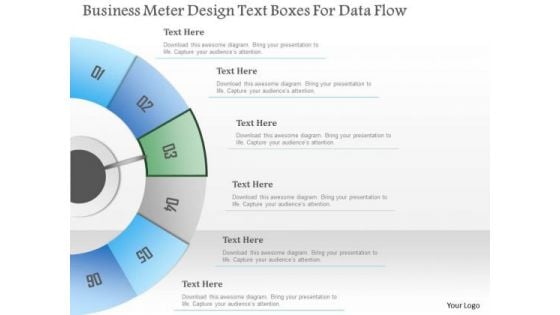
Busines Diagram Business Meter Design Text Boxes For Data Flow Presentation Template
Concept of data flow can be well defined with this exclusive business diagram. This slide contains the diagram of six steps in semi-circle. Use this professional diagram to impress your viewers.
Smart Metering Management Diagram Good Ppt Example
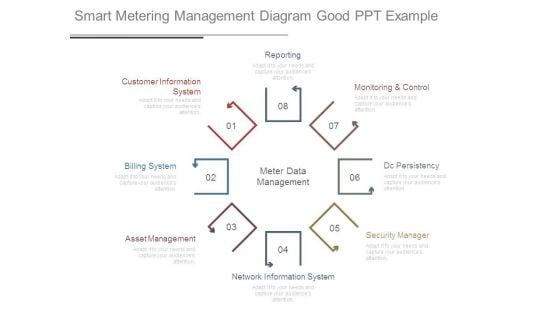
This is a smart metering management diagram good ppt example. This is a eight stage process. The stages in this process are reporting, customer information system, billing system, asset management, network information system, security manager, dc persistency, monitoring and control, meter data management.
Risk Meters Showing Risk Levels Ppt PowerPoint Presentation Summary Example
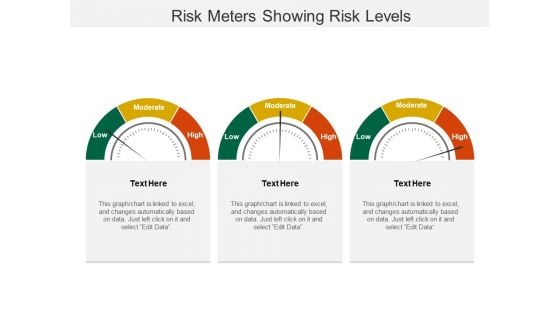
This is a risk meters showing risk levels ppt powerpoint presentation summary example. This is a three stage process. The stages in this process are risk meter, risk speedometer, hazard meter.
Business Diagram Meters Displaying Stages Of Growth Presentation Template
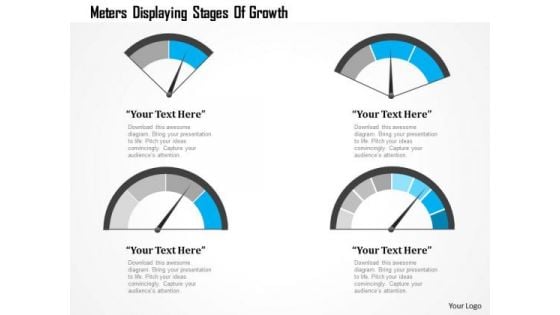
Graphic of four different meters has been used to craft this power point template. This PPT contains the concept of speed calculation. Use this PPT for your technology and mechanical topics in any presentations.
Business Diagram Meters For Business Progress Presentation Template
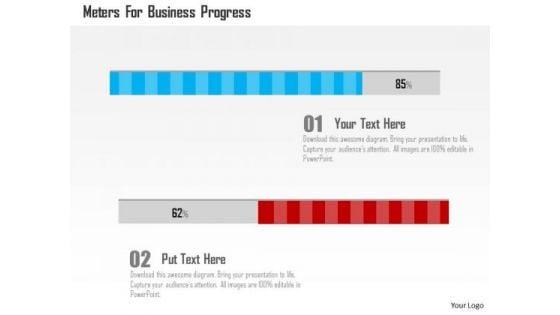
This business slide contains graphics of meter. You may use this slide to depict business progress. Download our above diagram to express information in a visual way.

Business Diagram Three Meters For Speed Control Presentation Template
Graphic of three speedometers has been used to design this power point template. This diagram contains the concept of speed control. Amplify your thoughts via this appropriate business template.
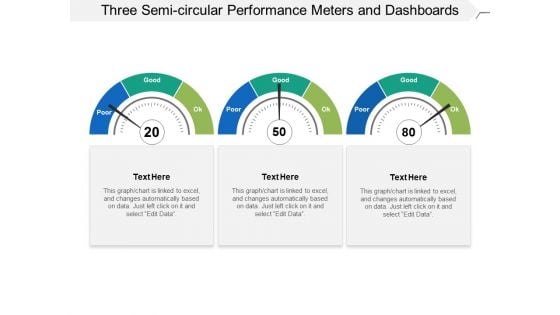
Three Semi Circular Performance Meters And Dashboards Ppt PowerPoint Presentation Slides Influencers
This is a three semi circular performance meters and dashboards ppt powerpoint presentation slides influencers. This is a three stage process. The stages in this process are fuel gauge, gas gauge, fuel containers.
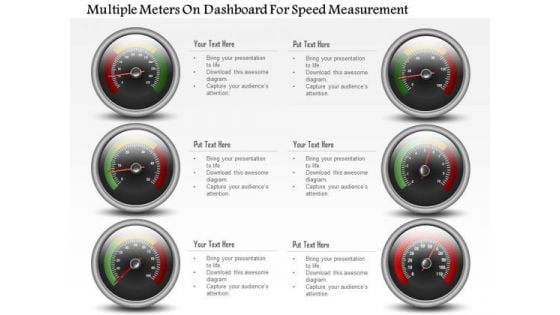
Business Diagram Multiple Meters On Dashboard For Speed Measurement PowerPoint Slide
This business diagram has been designed with multiple meters on dashboard. This slide can be used for business planning and progress. Use this diagram for your business and success milestones related presentations.
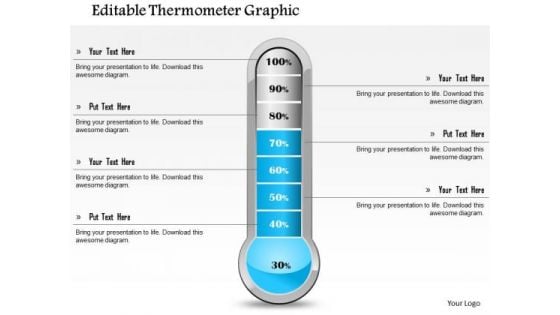
Business Framework Editable Thermometer Graphic PowerPoint Presentation
This Power Point template slide has been crafted with graphic of meter. This meter contains the max and min value. Use this PPt for your technical presentation and display your technical specifications in a graphical way.

Profit Business PowerPoint Template 0910
beautiful woman posing near profit loss meter Experience acclaim with our Profit Business PowerPoint Template 0910. Your thoughts will acquire true fame.
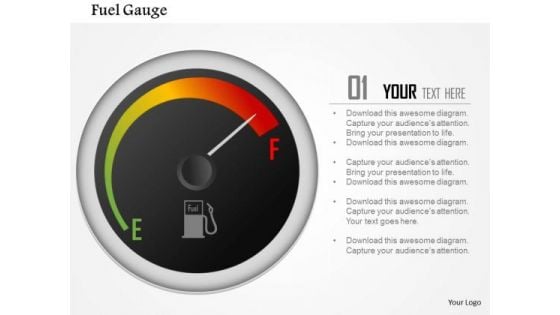
Business Framework Fuel Gauge Indicator PowerPoint Presentation
This diagram displays framework of fuel gauge indicator. It contains graphic of black meter indicating the fuel gauge. Use this editable diagram for your business and technology related presentations.
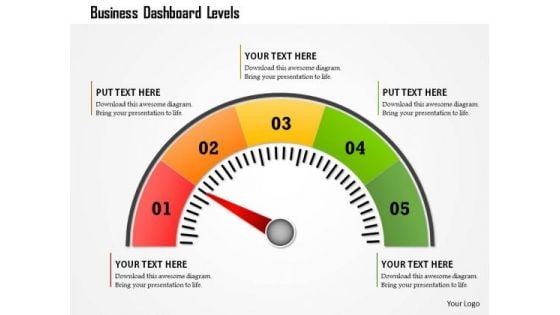
Business Framework Business Dashboard Levels PowerPoint Presentation
This business diagram displays colored meter with multiple levels. Use this diagram to display business process. This diagram can be used to indicate performance measures. This is an excellent diagram to impress your audiences.
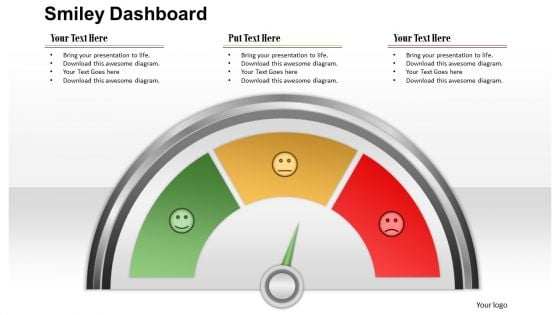
Business Framework Smiley Dashboard PowerPoint Presentation
This Power Point template slide has been designed with graphic of dashboard with meter diagram. This PPT slide contains the concept of maximum achievement. Use this PPT slide in your business presentations.
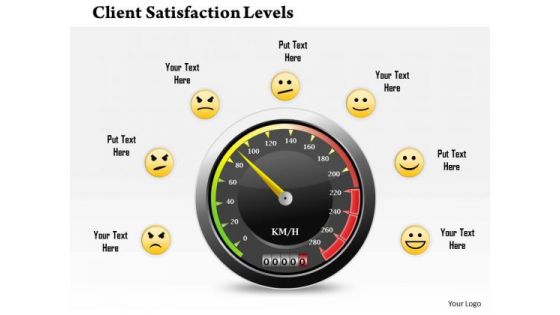
Business Framework Client Satisfaction Levels PowerPoint Presentation
Graphic of black meter has been used to design this business diagram. This business slide displays the concept of client satisfaction with different levels. Use this editable diagram for customer and business related presentations.
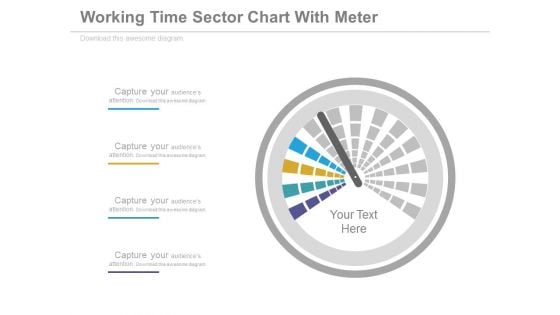
Dashboard Performance Analysis Chart Powerpoint Slides
This PowerPoint template graphics of meter chart. Download this PPT chart for business performance analysis. This PowerPoint slide is of great help in the business sector to make realistic presentations and provides effective way of presenting your newer thoughts.
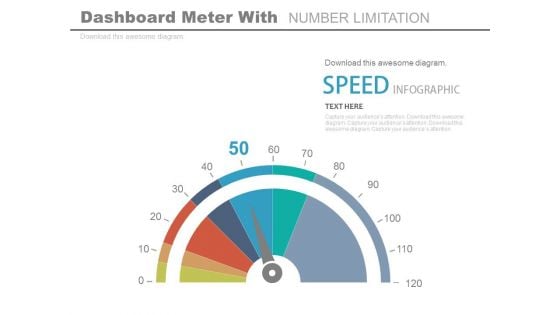
Dashboard To Impact The Performance Powerpoint Slides
This PowerPoint template graphics of meter chart. Download this PPT chart for business performance analysis. This PowerPoint slide is of great help in the business sector to make realistic presentations and provides effective way of presenting your newer thoughts.
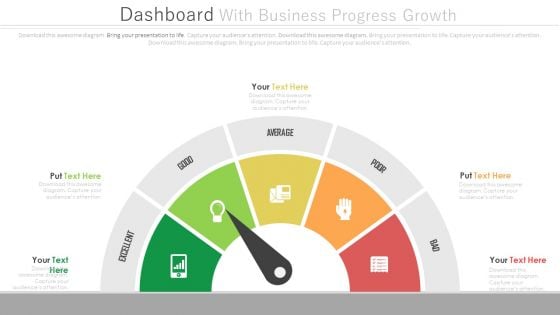
Dashboard To Simplify Business Data Analysis Powerpoint Slides
This PowerPoint template graphics of meter chart. Download this PPT chart to simplify business data analysis. This PowerPoint slide is of great help in the business sector to make realistic presentations and provides effective way of presenting your newer thoughts.
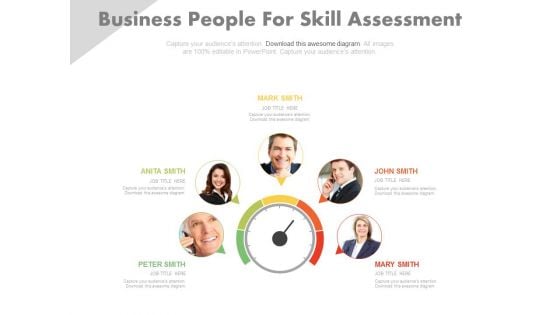
Dashboard For Employee Skill Assessment Powerpoint Slides
This innovative, stunningly beautiful dashboard has been designed for employee skill assessment. It contains graphics of meter with employee pictures. This PowerPoint template helps to display your information in a useful, simple and uncluttered way.
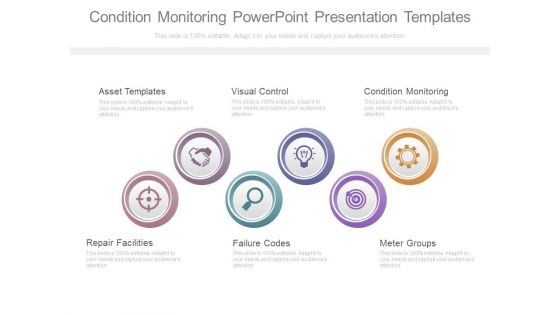
Condition Monitoring Powerpoint Presentation Templates
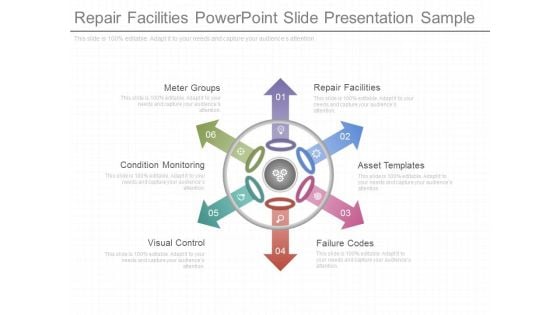
This is a condition monitoring powerpoint presentation templates. This is a six stage process. The stages in this process are asset templates, visual control, condition monitoring, repair facilities, failure codes, meter groups.
Repair Facilities Powerpoint Slide Presentation Sample
This is a repair facilities powerpoint slide presentation sample. This is a six stage process. The stages in this process are meter groups, condition monitoring, visual control, failure codes, asset templates, repair facilities.

Save Electricity Powerpoint Templates Microsoft
This is a save electricity powerpoint templates microsoft. This is a five stage process. The stages in this process are meter measures, save electricity, electricity production and consumption, excess power is exported, office solar photovoltaic array.
Business Projects Dashboard Template With Risk Status Report Template Topics PDF
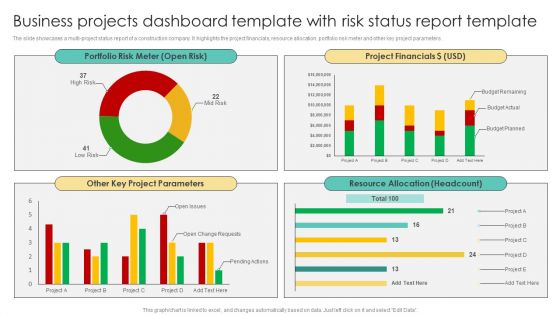
The slide showcases a multi-project status report of a construction company. It highlights the project financials, resource allocation, portfolio risk meter and other key project parameters. Pitch your topic with ease and precision using this Business Projects Dashboard Template With Risk Status Report Template Topics PDF. This layout presents information on Portfolio Risk Meter, Project Financials, Project Parameters, Resource Allocation. It is also available for immediate download and adjustment. So, changes can be made in the color, design, graphics or any other component to create a unique layout.
Mobile SEO Tool For Driving Traffic Management To Website Demonstration PDF
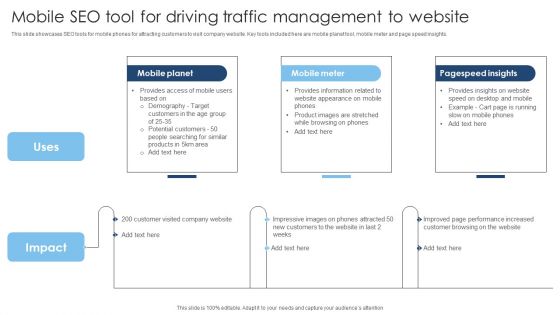
This slide showcases SEO tools for mobile phones for attracting customers to visit company website. Key tools included here are mobile planet tool, mobile meter and page speed insights. Presenting Mobile SEO Tool For Driving Traffic Management To Website Demonstration PDF to dispense important information. This template comprises three stages. It also presents valuable insights into the topics including Mobile Planet, Mobile Meter, Pagespeed Insights . This is a completely customizable PowerPoint theme that can be put to use immediately. So, download it and address the topic impactfully.

Basketball Teams Playing With Each Other At Tournament Ppt PowerPoint Presentation Visual Aids Ideas PDF
Presenting this set of slides with name customer satisfaction rating meter feedback rating scale sale services excellent ppt powerpoint presentation complete deck. The topics discussed in these slide is basketball teams playing with each other at tournament. This is a completely editable PowerPoint presentation and is available for immediate download. Download now and impress your audience.
Dashboard With Business Icons Powerpoint Slides
This PowerPoint template graphics of meter chart with business icons. Download this PPT chart to simplify business data analysis. This PowerPoint slide is of great help in the business sector to make realistic presentations and provides effective way of presenting your newer thoughts.
Managing IT Operating System Infrastructure KPI Dashboard Showing Project Revenue Diagrams PDF
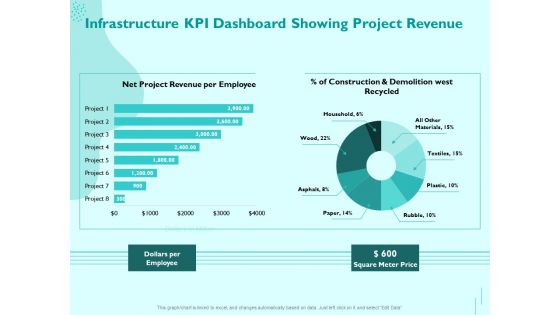
Presenting this set of slides with name managing it operating system infrastructure kpi dashboard showing project revenue diagrams pdf. The topics discussed in these slides are dollars per employee, square meter price. This is a completely editable PowerPoint presentation and is available for immediate download. Download now and impress your audience.
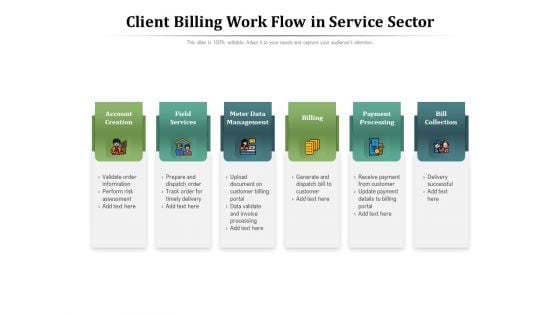
Client Billing Work Flow In Service Sector Ppt PowerPoint Presentation Layouts Slideshow PDF
Presenting this set of slides with name client billing work flow in service sector ppt powerpoint presentation layouts slideshow pdf. This is a six stage process. The stages in this process are account creation, field services, meter data management, billing payment processing, bill collection. This is a completely editable PowerPoint presentation and is available for immediate download. Download now and impress your audience.
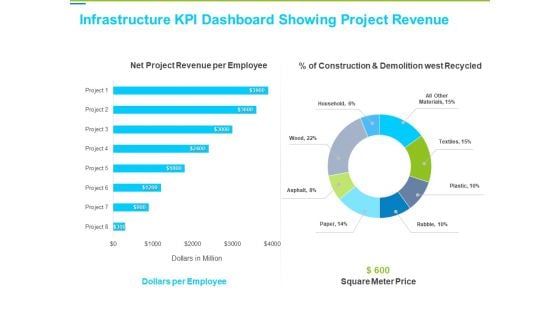
Framework Administration Infrastructure KPI Dashboard Showing Project Revenue Background PDF
Deliver an awe-inspiring pitch with this creative framework administration infrastructure kpi dashboard showing project revenue background pdf bundle. Topics like net project revenue per employee, dollars per employee, square meter price can be discussed with this completely editable template. It is available for immediate download depending on the needs and requirements of the user.
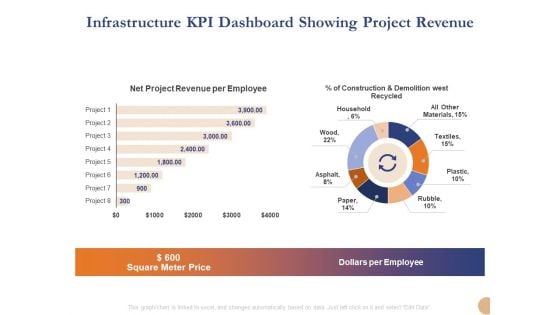
Substructure Segment Analysis Infrastructure KPI Dashboard Showing Project Revenue Summary PDF
Deliver and pitch your topic in the best possible manner with this substructure segment analysis infrastructure kpi dashboard showing project revenue summary pdf. Use them to share invaluable insights on square meter price, dollars per employee, net project revenue per employee and impress your audience. This template can be altered and modified as per your expectations. So, grab it now.
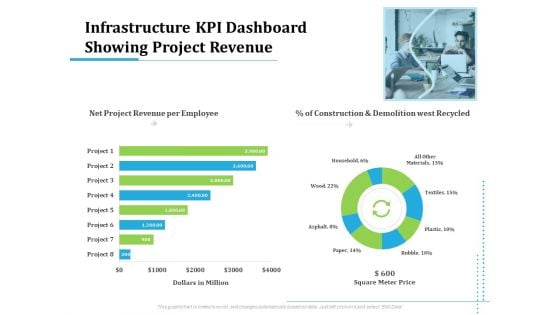
Information Technology Functions Management Infrastructure KPI Dashboard Showing Project Revenue Ppt Show Information PDF
Deliver an awe-inspiring pitch with this creative information technology functions management infrastructure kpi dashboard showing project revenue ppt show information pdf bundle. Topics like net project revenue per employee, construction and demolition west recycled, dollars million, square meter price, project can be discussed with this completely editable template. It is available for immediate download depending on the needs and requirements of the user.
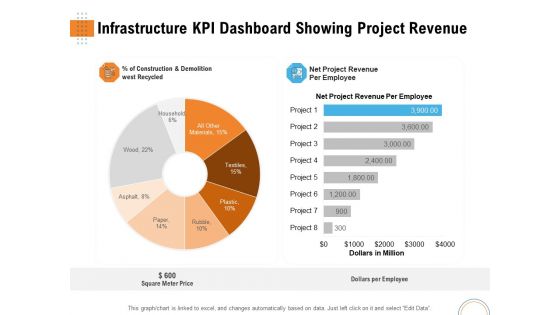
Utilizing Infrastructure Management Using Latest Methods Infrastructure KPI Dashboard Showing Project Revenue Background PDF
Deliver an awe-inspiring pitch with this creative utilizing infrastructure management using latest methods infrastructure kpi dashboard showing project revenue background pdf bundle. Topics like net project revenue per employee, construction and demolition west recycled, dollars million, square meter price, project can be discussed with this completely editable template. It is available for immediate download depending on the needs and requirements of the user.
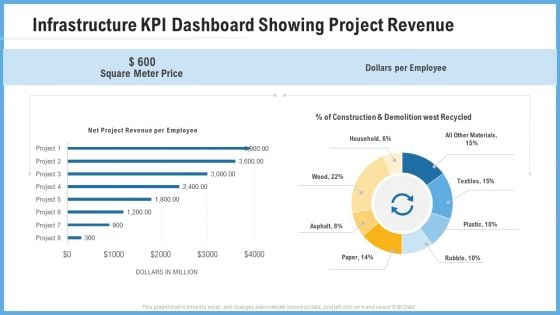
Improving Operational Activities Enterprise Infrastructure Kpi Dashboard Showing Project Revenue Professional PDF
Deliver an awe inspiring pitch with this creative improving operational activities enterprise infrastructure kpi dashboard showing project revenue professional pdf bundle. Topics like square meter price, dollars per employee can be discussed with this completely editable template. It is available for immediate download depending on the needs and requirements of the user.
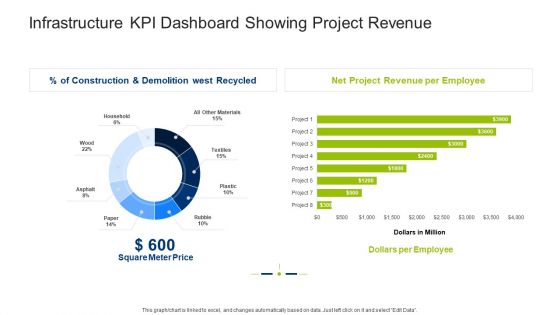
Infrastructure Building Administration Infrastructure KPI Dashboard Showing Project Revenue Clipart PDF
Deliver an awe inspiring pitch with this creative infrastructure building administration infrastructure kpi dashboard showing project revenue clipart pdf bundle. Topics like square meter price, net project revenue per employee, dollars per employee can be discussed with this completely editable template. It is available for immediate download depending on the needs and requirements of the user.
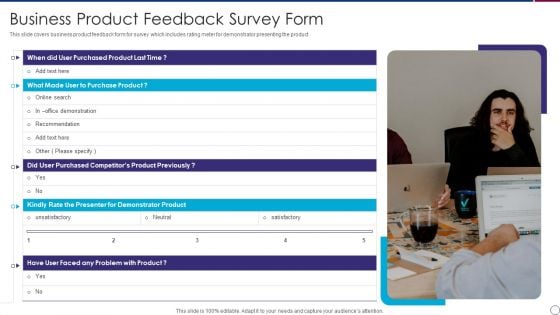
Business Product Feedback Survey Form Slides PDF
This slide covers business product feedback form for survey which includes rating meter for demonstrator presenting the product.Presenting Business Product Feedback Survey Form Slides PDF to dispense important information. This template comprises one stage. It also presents valuable insights into the topics including Purchased Product, Purchased Competitors, unsatisfactory This is a completely customizable PowerPoint theme that can be put to use immediately. So, download it and address the topic impactfully.
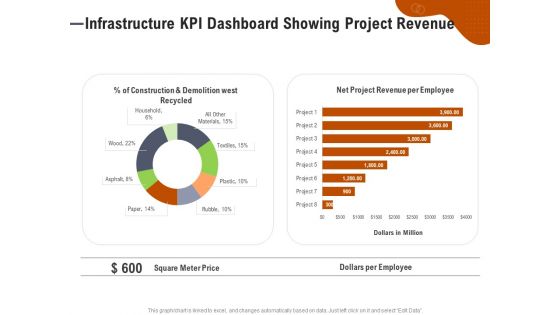
Key Features For Effective Business Management Infrastructure KPI Dashboard Showing Project Revenue Ppt Ideas File Formats PDF
Presenting this set of slides with name key features for effective business management infrastructure kpi dashboard showing project revenue ppt ideas file formats pdf. The topics discussed in these slides are construction and demolition west recycled, net project revenue per employee, square meter price, dollars per employee. This is a completely editable PowerPoint presentation and is available for immediate download. Download now and impress your audience.
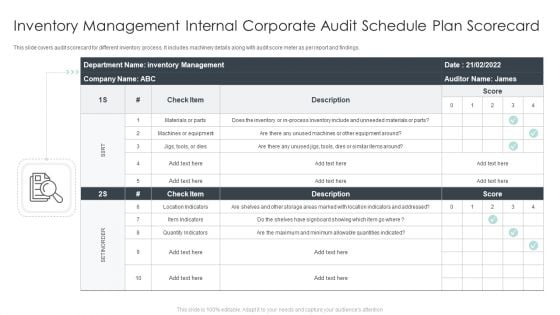
Inventory Management Internal Corporate Audit Schedule Plan Scorecard Topics PDF
This slide covers audit scorecard for different inventory process. It includes machinery details along with audit score meter as per report and findings. Showcasing this set of slides titled Inventory Management Internal Corporate Audit Schedule Plan Scorecard Topics PDF. The topics addressed in these templates are Equipment, Inventory, Materials. All the content presented in this PPT design is completely editable. Download it and make adjustments in color, background, font etc. as per your unique business setting.
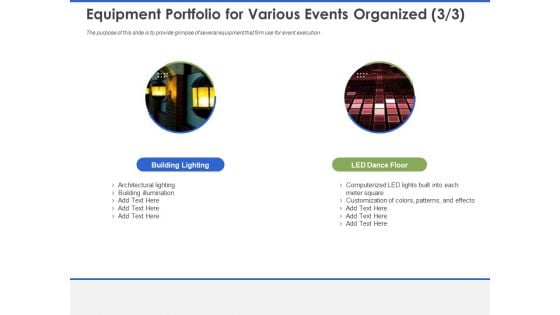
Event Management Services Equipment Portfolio For Various Events Organized Building Ppt PowerPoint Presentation Professional Show PDF
The purpose of this slide is to provide glimpse of several equipment that firm use for event execution. Deliver an awe-inspiring pitch with this creative event management services equipment portfolio for various events organized building ppt powerpoint presentation professional show pdf bundle. Topics like building lighting, led dance floor, architectural lighting, building illumination, computerized led lights built into each meter square, customization of colors, patterns, and effects can be discussed with this completely editable template. It is available for immediate download depending on the needs and requirements of the user.
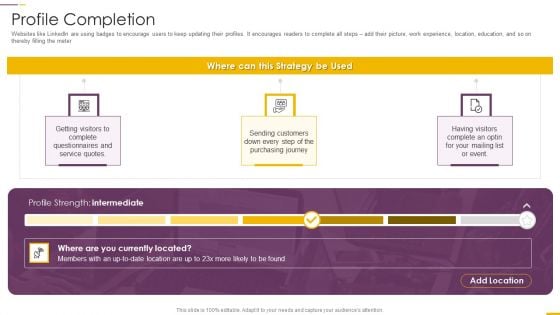
How Build Gamification Advertising Plan Profile Completion Ppt Gallery Structure PDF
Websites like LinkedIn are using badges to encourage users to keep updating their profiles. It encourages readers to complete all steps add their picture, work experience, location, education, and so on thereby filling the meter This is a how build gamification advertising plan profile completion ppt gallery structure pdf template with various stages. Focus and dispense information on three stages using this creative set, that comes with editable features. It contains large content boxes to add your information on topics like profile completion. You can also showcase facts, figures, and other relevant content using this PPT layout. Grab it now.
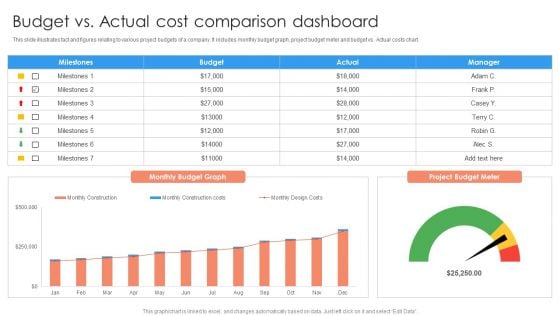
Budget Vs Actual Cost Comparison Dashboard Ppt PowerPoint Presentation Professional Format Ideas PDF
This slide illustrates fact and figures relating to various project budgets of a company. It includes monthly budget graph, project budget meter and budget vs. Actual costs chart.Pitch your topic with ease and precision using this Budget Vs Actual Cost Comparison Dashboard Ppt PowerPoint Presentation Professional Format Ideas PDF. This layout presents information on Milestones, Budget Graph, Manager. It is also available for immediate download and adjustment. So, changes can be made in the color, design, graphics or any other component to create a unique layout.
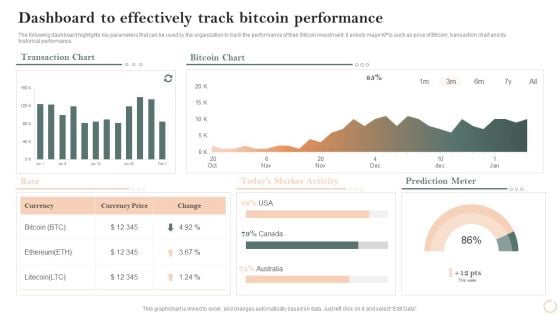
Virtual Assets Investment Guide Dashboard To Effectively Track Bitcoin Performance Rules PDF
The following dashboard highlights key parameters that can be used by the organization to track the performance of their Bitcoin investment, it enlists major KPIs such as price of Bitcoin, transaction chart and its historical performance. Deliver an awe inspiring pitch with this creative Virtual Assets Investment Guide Dashboard To Effectively Track Bitcoin Performance Rules PDF bundle. Topics like Bitcoin Chart, Transaction Chart, Prediction Meter can be discussed with this completely editable template. It is available for immediate download depending on the needs and requirements of the user.

New General Adaption Playbook For Organizations Physical Distancing Protocol Guideline For Workplace Summary PDF
This template covers physical distancing protocols for workplace such as keep 2 meter 6 feet distance between workers and between workers and the public, avoid hand contact with surfaces touched by others as much as reasonably possible etc. Deliver and pitch your topic in the best possible manner with this New General Adaption Playbook For Organizations Physical Distancing Protocol Guideline For Workplace Summary PDF. Use them to share invaluable insights on Potential, General Measures and impress your audience. This template can be altered and modified as per your expectations. So, grab it now.
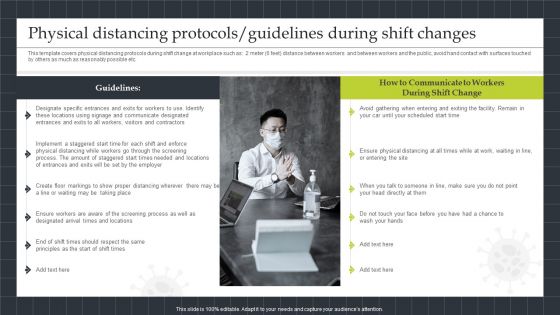
Physical Distancing Protocols Guidelines During Shift Changes Mockup PDF
This template covers physical distancing protocols during shift change at workplace such as 2 meter 6 feet distance between workers and between workers and the public, avoid hand contact with surfaces touched by others as much as reasonably possible etc. This is a Physical Distancing Protocols Guidelines During Shift Changes Mockup PDF template with various stages. Focus and dispense information on two stages using this creative set, that comes with editable features. It contains large content boxes to add your information on topics like Locations, Implement, Physical Distancing Protocols. You can also showcase facts, figures, and other relevant content using this PPT layout. Grab it now.
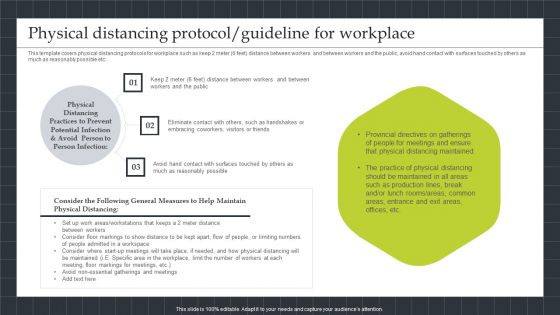
Strategic Playbook Sustaining Business During Pandemic Physical Distancing Protocol Demonstration PDF
This template covers physical distancing protocols for workplace such as keep 2 meter 6 feet distance between workers and between workers and the public, avoid hand contact with surfaces touched by others as much as reasonably possible etc. Presenting Strategic Playbook Sustaining Business During Pandemic Physical Distancing Protocol Demonstration PDF to provide visual cues and insights. Share and navigate important information on three stages that need your due attention. This template can be used to pitch topics like Physical Distancing Protocol, Guideline For Workplace. In addtion, this PPT design contains high resolution images, graphics, etc, that are easily editable and available for immediate download.

 Home
Home