Meter
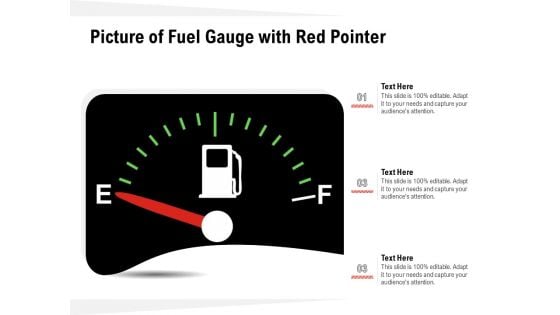
Picture Of Fuel Gauge With Red Pointer Ppt PowerPoint Presentation Show Samples PDF
Presenting picture of fuel gauge with red pointer ppt powerpoint presentation show samples pdf to dispense important information. This template comprises three stages. It also presents valuable insights into the topics including picture of fuel gauge with red pointer. This is a completely customizable PowerPoint theme that can be put to use immediately. So, download it and address the topic impactfully.

Picture Of Vehicle Dashboard With Petrol Gauge Ppt PowerPoint Presentation Portfolio Ideas PDF
Presenting picture of vehicle dashboard with petrol gauge ppt powerpoint presentation portfolio ideas pdf to dispense important information. This template comprises two stages. It also presents valuable insights into the topics including picture of vehicle dashboard with petrol gauge. This is a completely customizable PowerPoint theme that can be put to use immediately. So, download it and address the topic impactfully.
Vector Illustration Of Fuel Gauge Icon Ppt PowerPoint Presentation Layouts Graphics Design PDF
Presenting vector illustration of fuel gauge icon ppt powerpoint presentation layouts graphics design pdf to dispense important information. This template comprises three stages. It also presents valuable insights into the topics including vector illustration of fuel gauge icon. This is a completely customizable PowerPoint theme that can be put to use immediately. So, download it and address the topic impactfully.
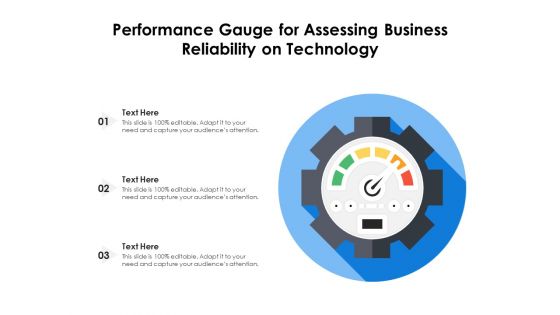
Performance Gauge For Assessing Business Reliability On Technology Ppt PowerPoint Presentation Gallery Pictures PDF
Persuade your audience using this performance gauge for assessing business reliability on technology ppt powerpoint presentation gallery pictures pdf. This PPT design covers three stages, thus making it a great tool to use. It also caters to a variety of topics including performance gauge for assessing business reliability on technology. Download this PPT design now to present a convincing pitch that not only emphasizes the topic but also showcases your presentation skills.
Vector Illustration Of Speedometer Gauge Icon Ppt PowerPoint Presentation File Outline PDF
Persuade your audience using this vector illustration of speedometer gauge icon ppt powerpoint presentation file outline pdf. This PPT design covers three stages, thus making it a great tool to use. It also caters to a variety of topics including vector illustration of speedometer gauge icon. Download this PPT design now to present a convincing pitch that not only emphasizes the topic but also showcases your presentation skills.
Self Performance Assessment Gauge Vector Icon Ppt PowerPoint Presentation Gallery Slide PDF
Persuade your audience using this self performance assessment gauge vector icon ppt powerpoint presentation gallery slide pdf. This PPT design covers three stages, thus making it a great tool to use. It also caters to a variety of topics including self performance assessment gauge vector icon. Download this PPT design now to present a convincing pitch that not only emphasizes the topic but also showcases your presentation skills.
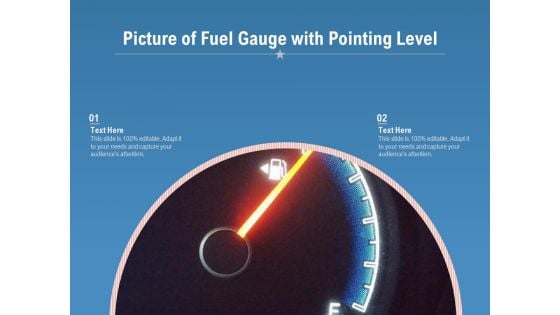
Picture Of Fuel Gauge With Pointing Level Ppt PowerPoint Presentation Infographic Template Graphics PDF
Persuade your audience using this picture of fuel gauge with pointing level ppt powerpoint presentation infographic template graphics pdf. This PPT design covers two stages, thus making it a great tool to use. It also caters to a variety of topics including picture of fuel gauge with pointing level. Download this PPT design now to present a convincing pitch that not only emphasizes the topic but also showcases your presentation skills.
Picture Of Scooter Dashboard With Fuel Gauge Ppt PowerPoint Presentation File Icon PDF
Persuade your audience using this picture of scooter dashboard with fuel gauge ppt powerpoint presentation file icon pdf. This PPT design covers four stages, thus making it a great tool to use. It also caters to a variety of topics including picture of scooter dashboard with fuel gauge. Download this PPT design now to present a convincing pitch that not only emphasizes the topic but also showcases your presentation skills.
Software Integration WBS System Integration Template Gauge Ppt PowerPoint Presentation Icon Clipart PDF
This is a software integration wbs system integration template gauge ppt powerpoint presentation icon clipart pdf template with various stages. Focus and dispense information on five stages using this creative set, that comes with editable features. It contains large content boxes to add your information on topics like gauge your readiness, understand business context, create a governance system, identify supporting applications, identify required infrastructure. You can also showcase facts, figures, and other relevant content using this PPT layout. Grab it now.
Time Gauge For Work In Progress Vector Icon Ppt Professional Graphic Tips PDF
Persuade your audience using this time gauge for work in progress vector icon ppt professional graphic tips pdf. This PPT design covers three stages, thus making it a great tool to use. It also caters to a variety of topics including time gauge for work in progress vector icon. Download this PPT design now to present a convincing pitch that not only emphasizes the topic but also showcases your presentation skills.

Stormy Weather Nature PowerPoint Template 0910
a barometer with the needle set on stormy. Get the correct coordination with our Stormy Weather Nature PowerPoint Template 0910. They blend beautifully with your thoughts.
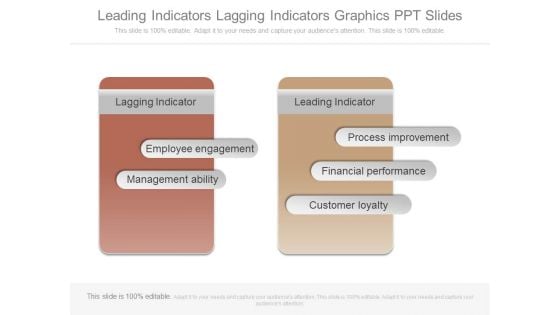
Leading Indicators Lagging Indicators Graphics Ppt Slides
This is a leading indicators lagging indicators graphics ppt slides. This is a two stage process. The stages in this process are lagging indicator, employee engagement, management ability, leading indicator, process improvement, financial performance, customer loyalty.
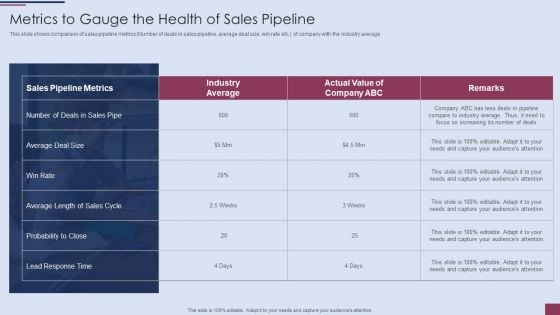
Sales Process Management To Boost Business Effectiveness Metrics To Gauge The Health Of Sales Pipeline Formats PDF
This slide shows comparison of sales pipeline metrics Number of deals in sales pipeline, average deal size, win rate etc. of company with the industry average.Deliver an awe inspiring pitch with this creative Sales Process Management To Boost Business Effectiveness Metrics To Gauge The Health Of Sales Pipeline Formats PDF bundle. Topics like Probability To Close, Average Length, Average Deal can be discussed with this completely editable template. It is available for immediate download depending on the needs and requirements of the user.

Metrics To Gauge The Health Of Sales Pipeline Sales Funnel Management Strategies To Increase Sales Elements PDF
This slide shows comparison of sales pipeline metrics Number of deals in sales pipeline, average deal size, win rate etc.of company with the industry average.Deliver an awe inspiring pitch with this creative Metrics To Gauge The Health Of Sales Pipeline Sales Funnel Management Strategies To Increase Sales Elements PDF bundle. Topics like Probability Close, Average Length, Average Deal can be discussed with this completely editable template. It is available for immediate download depending on the needs and requirements of the user.
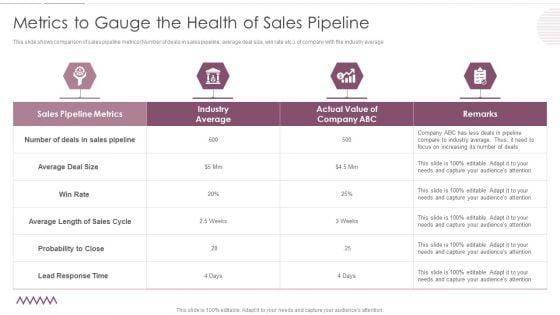
Sales Management Pipeline For Effective Lead Generation Metrics To Gauge The Health Of Sales Pipeline Information PDF
This slide shows comparison of sales pipeline metrics Number of deals in sales pipeline, average deal size, win rate etc. of company with the industry average. Deliver and pitch your topic in the best possible manner with this Sales Management Pipeline For Effective Lead Generation Metrics To Gauge The Health Of Sales Pipeline Information PDF. Use them to share invaluable insights on Average, Probability, Industry Average and impress your audience. This template can be altered and modified as per your expectations. So, grab it now.
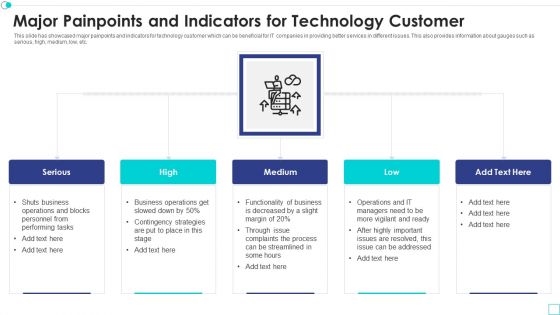
Major Painpoints And Indicators For Technology Customer Mockup PDF
This slide has showcased major painpoints and indicators for technology customer which can be beneficial for IT companies in providing better services in different issues. This also provides information about gauges such as serious, high, medium, low, etc. Persuade your audience using this major painpoints and indicators for technology customer mockup pdf. This PPT design covers five stages, thus making it a great tool to use. It also caters to a variety of topics including major painpoints and indicators for technology customer. Download this PPT design now to present a convincing pitch that not only emphasizes the topic but also showcases your presentation skills.

Our Performance Indicators Powerpoint Themes
This is a our performance indicators powerpoint themes. This is a five stage process. The stages in this process are cash flow, turnover, productivity, customer satisfaction, net income.
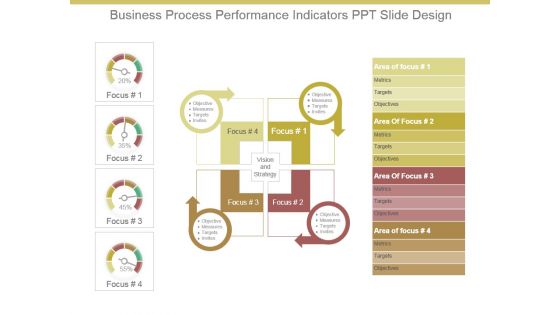
Business Process Performance Indicators Ppt Slide Design
This is a business process performance indicators ppt slide design. This is a four stage process. The stages in this process are focus, objective, measures, targets, invites, vision and strategy, area of focus, metrics, targets, objectives.
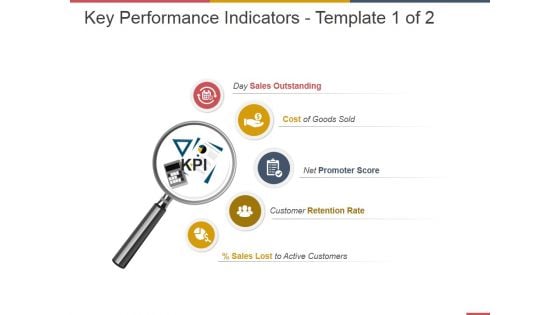
Key Performance Indicators Template 1 Ppt PowerPoint Presentation Portfolio
This is a key performance indicators template 1 ppt powerpoint presentation portfolio. This is a five stage process. The stages in this process are sales outstanding, cost of goods sold, promoter score, retention rate, active customers.
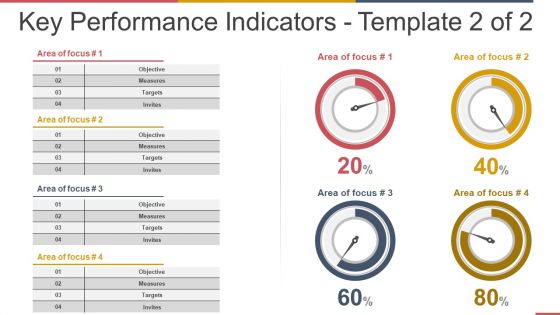
Key Performance Indicators Template 2 Ppt PowerPoint Presentation Ideas Background Images
This is a key performance indicators template 2 ppt powerpoint presentation ideas background images. This is a four stage process. The stages in this process are objective, measures, targets, invites.
Employee Key Performance Indicators Performance Indicators Report Icon Structure PDF
Showcasing this set of slides titled Employee Key Performance Indicators Performance Indicators Report Icon Structure PDF The topics addressed in these templates are Employee Key, Performance, Indicators Performance All the content presented in this PPT design is completely editable. Download it and make adjustments in color, background, font etc. as per your unique business setting.
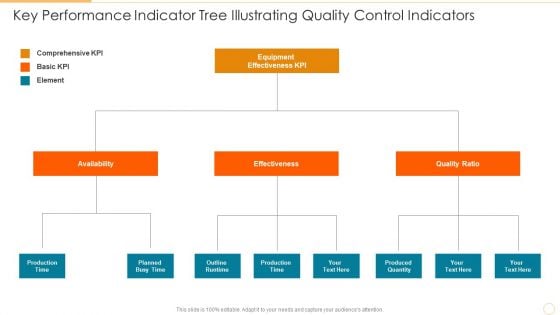
Key Performance Indicator Tree Illustrating Quality Control Indicators Information PDF
Presenting key performance indicator tree illustrating quality control indicators information pdf to dispense important information. This template comprises three stages. It also presents valuable insights into the topics including availability, effectiveness, quality ratio. This is a completely customizable PowerPoint theme that can be put to use immediately. So, download it and address the topic impactfully.
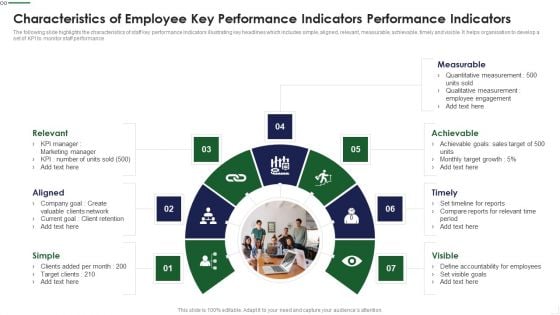
Characteristics Of Employee Key Performance Indicators Performance Indicators Guidelines PDF
The following slide highlights the characteristics of staff key performance Indicators illustrating key headlines which includes simple, aligned, relevant, measurable, achievable, timely and visible. It helps organisation to develop a set of KPI to monitor staff performance Presenting Characteristics Of Employee Key Performance Indicators Performance Indicators Guidelines PDF to dispense important information. This template comprises seven stages. It also presents valuable insights into the topics including Measurable, Achievable, Timely, Visible, Simple This is a completely customizable PowerPoint theme that can be put to use immediately. So, download it and address the topic impactfully.
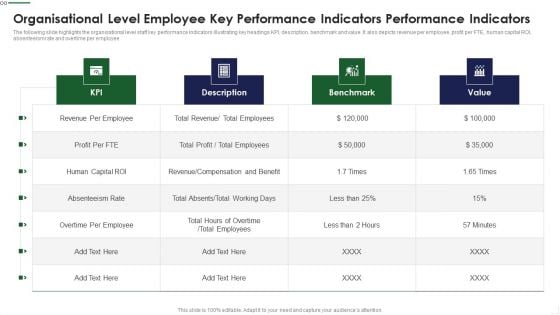
Organisational Level Employee Key Performance Indicators Performance Indicators Rules PDF
The following slide highlights the organisational level staff key performance Indicators illustrating key headings KPI, description, benchmark and value. It also depicts revenue per employee, profit per FTE, human capital ROI, absenteeism rate and overtime per employee Showcasing this set of slides titled Organisational Level Employee Key Performance Indicators Performance Indicators Rules PDF The topics addressed in these templates are Revenue Compensation, Overtime Employee, Benchmark All the content presented in this PPT design is completely editable. Download it and make adjustments in color, background, font etc. as per your unique business setting.
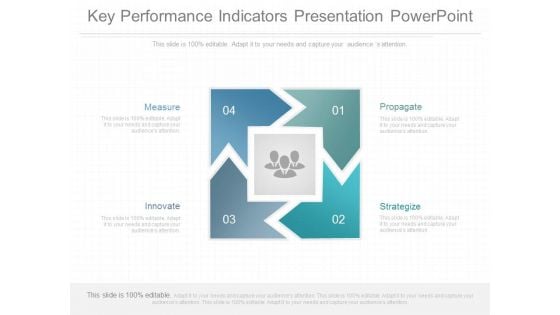
Key Performance Indicators Presentation Powerpoint
This is a key performance indicators presentation powerpoint. This is a four stage process. The stages in this process are measure, innovate, propagate, strategize.
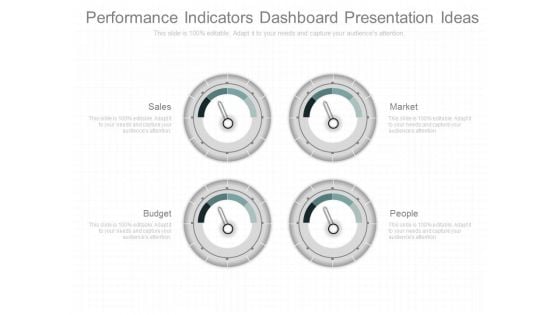
Performance Indicators Dashboard Presentation Ideas
This is a performance indicators dashboard presentation ideas. This is a four stage process. The stages in this process are sales, market, budget, people.
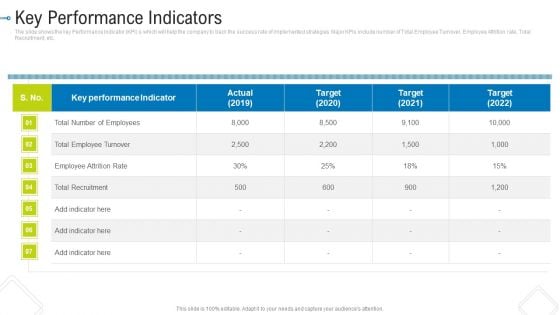
Key Performance Indicators Mockup PDF
Deliver and pitch your topic in the best possible manner with this key performance indicators mockup pdf. Use them to share invaluable insights on total number of employees, employee attrition rate, key performance indicator and impress your audience. This template can be altered and modified as per your expectations. So, grab it now.
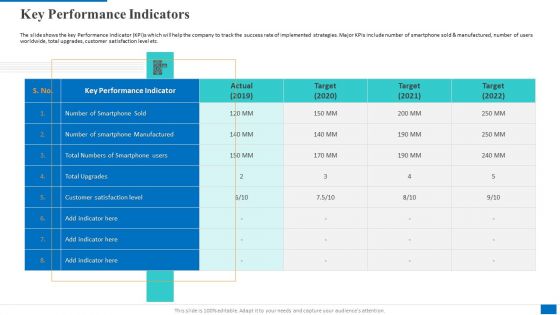
Key Performance Indicators Microsoft PDF
Deliver and pitch your topic in the best possible manner with this key performance indicators microsoft pdf. Use them to share invaluable insights on total numbers of smartphone users, key performance indicator, customer satisfaction level and impress your audience. This template can be altered and modified as per your expectations. So, grab it now.
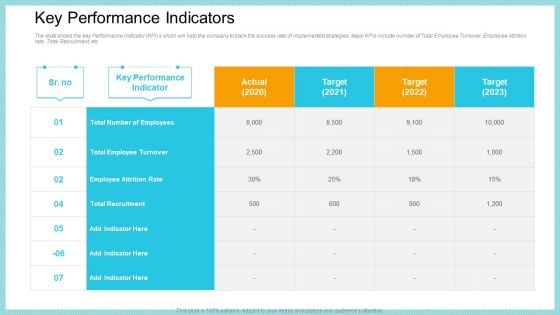
Key Performance Indicators Guidelines PDF
The slide shows the key Performance Indicator KPI s which will help the company to track the success rate of implemented strategies. Major KPIs include number of Total Employee Turnover, Employee Attrition rate, Total Recruitment, etc. Deliver and pitch your topic in the best possible manner with this key performance indicators guidelines pdf. Use them to share invaluable insights on target, recruitment, performance and impress your audience. This template can be altered and modified as per your expectations. So, grab it now.
Finance Management Metrics Ppt Slide Templates
This is a finance management metrics ppt slide templates. This is a nine stage process. The stages in this process are business, marketing, management, table.
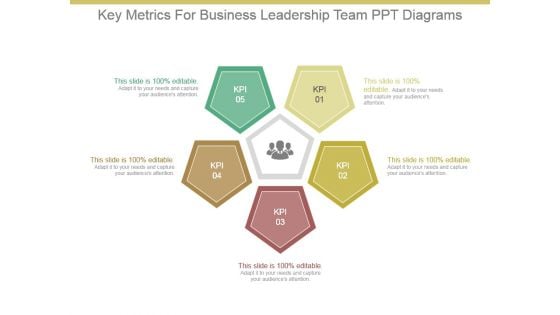
Key Metrics For Business Leadership Team Ppt Diagrams
This is a key metrics for business leadership team ppt diagrams. This is a five stage process. The stages in this process are kpi.
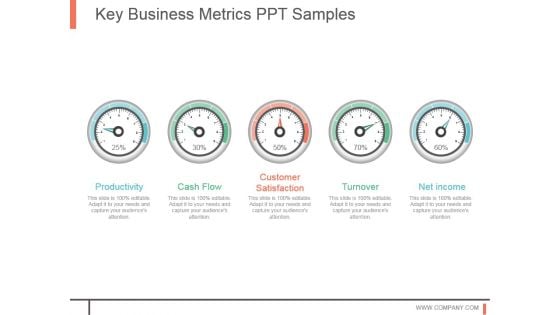
Key Business Metrics Ppt Samples
This is a key business metrics ppt samples. This is a five stage process. The stages in this process are productivity, cash flow, customer satisfaction, turnover, net income.
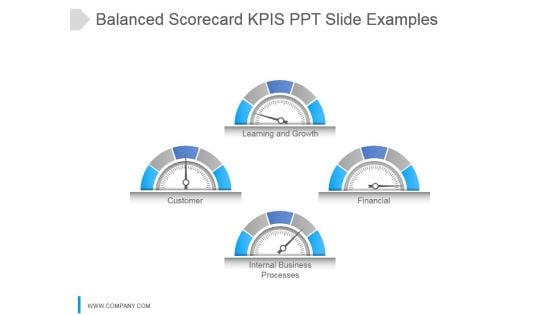
Balanced Scorecard Kpi S Ppt Slide Examples
This is a balanced scorecard kpi s ppt slide examples. This is a four stage process. The stages in this process are learning and growth, customer, financial, internal business processes.

Customer Satisfaction Framework Ppt Slide
This is a customer satisfaction framework ppt slide. This is a seven stage process. The stages in this process are task items, item.
Business Performance Measures Powerpoint Slide
This is a business performance measures powerpoint slide designs. This is a three stage process. The stages in this process are business, marketing, performance, presentation, management.
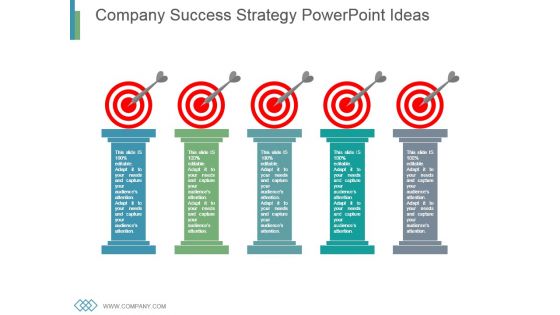
Company Success Strategy Powerpoint Ideas
This is a company success strategy powerpoint ideas. This is a five stage process. The stages in this process are business, marketing, success, strategy, target.
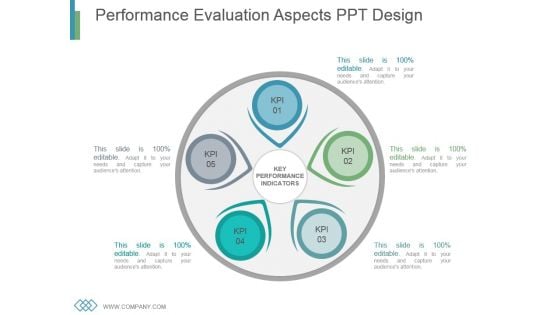
Performance Evaluation Aspects Ppt Design
This is a performance evaluation aspects ppt design. This is a five stage process. The stages in this process are business, marketing, process, strategy, management.

Business Improvement Metrics Example Ppt Presentation
This is a business improvement metrics example ppt presentation. This is a four stage process. The stages in this process are focus, area of focus, metrics, targets, objectives.
Company Accounts Planning Strategy Powerpoint Guide
This is a company accounts planning strategy powerpoint guide. This is a four stage process. The stages in this process are goal, target, planning, strategy, company.
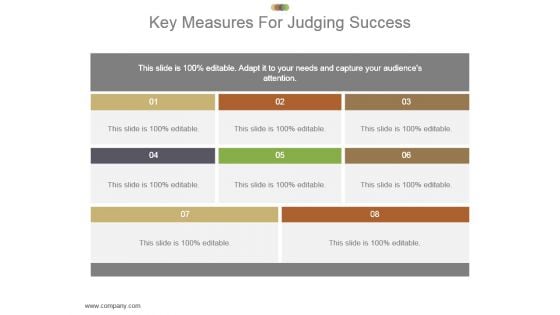
Key Measures For Judging Success Powerpoint Slide Ideas
This is a key measures for judging success powerpoint slide ideas. This is a eight stage process. The stages in this process are marketing, management, strategy, success, business.
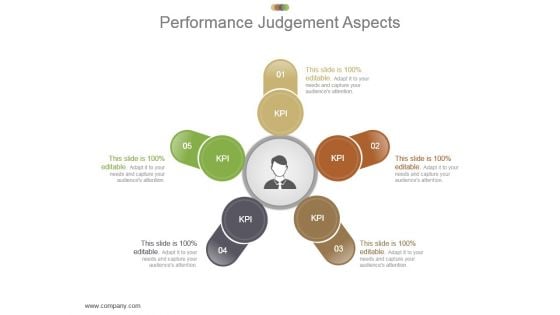
Performance Judgement Aspects Powerpoint Slide Information
This is a performance judgement aspects powerpoint slide information. This is a five stage process. The stages in this process are process, management, strategy, business, marketing.
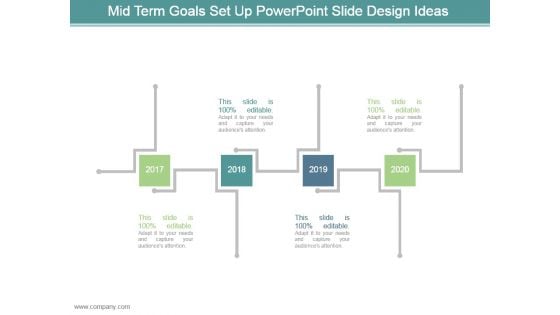
Mid Term Goals Set Up Powerpoint Slide Design Ideas
This is a mid term goals set up powerpoint slide design ideas. This is a four stage process. The stages in this process are arrows, business, marketing, planning, years.

Setting Short Term Goals Powerpoint Slide Graphics
This is a setting short term goals powerpoint slide graphics. This is a five stage process. The stages in this process are february, january, march, may, april.
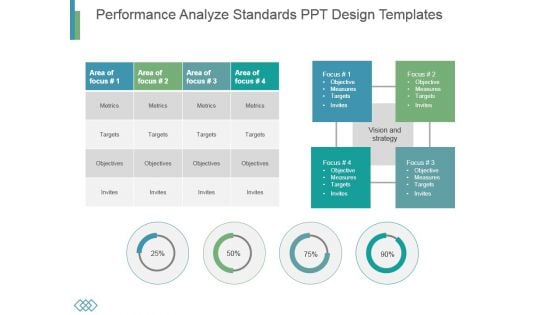
Performance Analyze Standards Ppt Design Templates
This is a performance analyze standards ppt design templates. This is a four stage process. The stages in this process are metrics, targets, objectives, invites.
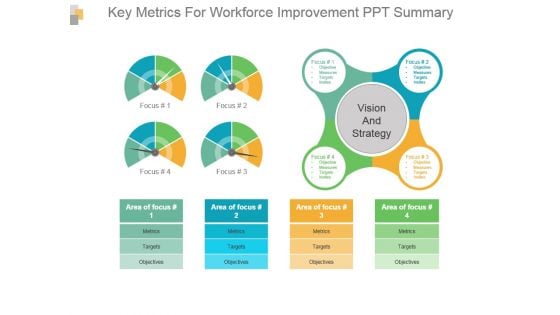
Key Metrics For Workforce Improvement Ppt Summary
This is a key metrics for workforce improvement ppt summary. This is a four stage process. The stages in this process are vision and strategy, metrics, targets, objectives, area of focus.
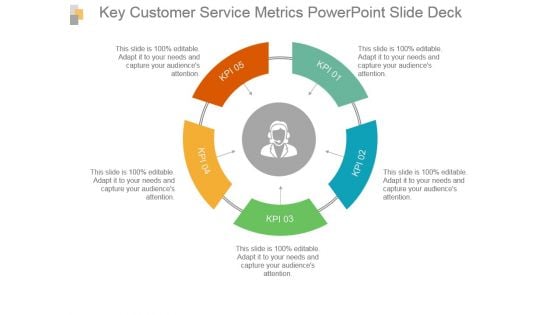
Key Customer Service Metrics Powerpoint Slide Deck
This is a key customer service metrics powerpoint slide deck. This is a five stage process. The stages in this process are process, management, arrow, marketing, strategy.
Key Metrics For Finance Unit Presentation Images
This is a key metrics for finance unit presentation images. This is a three stage process. The stages in this process are business, management, strategy, finance unit, marketing.
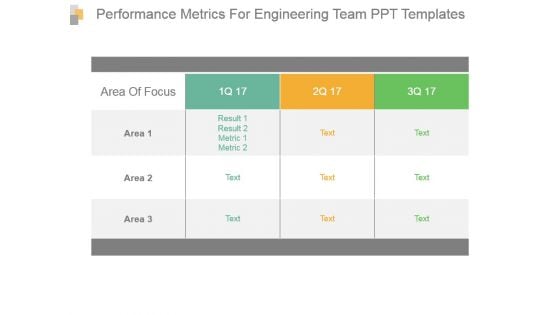
Performance Metrics For Engineering Team Ppt Templates
This is a performance metrics for engineering team ppt templates. This is a three stage process. The stages in this process are area of focus, result, area.
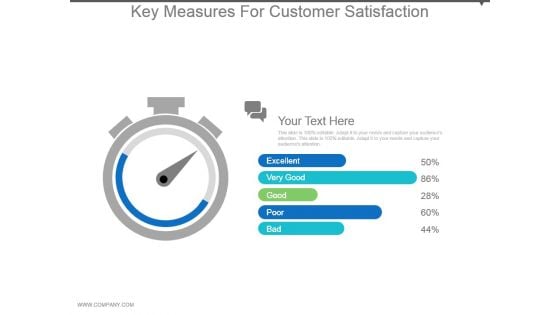
Key Measures For Customer Satisfaction Powerpoint Templates
This is a key measures for customer satisfaction powerpoint templates. This is a one stage process. The stages in this process are excellent, very good, good, poor, bad.
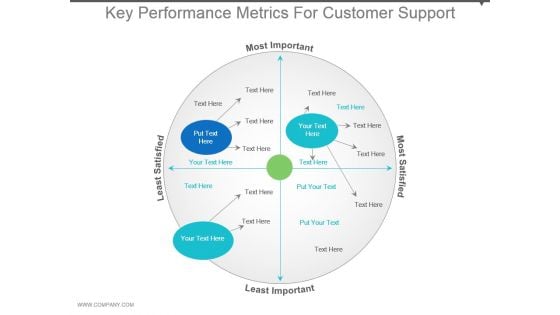
Key Performance Metrics For Customer Support Powerpoint Templates
This is a key performance metrics for customer support powerpoint templates. This is a one stage process. The stages in this process are most important, least satisfied, least important, most satisfied.
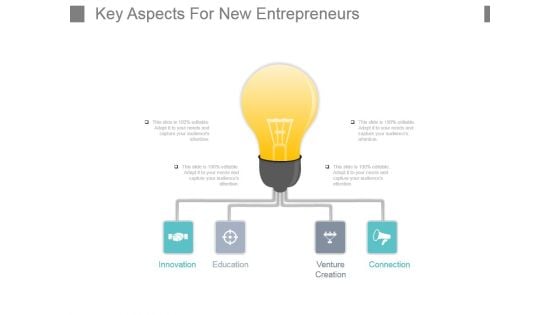
Key Aspects For New Entrepreneurs Powerpoint Slide Ideas
This is a key aspects for new entrepreneurs powerpoint slide ideas. This is a four stage process. The stages in this process are innovation, education, venture creation, connection.
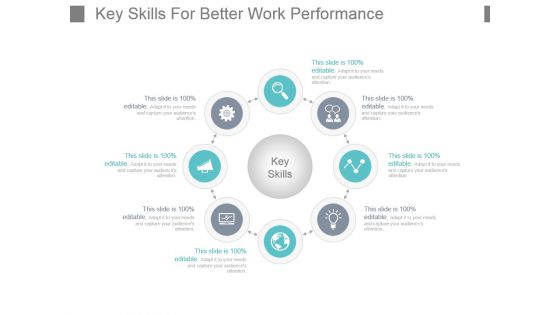
Key Skills For Better Work Performance Powerpoint Shapes
This is a key skills for better work performance powerpoint shapes. This is a four stage process. The stages in this process are key skills, flow, process, circle, icons.
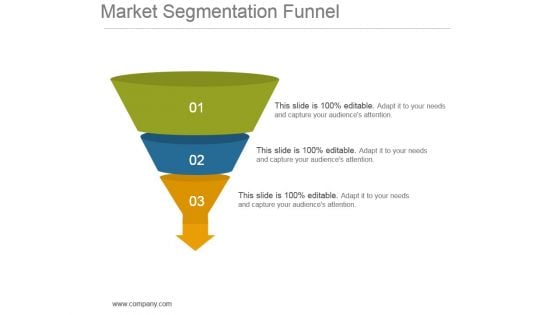
Market Segmentation Funnel Example Of Ppt Presentation
This is a market segmentation funnel example of ppt presentation. This is a three stage process. The stages in this process are funnel, business, filter, marketing, arrow.
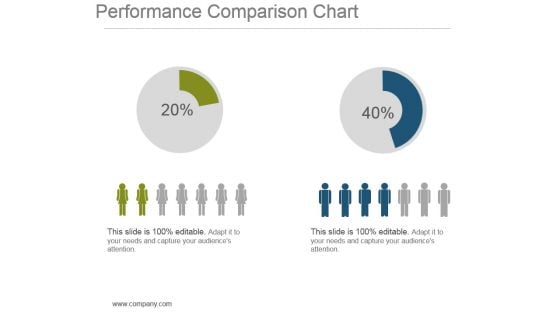
Performance Comparison Chart Powerpoint Show
This is a performance comparison chart powerpoint show. This is a two stage process. The stages in this process are finance, compare, strategy, management, planning.
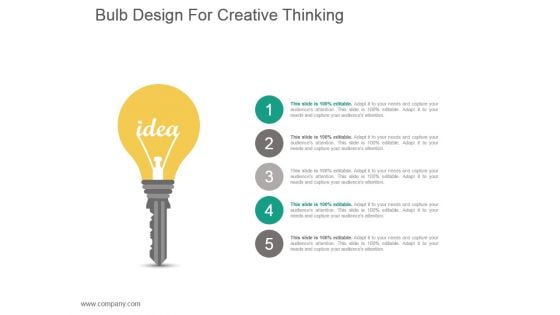
Bulb Design For Creative Thinking Process Powerpoint Ideas
This is a bulb design for creative thinking process powerpoint ideas. This is a five stage process. The stages in this process are idea bulls, security, business, strategy, success.
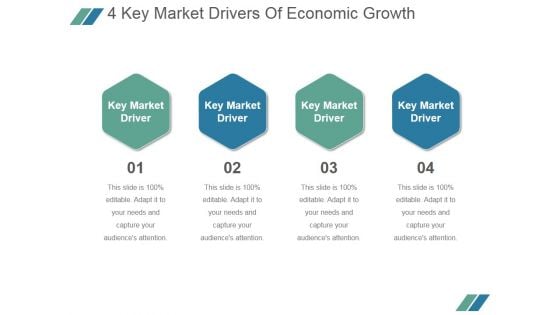
4 Key Market Drivers Of Economic Growth Ppt PowerPoint Presentation Templates
This is a 4 key market drivers of economic growth ppt powerpoint presentation templates. This is a four stage process. The stages in this process are key market driver.
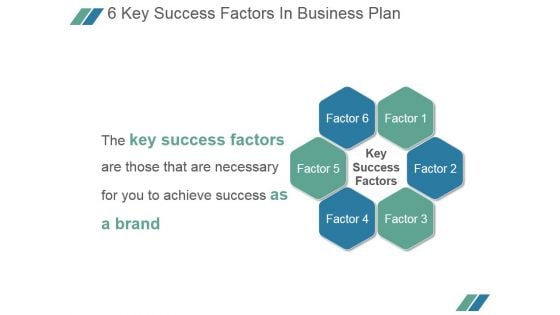
6 Key Success Factors In Business Plan Ppt PowerPoint Presentation Microsoft
This is a 6 key success factors in business plan ppt powerpoint presentation microsoft. This is a six stage process. The stages in this process are key success factors, factor.
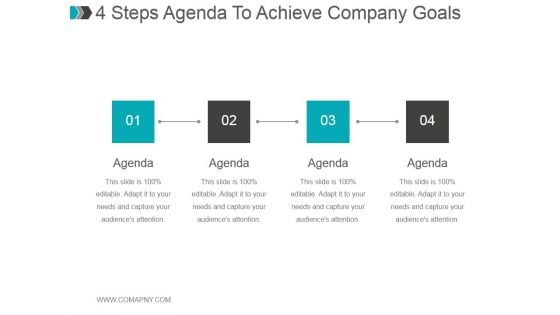
4 Steps Agenda To Achieve Company Goals Ppt PowerPoint Presentation Inspiration
This is a 4 steps agenda to achieve company goals ppt powerpoint presentation inspiration. This is a four stage process. The stages in this process are business, agenda, strategy, analysis, success.
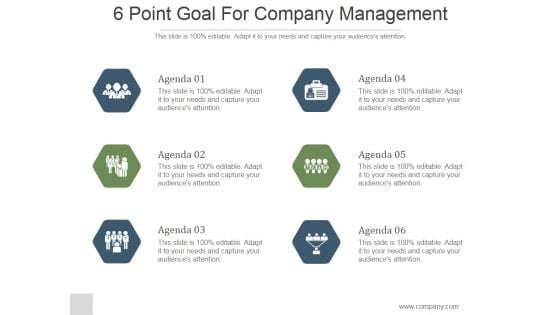
6 Point Goal For Company Management Ppt PowerPoint Presentation Slide
This is a 6 point goal for company management ppt powerpoint presentation slide. This is a six stage process. The stages in this process are agenda, business, strategy, icons, hexagon, marketing.
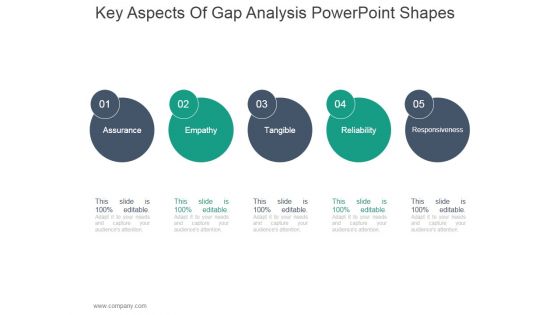
Key Aspects Of Gap Analysis Ppt PowerPoint Presentation Guide
This is a key aspects of gap analysis ppt powerpoint presentation guide. This is a five stage process. The stages in this process are assurance, empathy, tangible, reliability, responsiveness.

 Home
Home