Metric Comparison
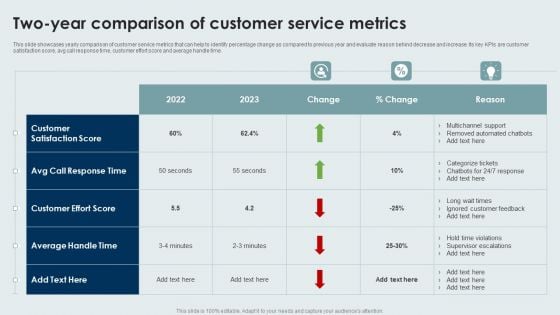
Two Year Comparison Of Customer Service Metrics Information PDF
This slide showcases yearly comparison of customer service metrics that can help to identify percentage change as compared to previous year and evaluate reason behind decrease and increase. Its key KPIs are customer satisfaction score, avg call response time, customer effort score and average handle time. Pitch your topic with ease and precision using this Two Year Comparison Of Customer Service Metrics Information PDF. This layout presents information on Customer Effort Score, Customer Satisfaction Score, Average Handle Time. It is also available for immediate download and adjustment. So, changes can be made in the color, design, graphics or any other component to create a unique layout.

Client Self Service Metric Dashboard Brochure Pdf
The following slide highlights dashboard for customer self service to limit repetitive questions and facilitate support staff to handle complex issues. It includes components such as self service score, unique customers who survey help content, unique customers who produced tickets etc. Pitch your topic with ease and precision using this Client Self Service Metric Dashboard Brochure Pdf. This layout presents information on Self Service Score, Published, Content Type. It is also available for immediate download and adjustment. So, changes can be made in the color, design, graphics or any other component to create a unique layout. The following slide highlights dashboard for customer self service to limit repetitive questions and facilitate support staff to handle complex issues. It includes components such as self service score, unique customers who survey help content, unique customers who produced tickets etc.

Comparison Chart For Performance Analysis Ppt Design
This is a comparison chart for performance analysis ppt design. This is a two stage process. The stages in this process are compare, scale, measurement, business, marketing.

Companys Performance Comparison Before And After Strategy Implementation Professional PDF
This slide shows the comparison of companys performance before and after the product marketing strategy implementation. It shows the comparison based on parameters such as number of product sold, total sale, lead conversion rate, customer retention rate, per customer acquisition cost etc. If you are looking for a format to display your unique thoughts, then the professionally designed Companys Performance Comparison Before And After Strategy Implementation Professional PDF is the one for you. You can use it as a Google Slides template or a PowerPoint template. Incorporate impressive visuals, symbols, images, and other charts. Modify or reorganize the text boxes as you desire. Experiment with shade schemes and font pairings. Alter, share or cooperate with other people on your work. Download Companys Performance Comparison Before And After Strategy Implementation Professional PDF and find out how to give a successful presentation. Present a perfect display to your team and make your presentation unforgettable.
Customer NPS Metric Ppt PowerPoint Presentation Complete Deck With Slides
Boost your confidence and team morale with this well-structured Customer NPS Metric Ppt PowerPoint Presentation Complete Deck With Slides. This prefabricated set gives a voice to your presentation because of its well-researched content and graphics. Our experts have added all the components very carefully, thus helping you deliver great presentations with a single click. Not only that, it contains a set of seventeen slides that are designed using the right visuals, graphics, etc. Various topics can be discussed, and effective brainstorming sessions can be conducted using the wide variety of slides added in this complete deck. Apart from this, our PPT design contains clear instructions to help you restructure your presentations and create multiple variations. The color, format, design anything can be modified as deemed fit by the user. Not only this, it is available for immediate download. So, grab it now.
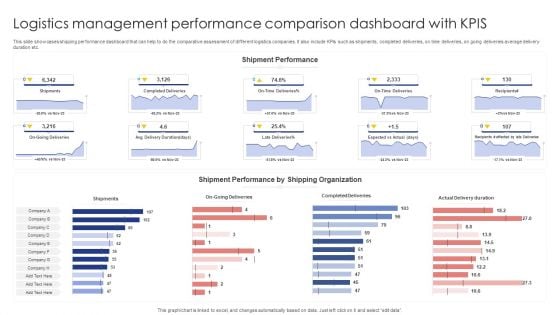
Logistics Management Performance Comparison Dashboard With Kpis Sample PDF
This slide showcases shipping performance dashboard that can help to do the comparative assessment of different logistics companies. It also include KPIs such as shipments, completed deliveries, on time deliveries, on going deliveries average delivery duration etc. Pitch your topic with ease and precision using this Logistics Management Performance Comparison Dashboard With Kpis Sample PDF. This layout presents information on Shipments, Completed Deliveries, Actual Delivery Duration. It is also available for immediate download and adjustment. So, changes can be made in the color, design, graphics or any other component to create a unique layout.
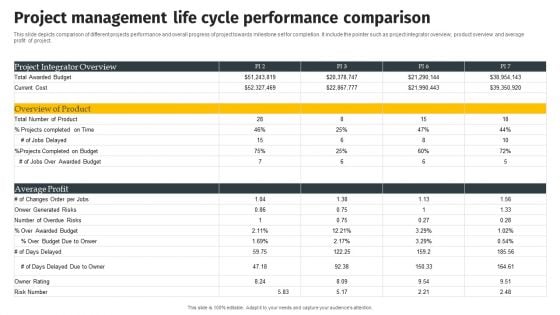
Project Management Life Cycle Performance Comparison Mockup PDF
This slide depicts comparison of different projects performance and overall progress of project towards milestone set for completion. It include the pointer such as project integrator overview, product overview and average profit of project. Pitch your topic with ease and precision using this Project Management Life Cycle Performance Comparison Mockup PDF. This layout presents information on Project Integrator Overview, Overview Of Product, Cycle Performance Comparison. It is also available for immediate download and adjustment. So, changes can be made in the color, design, graphics or any other component to create a unique layout.
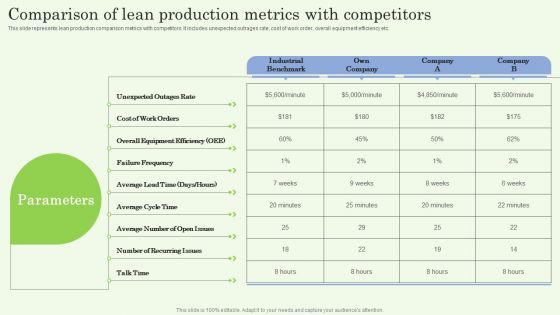
Comparison Of Lean Production Metrics With Competitors Ppt PowerPoint Presentation Diagram Lists PDF
This slide represents lean production comparison metrics with competitors. It includes unexpected outrages rate, cost of work order, overall equipment efficiency etc. Get a simple yet stunning designed Comparison Of Lean Production Metrics With Competitors Ppt PowerPoint Presentation Diagram Lists PDF. It is the best one to establish the tone in your meetings. It is an excellent way to make your presentations highly effective. So, download this PPT today from Slidegeeks and see the positive impacts. Our easy to edit Comparison Of Lean Production Metrics With Competitors Ppt PowerPoint Presentation Diagram Lists PDF can be your go to option for all upcoming conferences and meetings. So, what are you waiting for Grab this template today.
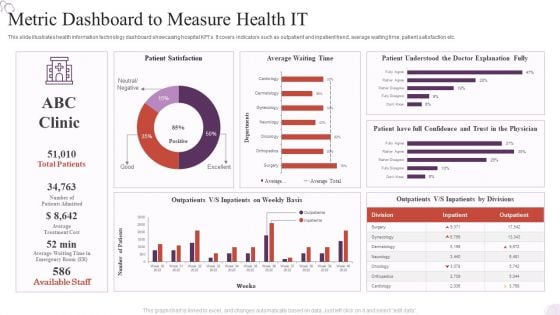
Metric Dashboard To Measure Health IT Background PDF
Pitch your topic with ease and precision using this Metric Dashboard To Measure Health IT Background PDF. This layout presents information on Metric Dashboard, Patient Satisfaction, Average Waiting Time. It is also available for immediate download and adjustment. So, changes can be made in the color, design, graphics or any other component to create a unique layout.

Website Data Yearly Comparison With Percentage Change Formats PDF
This slide showcases yearly comparison table that can help organization to identify the change in current year website statistics as compared to previous year. Its key metrics are total traffic, conversion rate, pages or session, pageviews and bounce rate. Pitch your topic with ease and precision using this Website Data Yearly Comparison With Percentage Change Formats PDF. This layout presents information on Website Data Yearly Comparison With Percentage Change. It is also available for immediate download and adjustment. So, changes can be made in the color, design, graphics or any other component to create a unique layout.

Metric Dashboard To Track Supplier Diversity And Performance Designs PDF
This slide represents KPI dashboard for tracking supplier diversity in organization and measure performance. It provides information regarding organization spending cost, supplier count, diversity type, status etc. Pitch your topic with ease and precision using this Metric Dashboard To Track Supplier Diversity And Performance Designs PDF. This layout presents information on Diversity Type, Diversity Status, Diverse Supplier. It is also available for immediate download and adjustment. So, changes can be made in the color, design, graphics or any other component to create a unique layout.
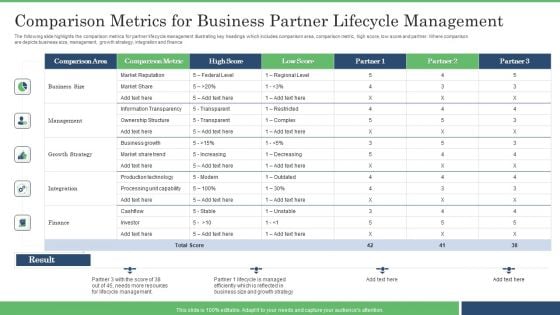
Comparison Metrics For Business Partner Lifecycle Management Guidelines PDF
The following slide highlights the comparison metrics for partner lifecycle management illustrating key headings which includes comparison area, comparison metric, high score, low score and partner. Where comparison are depicts business size, management, growth strategy, integration and finance. Pitch your topic with ease and precision using this Comparison Metrics For Business Partner Lifecycle Management Guidelines PDF. This layout presents information on Business Size, Management, Growth Strategy. It is also available for immediate download and adjustment. So, changes can be made in the color, design, graphics or any other component to create a unique layout.
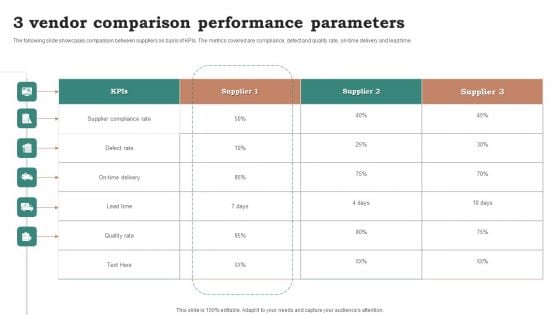
3 Vendor Comparison Performance Parameters Ppt Portfolio Topics PDF
The following slide showcases comparison between suppliers on basis of KPIs. The metrics covered are compliance, defect and quality rate, on-time delivery and lead time. Pitch your topic with ease and precision using this 3 Vendor Comparison Performance Parameters Ppt Portfolio Topics PDF. This layout presents information on Supplier Compliance Rate, Defect Rate, Lead Time. It is also available for immediate download and adjustment. So, changes can be made in the color, design, graphics or any other component to create a unique layout.
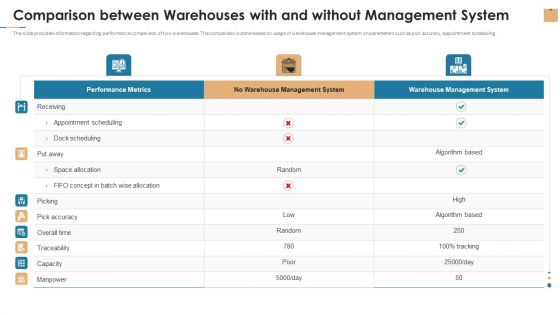
Comparison Between Warehouses With And Without Management System Rules PDF
The slide provides information regarding performance comparison of two warehouses. The comparison is done based on usage of warehouse management system on parameters such as pick accuracy, appointment scheduling. Deliver an awe inspiring pitch with this creative comparison between warehouses with and without management system rules pdf bundle. Topics like performance metrics, warehouse management system, capacity can be discussed with this completely editable template. It is available for immediate download depending on the needs and requirements of the user.
Sales Performance Comparison Graph Of Top Customer Icons PDF
This slide shows the customer sales comparison graph along with the units of product purchased by the clients. Showcasing this set of slides titled Sales Performance Comparison Graph Of Top Customer Icons PDF. The topics addressed in these templates are Highest Units, Customer, Product. All the content presented in this PPT design is completely editable. Download it and make adjustments in color, background, font etc. as per your unique business setting.
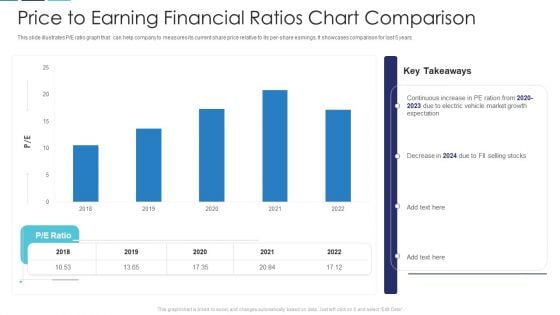
Price To Earning Financial Ratios Chart Comparison Slides PDF
This slide illustrates P or E ratio graph that can help company to measures its current share price relative to its per-share earnings. It showcases comparison for last 5 years Showcasing this set of slides titled price to earning financial ratios chart comparison slides pdf. The topics addressed in these templates are price to earning financial ratios chart comparison. All the content presented in this PPT design is completely editable. Download it and make adjustments in color, background, font etc. as per your unique business setting.
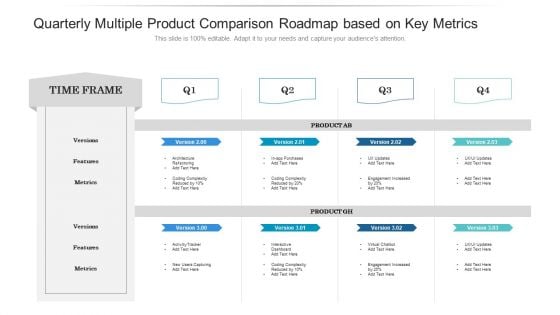
Quarterly Multiple Product Comparison Roadmap Based On Key Metrics Structure
Introducing our quarterly multiple product comparison roadmap based on key metrics structure. This PPT presentation is Google Slides compatible, therefore, you can share it easily with the collaborators for measuring the progress. Also, the presentation is available in both standard screen and widescreen aspect ratios. So edit the template design by modifying the font size, font type, color, and shapes as per your requirements. As this PPT design is fully editable it can be presented in PDF, JPG and PNG formats.
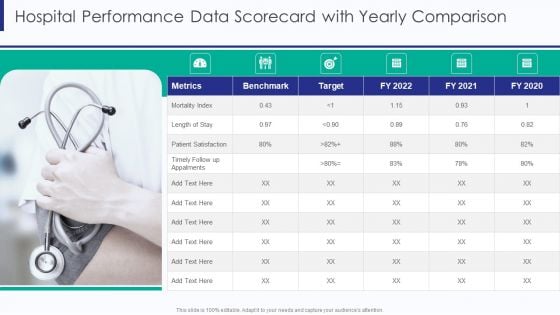
Healthcare Hospital Performance Data Scorecard With Yearly Comparison Ppt Model Templates PDF
Deliver and pitch your topic in the best possible manner with this Healthcare Hospital Performance Data Scorecard With Yearly Comparison Ppt Model Templates PDF. Use them to share invaluable insights on Mortality Index Metrics, Patient Satisfaction Target, Length Of Stay and impress your audience. This template can be altered and modified as per your expectations. So, grab it now.
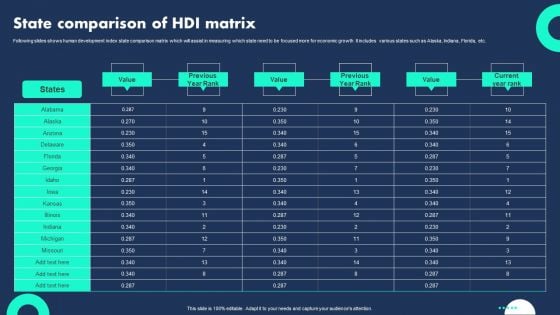
State Comparison Of HDI Matrix Introduction PDF
Following slides shows human development index state comparison matrix which will assist in measuring which state need to be focused more for economic growth It includes various states such as Alaska, Indiana, Florida, etc. Showcasing this set of slides titled State Comparison Of HDI Matrix Introduction PDF. The topics addressed in these templates are State Comparison, Value, Hdi Matrix . All the content presented in this PPT design is completely editable. Download it and make adjustments in color, background, font etc. as per your unique business setting.
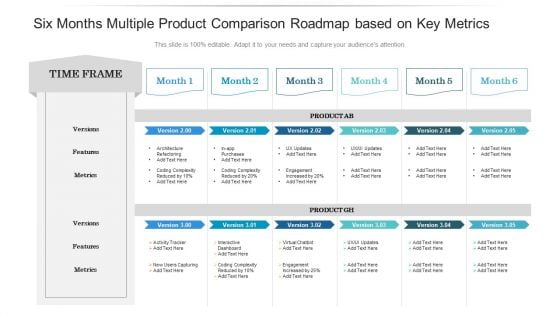
Six Months Multiple Product Comparison Roadmap Based On Key Metrics Infographics
Introducing our six months multiple product comparison roadmap based on key metrics infographics. This PPT presentation is Google Slides compatible, therefore, you can share it easily with the collaborators for measuring the progress. Also, the presentation is available in both standard screen and widescreen aspect ratios. So edit the template design by modifying the font size, font type, color, and shapes as per your requirements. As this PPT design is fully editable it can be presented in PDF, JPG and PNG formats.
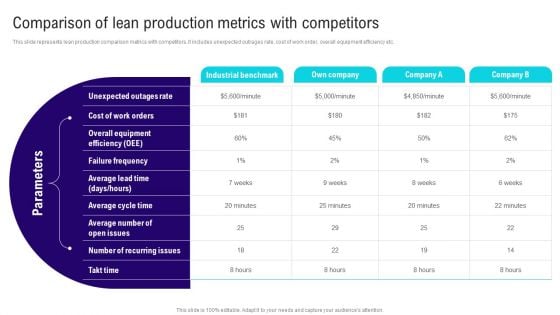
Implementing Lean Production Tool And Techniques Comparison Of Lean Production Metrics Introduction PDF
This slide represents lean production comparison metrics with competitors. It includes unexpected outrages rate, cost of work order, overall equipment efficiency etc. Crafting an eye catching presentation has never been more straightforward. Let your presentation shine with this tasteful yet straightforward Implementing Lean Production Tool And Techniques Comparison Of Lean Production Metrics Introduction PDF template. It offers a minimalistic and classy look that is great for making a statement. The colors have been employed intelligently to add a bit of playfulness while still remaining professional. Construct the ideal Implementing Lean Production Tool And Techniques Comparison Of Lean Production Metrics Introduction PDF that effortlessly grabs the attention of your audience. Begin now and be certain to wow your customers.
Lead Tracking Dashboard With Metric Comparison Brochure PDF
This slide showcases dashboard of lead pipeline that can help to identify total number of leads generated and expenses incurred to acquire the audience. It also showcases other key performance metrics like lead breakdown by status and number of leads per month. Pitch your topic with ease and precision using this Lead Tracking Dashboard With Metric Comparison Brochure PDF. This layout presents information on Metric Comparison, Lead Pipeline, Lead Breakdown Status. It is also available for immediate download and adjustment. So, changes can be made in the color, design, graphics or any other component to create a unique layout.
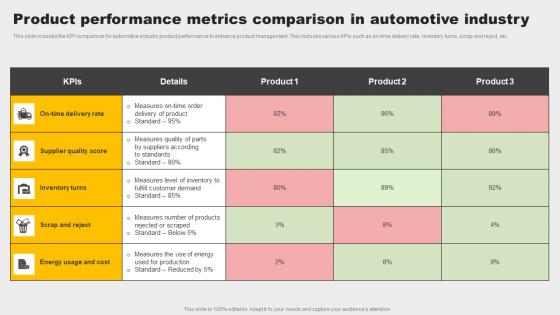
Product Performance Metrics Comparison In Automotive Industry Topics Pdf
This slide includes the KPI comparison for automotive industry product performance to enhance product management. This includes various KPIs such as on time delivery rate, inventory turns, scrap and reject, etc. Showcasing this set of slides titled Product Performance Metrics Comparison In Automotive Industry Topics Pdf. The topics addressed in these templates are Inventory Turns, Supplier Quality Score, Energy Usage And Cost. All the content presented in this PPT design is completely editable. Download it and make adjustments in color, background, font etc. as per your unique business setting. This slide includes the KPI comparison for automotive industry product performance to enhance product management. This includes various KPIs such as on time delivery rate, inventory turns, scrap and reject, etc.
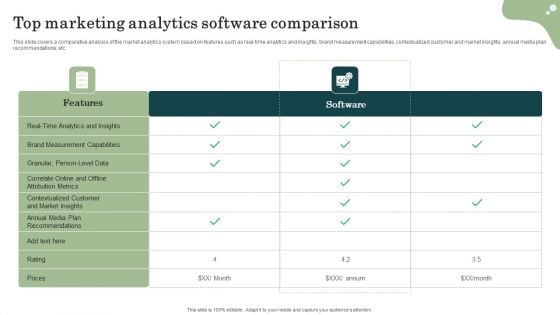
Marketing Success Metrics Top Marketing Analytics Software Comparison Template PDF
This slide covers a comparative analysis of the market analytics system based on features such as real-time analytics and insights, brand measurement capabilities, contextualized customer and market insights, annual media plan recommendations, etc. Create an editable Marketing Success Metrics Top Marketing Analytics Software Comparison Template PDF that communicates your idea and engages your audience. Whether youre presenting a business or an educational presentation, pre-designed presentation templates help save time. Marketing Success Metrics Top Marketing Analytics Software Comparison Template PDF is highly customizable and very easy to edit, covering many different styles from creative to business presentations. Slidegeeks has creative team members who have crafted amazing templates. So, go and get them without any delay.
Comparison Metrics Of Digital And Offline Marketing Ppt Icon Format PDF
This slide showcases essential key performance indicators of online and offline marketing. Key metrics covered are spend, lead generated, revenue and customer retention. Persuade your audience using this Comparison Metrics Of Digital And Offline Marketing Ppt Icon Format PDF. This PPT design covers four stages, thus making it a great tool to use. It also caters to a variety of topics including Lead Generated, Revenue, Customer Retention, Spend. Download this PPT design now to present a convincing pitch that not only emphasizes the topic but also showcases your presentation skills.
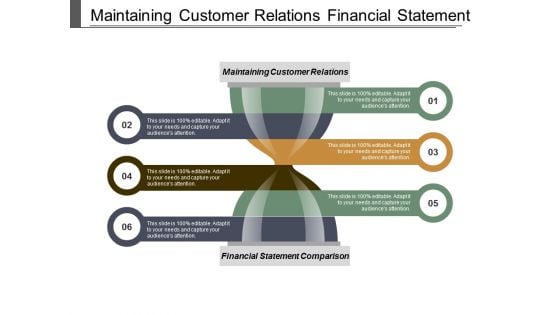
Maintaining Customer Relations Financial Statement Comparison Productivity Metrics Ppt PowerPoint Presentation Infographics Graphic Images
This is a maintaining customer relations financial statement comparison productivity metrics ppt powerpoint presentation infographics graphic images. This is a six stage process. The stages in this process are maintaining customer relations, financial statement comparison, productivity metrics.
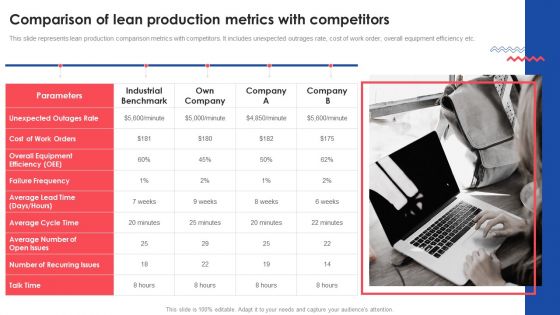
Comparison Of Lean Production Metrics With Competitors Deploying And Managing Lean Ideas PDF
This slide represents lean production comparison metrics with competitors. It includes unexpected outrages rate, cost of work order, overall equipment efficiency etc.This is a Comparison Of Lean Production Metrics With Competitors Deploying And Managing Lean Ideas PDF template with various stages. Focus and dispense information on one stage using this creative set, that comes with editable features. It contains large content boxes to add your information on topics like Unexpected Outages, Average Lead, Recurring Issues. You can also showcase facts, figures, and other relevant content using this PPT layout. Grab it now.

Five Yearly Multiple Product Comparison Roadmap Based On Key Metrics Slides
Introducing our five yearly multiple product comparison roadmap based on key metrics slides. This PPT presentation is Google Slides compatible, therefore, you can share it easily with the collaborators for measuring the progress. Also, the presentation is available in both standard screen and widescreen aspect ratios. So edit the template design by modifying the font size, font type, color, and shapes as per your requirements. As this PPT design is fully editable it can be presented in PDF, JPG and PNG formats.

Half Yearly Multiple Product Comparison Roadmap Based On Key Metrics Download
Introducing our half yearly multiple product comparison roadmap based on key metrics download. This PPT presentation is Google Slides compatible, therefore, you can share it easily with the collaborators for measuring the progress. Also, the presentation is available in both standard screen and widescreen aspect ratios. So edit the template design by modifying the font size, font type, color, and shapes as per your requirements. As this PPT design is fully editable it can be presented in PDF, JPG and PNG formats.
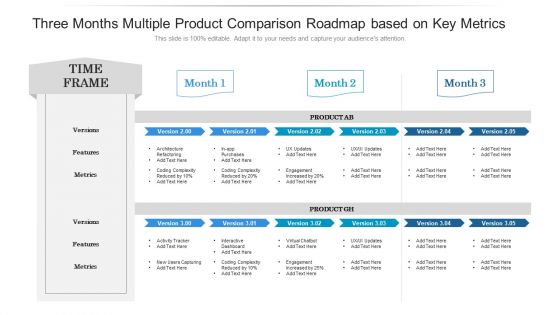
Three Months Multiple Product Comparison Roadmap Based On Key Metrics Information
Introducing our three months multiple product comparison roadmap based on key metrics information. This PPT presentation is Google Slides compatible, therefore, you can share it easily with the collaborators for measuring the progress. Also, the presentation is available in both standard screen and widescreen aspect ratios. So edit the template design by modifying the font size, font type, color, and shapes as per your requirements. As this PPT design is fully editable it can be presented in PDF, JPG and PNG formats.

Comparison Ppt PowerPoint Presentation Inspiration Structure
This is a comparison ppt powerpoint presentation inspiration structure. This is a two stage process. The stages in this process are compare, measure, finance, percentage, business.
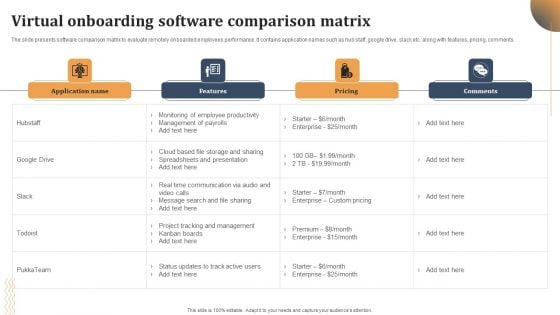
Virtual Onboarding Software Comparison Matrix Sample PDF
The slide presents software comparison matrix to evaluate remotely onboarded employees performance. It contains application names such as hub staff, google drive, slack etc. along with features, pricing, comments. Showcasing this set of slides titled Virtual Onboarding Software Comparison Matrix Sample PDF. The topics addressed in these templates are Monitoring Employee Productivity, Management Payrolls, Spreadsheets Presentation. All the content presented in this PPT design is completely editable. Download it and make adjustments in color, background, font etc. as per your unique business setting.
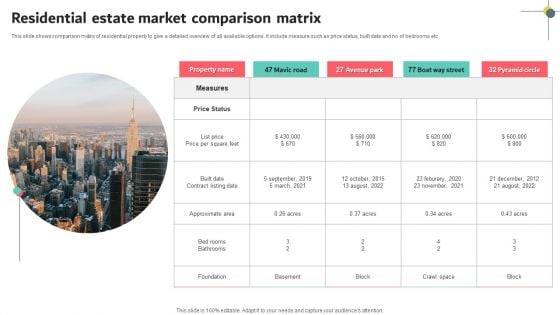
Residential Estate Market Comparison Matrix Slides PDF
This slide shows comparison matrix of residential property to give a detailed overview of all available options. It include measure such as price status, built date and no of bedrooms etc. Persuade your audience using this Residential Estate Market Comparison Matrix Slides PDF. This PPT design covers five stages, thus making it a great tool to use. It also caters to a variety of topics including Price Status, Measures, Pyramid Circle. Download this PPT design now to present a convincing pitch that not only emphasizes the topic but also showcases your presentation skills.
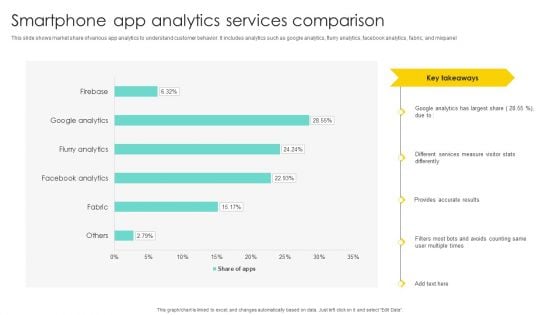
Smartphone App Analytics Services Comparison Brochure PDF
This slide shows market share of various app analytics to understand customer behavior. It includes analytics such as google analytics, flurry analytics, facebook analytics, fabric, and mixpanel. Pitch your topic with ease and precision using this Smartphone App Analytics Services Comparison Brochure PDF. This layout presents information on Different Services Measure, Visitor Stats Differently, Provides Accurate Results. It is also available for immediate download and adjustment. So, changes can be made in the color, design, graphics or any other component to create a unique layout.
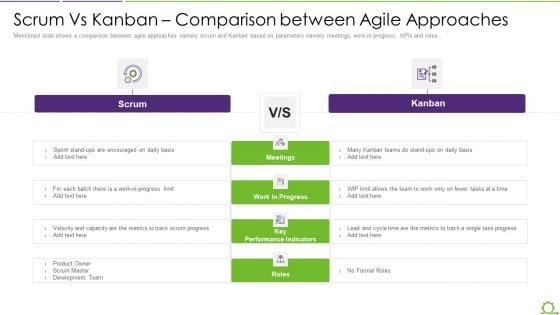
Comparison Between Agile And Scrum IT Scrum Vs Kanban Comparison Between Agile Approaches Slides PDF
Mentioned slide shows a comparison between agile approaches namely scrum and Kanban based on parameters namely meetings, work-in-progress, KPIs and roles. This is a comparison between agile and scrum it scrum vs kanban comparison between agile approaches slides pdf template with various stages. Focus and dispense information on two stages using this creative set, that comes with editable features. It contains large content boxes to add your information on topics like scrum, kanban, meetings work progress, key performance indicators, roles. You can also showcase facts, figures, and other relevant content using this PPT layout. Grab it now.
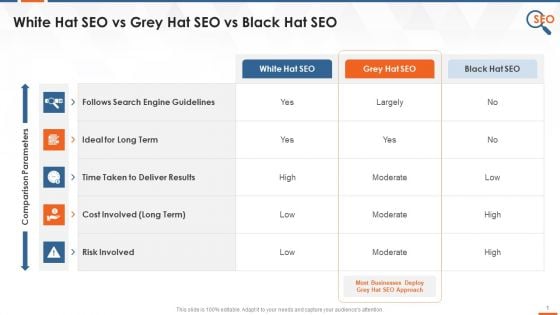
Comparison Between White Black And Grey Hat SEO Training Ppt
The following slide depicts the comparison of white, black, and grey hat SEO. The multiple parameters used for comparison are search engine guidelines, ideal for long term, time taken to deliver results, cost involved long term, and risk involved.
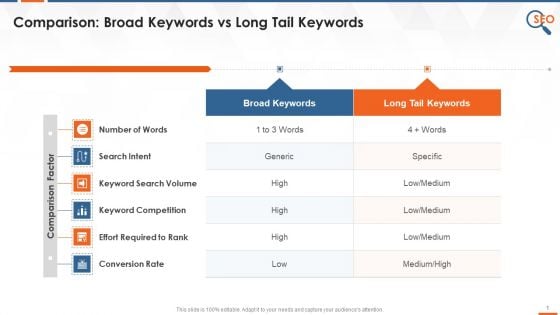
Comparison Of Broad And Long Tail Keywords Training Ppt
This slide provides information regarding the comparison of board and long-tail keywords on multiple factors such as the number of words, search intent, keyword search volume, keyword competition, effort required to rank, and conversion rate.
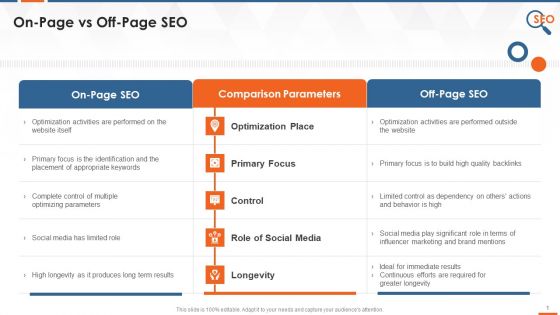
Comparison Of On Page And Off Page SEO Training Ppt
This slide highlights the difference between on-page and off-page SEO based on multiple parameters such as optimization place, primary focus, control, role of social media, and longevity.
Icon For Customer Retention Business Metric Template Pdf
Pitch your topic with ease and precision using this Icon For Customer Retention Business Metric Template Pdf. This layout presents information on Icon For Customer, Retention Business Metric. It is also available for immediate download and adjustment. So, changes can be made in the color, design, graphics or any other component to create a unique layout. Our Icon For Customer Retention Business Metric Template Pdf are topically designed to provide an attractive backdrop to any subject. Use them to look like a presentation pro.
Icon Showcasing Metric To Track Business Diversity Mockup PDF

Process Advancement Scheme Goal Question Metric Model Themes PDF
This slide provides the glimpse about the GQM technique to evaluate the current situation of the company which focuses on goal, question and metric to evaluate the current situation of the software company. This is a process advancement scheme goal question metric model themes pdf template with various stages. Focus and dispense information on three stages using this creative set, that comes with editable features. It contains large content boxes to add your information on topics like metric, questions, goal, analysis warnings. You can also showcase facts, figures, and other relevant content using this PPT layout. Grab it now.
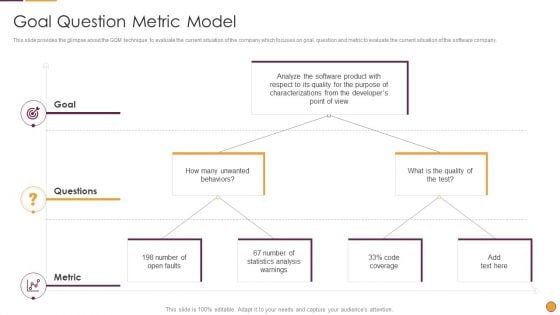
Process Enhancement Program Success Goal Question Metric Model Download PDF
This is a Process Enhancement Program Success Goal Question Metric Model Download PDF template with various stages. Focus and dispense information on three stages using this creative set, that comes with editable features. It contains large content boxes to add your information on topics like Goal Questions, Metric Behaviors, Quality Test. You can also showcase facts, figures, and other relevant content using this PPT layout. Grab it now.
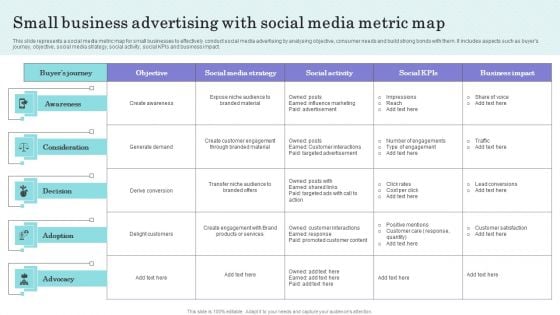
Small Business Advertising With Social Media Metric Map Graphics PDF
This slide represents a social media metric map for small businesses to effectively conduct social media advertising by analysing objective, consumer needs and build strong bonds with them. It includes aspects such as buyers journey, objective, social media strategy, social activity, social KPIs and business impact. Pitch your topic with ease and precision using this Small Business Advertising With Social Media Metric Map Graphics PDF. This layout presents information on Awareness, Consideration, Decision . It is also available for immediate download and adjustment. So, changes can be made in the color, design, graphics or any other component to create a unique layout.
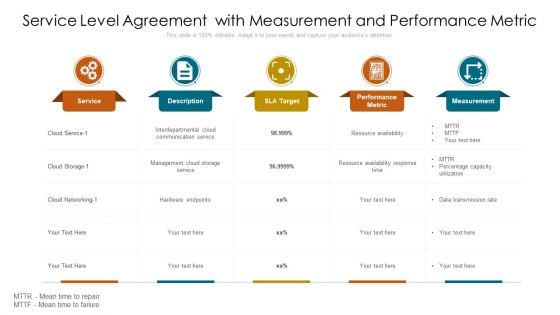
Service Level Agreement With Measurement And Performance Metric Themes PDF
Pitch your topic with ease and precision using this service level agreement with measurement and performance metric themes pdf. This layout presents information on service, measurement, target. It is also available for immediate download and adjustment. So, changes can be made in the color, design, graphics or any other component to create a unique layout.

Metric Checklist To Measure Supplier Diversity And Performance Pictures PDF
This slide represents KPI checklist to assess and monitor supplier diversity program performance. It provides information such as develop objective, identify KPI, establish baseline, data analysis and tracking. Pitch your topic with ease and precision using this Metric Checklist To Measure Supplier Diversity And Performance Pictures PDF. This layout presents information on Create Objective, Establish Baseline, Data Analysis. It is also available for immediate download and adjustment. So, changes can be made in the color, design, graphics or any other component to create a unique layout.

Inclusive Diversity Strategic Objectives With Metric Elements PDF
This slide highlight strategic inclusive diversity objectives with KPIs which help increase business stability and security and create powerful employee connections. It provides information regarding team building, growth opportunities and intention. Pitch your topic with ease and precision using this Inclusive Diversity Strategic Objectives With Metric Elements PDF. This layout presents information on Team Building, Growth Opportunities, Intention. It is also available for immediate download and adjustment. So, changes can be made in the color, design, graphics or any other component to create a unique layout.
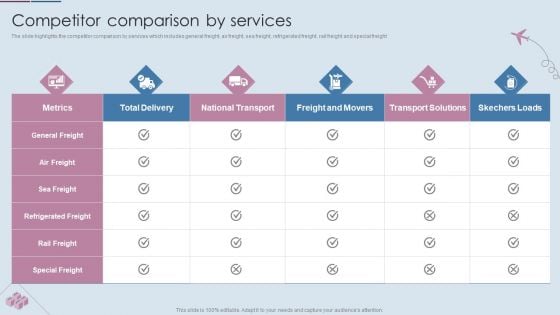
Logistics Shipment Company Profile Competitor Comparison By Services Diagrams PDF
The slide highlights the competitor comparison by services which includes general freight, air freight, sea freight, refrigerated freight, rail freight and special freight. Deliver an awe inspiring pitch with this creative Logistics Shipment Company Profile Competitor Comparison By Services Diagrams PDF bundle. Topics like Metrics, Total Delivery, National Transport can be discussed with this completely editable template. It is available for immediate download depending on the needs and requirements of the user.
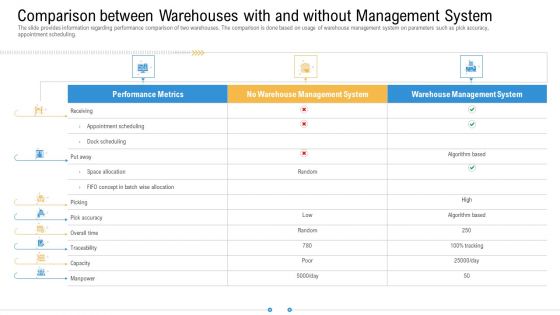
Comparison Between Warehouses With And Without Management System Structure PDF
The slide provides information regarding performance comparison of two warehouses. The comparison is done based on usage of warehouse management system on parameters such as pick accuracy, appointment scheduling. Deliver an awe inspiring pitch with this creative comparison between warehouses with and without management system structure pdf bundle. Topics like warehouse management system, performance metrics can be discussed with this completely editable template. It is available for immediate download depending on the needs and requirements of the user.
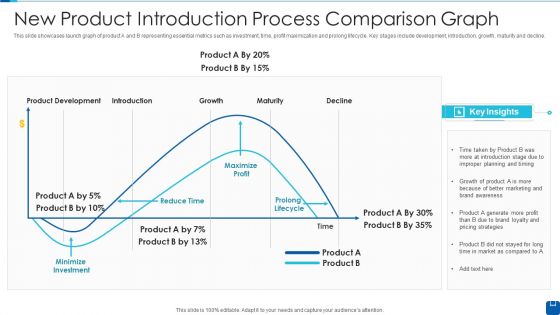
New Product Introduction Process Comparison Graph Slides PDF
This slide showcases launch graph of product A and B representing essential metrics such as investment, time, profit maximization and prolong lifecycle. Key stages include development, introduction, growth, maturity and decline.Showcasing this set of slides titled New Product Introduction Process Comparison Graph Slides PDF The topics addressed in these templates are Product Development, Improper Planning, Minimize Investment All the content presented in this PPT design is completely editable. Download it and make adjustments in color, background, font etc. as per your unique business setting.

Advertisement Cost Comparison Of Social Media Platforms Graphics PDF
This slide showcases comparative assessment of advertisement cost on different social media. It analyze social media advertising cost on the basis of key metrics that are average cost per click and cost per mile. Make sure to capture your audiences attention in your business displays with our gratis customizable Advertisement Cost Comparison Of Social Media Platforms Graphics PDF. These are great for business strategies, office conferences, capital raising or task suggestions. If you desire to acquire more customers for your tech business and ensure they stay satisfied, create your own sales presentation with these plain slides.
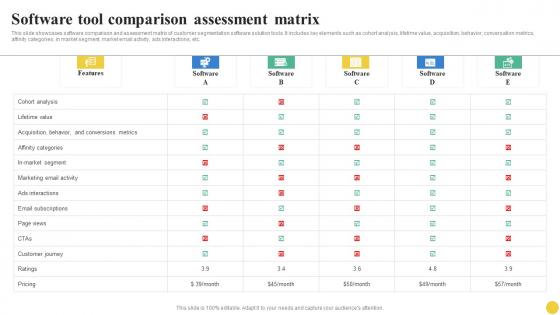
Software Tool Comparison Assessment Matrix User Segmentation Pictures Pdf
This slide showcases software comparison and assessment matrix of customer segmentation software solution tools. It includes key elements such as cohort analysis, lifetime value, acquisition, behavior, conversation metrics, affinity categories, in market segment, market email activity, ads interactions, etc. If your project calls for a presentation, then Slidegeeks is your go-to partner because we have professionally designed, easy-to-edit templates that are perfect for any presentation. After downloading, you can easily edit Software Tool Comparison Assessment Matrix User Segmentation Pictures Pdf and make the changes accordingly. You can rearrange slides or fill them with different images. Check out all the handy templates This slide showcases software comparison and assessment matrix of customer segmentation software solution tools. It includes key elements such as cohort analysis, lifetime value, acquisition, behavior, conversation metrics, affinity categories, in market segment, market email activity, ads interactions, etc.
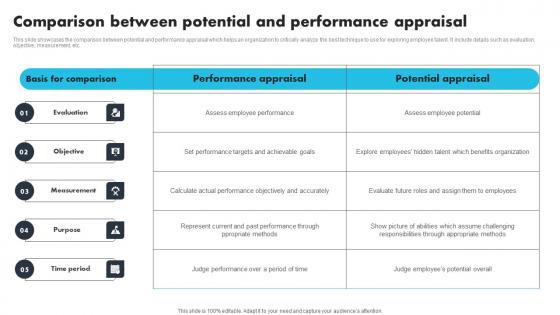
Comparison Between Potential And Performance Appraisal Structure Pdf
This slide showcases the comparison between potential and performance appraisal which helps an organization to critically analyze the best technique to use for exploring employee talent. It include details such as evaluation, objective, measurement, etc. Pitch your topic with ease and precision using this Comparison Between Potential And Performance Appraisal Structure Pdf. This layout presents information on Evaluation, Objective, Measurement. It is also available for immediate download and adjustment. So, changes can be made in the color, design, graphics or any other component to create a unique layout. This slide showcases the comparison between potential and performance appraisal which helps an organization to critically analyze the best technique to use for exploring employee talent. It include details such as evaluation, objective, measurement, etc.
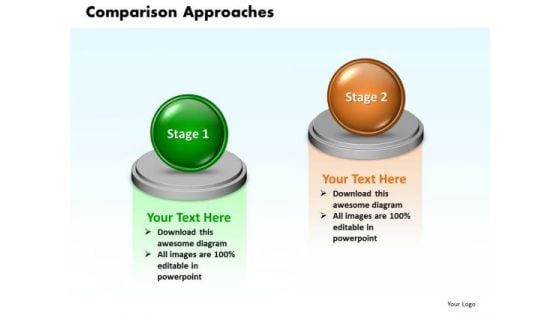
Ppt 3d Animated 2 Circular Approaches Comparison PowerPoint Templates
PPT 3d animated 2 circular approaches comparison PowerPoint Templates-This 3D animated Circular approaches diagram allows presenters to illustrate two approaches.-PPT 3d animated 2 circular approaches comparison PowerPoint Templates-3d, Abstract, Backgrounds, Ball, Business, Choice, Comparison, Concept, Descriptive, Equilibrium, Grow, Illustrations, Instrument, Measurement, Metallic, Part, Partnership, Pattern, Progress, Reflections, Scales, Several, Sphere, Strategy, Success Innovate and succeed with our Ppt 3d Animated 2 Circular Approaches Comparison PowerPoint Templates. Download without worries with our money back guaranteee.
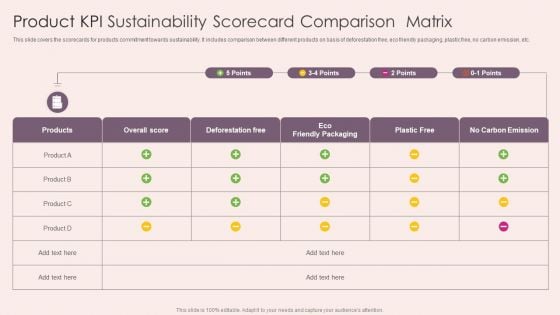
Product KPI Sustainability Scorecard Comparison Matrix Demonstration PDF
This slide covers the scorecards for products commitment towards sustainability. It includes comparison between different products on basis of deforestation free, eco friendly packaging, plastic free, no carbon emission, etc. Showcasing this set of slides titled Product KPI Sustainability Scorecard Comparison Matrix Demonstration PDF. The topics addressed in these templates are Product Kpi Sustainability, Scorecard Comparison Matrix. All the content presented in this PPT design is completely editable. Download it and make adjustments in color, background, font etc. as per your unique business setting.
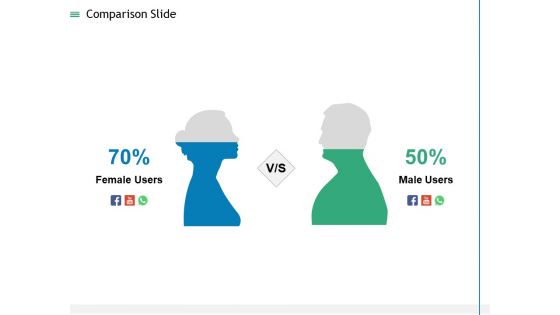
Measuring Influencer Marketing ROI Comparison Slide Ppt Professional Slides PDF
This is a measuring influencer marketing roi comparison slide ppt professional slides pdf template with various stages. Focus and dispense information on two stages using this creative set, that comes with editable features. It contains large content boxes to add your information on topic like comparison. You can also showcase facts, figures, and other relevant content using this PPT layout. Grab it now.
Two Product KPI Attributes Comparison Scorecard Icon Formats PDF
Persuade your audience using this Two Product KPI Attributes Comparison Scorecard Icon Formats PDF. This PPT design covers four stages, thus making it a great tool to use. It also caters to a variety of topics including Product Kpi Attributes, Comparison Scorecard Icon. Download this PPT design now to present a convincing pitch that not only emphasizes the topic but also showcases your presentation skills.

Preventive Measures Workplace Comparison Ppt Inspiration Clipart Images PDF
Presenting this set of slides with name preventive measures workplace comparison ppt inspiration clipart images pdf. The topics discussed in these slides are comparison. This is a completely editable PowerPoint presentation and is available for immediate download. Download now and impress your audience.

Operations Planned Maintenance Optimization Strategies Comparison Matrix Introduction PDF
This slide shows business maintenance optimization strategies comparison for selecting suitable approach for business. It include comparison of strategies based on task done, core objective, interval time etc. Showcasing this set of slides titled Operations Planned Maintenance Optimization Strategies Comparison Matrix Introduction PDF. The topics addressed in these templates are Preventive Measure, Corrective Maintenance, Interval Time. All the content presented in this PPT design is completely editable. Download it and make adjustments in color, background, font etc. as per your unique business setting.
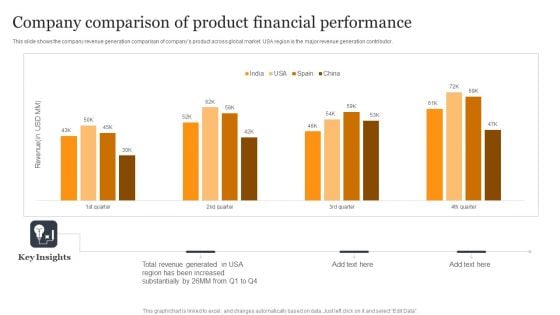
Company Comparison Of Product Financial Performance Summary PDF
This slide shows the company revenue generation comparison of companys product across global market. USA region is the major revenue generation contributor. Showcasing this set of slides titled Company Comparison Of Product Financial Performance Summary PDF. The topics addressed in these templates are Revenue Generated, Region Increased, Substantially. All the content presented in this PPT design is completely editable. Download it and make adjustments in color, background, font etc. as per your unique business setting.
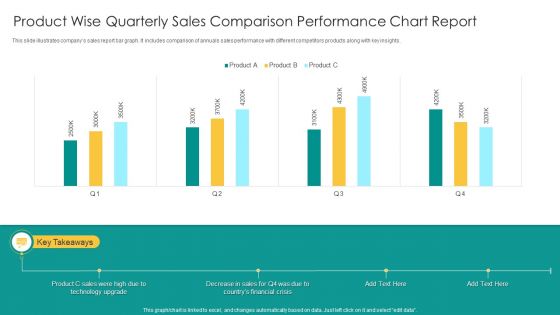
Product Wise Quarterly Sales Comparison Performance Chart Report Infographics PDF
This slide illustrates companys sales report bar graph. It includes comparison of annuals sales performance with different competitors products along with key insights. Showcasing this set of slides titled Product Wise Quarterly Sales Comparison Performance Chart Report Infographics PDF. The topics addressed in these templates are Product C Sales, Technology Upgrade, Financial Crisis. All the content presented in this PPT design is completely editable. Download it and make adjustments in color, background, font etc. as per your unique business setting.

 Home
Home