Metrics Dashboard
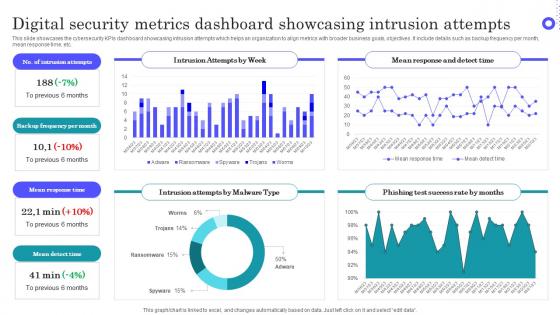
Digital Security Metrics Dashboard Showcasing Intrusion Attempts Topics Pdf
Pitch your topic with ease and precision using this Digital Security Metrics Dashboard Showcasing Intrusion Attempts Topics Pdf This layout presents information on Intrusion Attempts, Frequency Per Month, Mean Response Time It is also available for immediate download and adjustment. So, changes can be made in the color, design, graphics or any other component to create a unique layout. This slide showcases the cybersecurity KPIs dashboard showcasing intrusion attempts which helps an organization to align metrics with broader business goals, objectives. It include details such as backup frequency per month, mean response time, etc.
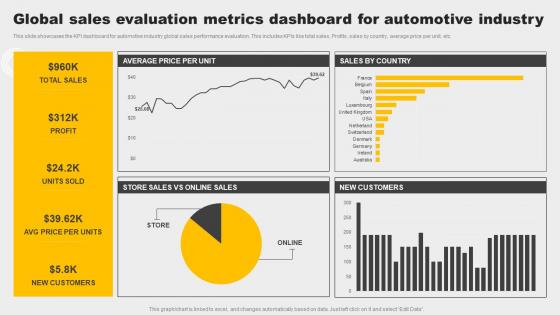
Global Sales Evaluation Metrics Dashboard For Automotive Industry Demonstration Pdf
This slide showcases the KPI dashboard for automotive industry global sales performance evaluation. This includes KPIs like total sales, Profits, sales by country, average price per unit, etc. Pitch your topic with ease and precision using this Global Sales Evaluation Metrics Dashboard For Automotive Industry Demonstration Pdf. This layout presents information on Customers, Profit, Sales. It is also available for immediate download and adjustment. So, changes can be made in the color, design, graphics or any other component to create a unique layout. This slide showcases the KPI dashboard for automotive industry global sales performance evaluation. This includes KPIs like total sales, Profits, sales by country, average price per unit, etc.
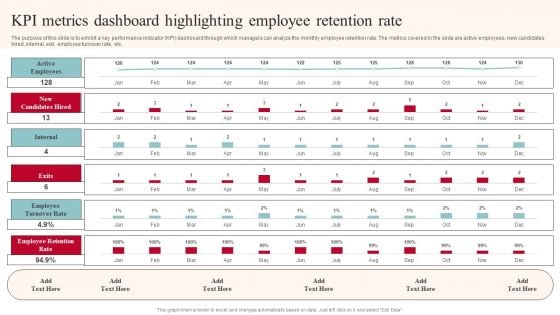
KPI Metrics Dashboard Highlighting Employee Retention Rate Structure PDF
The purpose of this slide is to exhibit a key performance indicator KPI dashboard through which managers can analyze the monthly employee retention rate. The metrics covered in the slide are active employees, new candidates hired, internal, exit, employee turnover rate, etc. Do you have to make sure that everyone on your team knows about any specific topic I yes, then you should give KPI Metrics Dashboard Highlighting Employee Retention Rate Structure PDF a try. Our experts have put a lot of knowledge and effort into creating this impeccable KPI Metrics Dashboard Highlighting Employee Retention Rate Structure PDF. You can use this template for your upcoming presentations, as the slides are perfect to represent even the tiniest detail. You can download these templates from the Slidegeeks website and these are easy to edit. So grab these today.
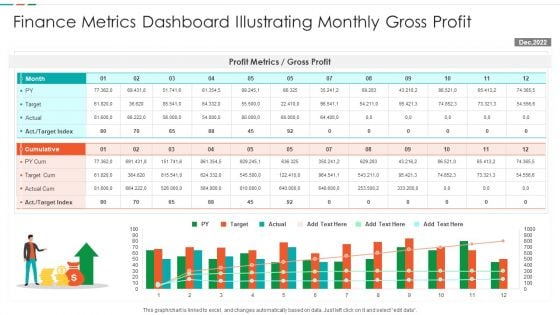
Finance Metrics Dashboard Illustrating Monthly Gross Profit Formats PDF
This graph or chart is linked to excel, and changes automatically based on data. Just left click on it and select edit data. Showcasing this set of slides titled Finance Metrics Dashboard Illustrating Monthly Gross Profit Formats PDF. The topics addressed in these templates are Profit Metrics Gross, Profit Target Cum, Actual Cum Target. All the content presented in this PPT design is completely editable. Download it and make adjustments in color, background, font etc. as per your unique business setting.
KPI Metrics Dashboard Icon For Freelance Content Marketing Ideas PDF
Persuade your audience using this KPI Metrics Dashboard Icon For Freelance Content Marketing Ideas PDF. This PPT design covers four stages, thus making it a great tool to use. It also caters to a variety of topics including Kpi Metrics, Freelance Content Marketing. Download this PPT design now to present a convincing pitch that not only emphasizes the topic but also showcases your presentation skills.
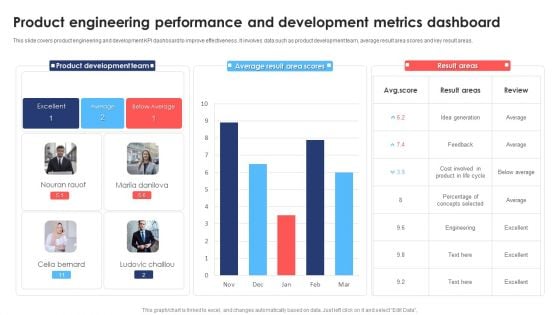
Product Engineering Performance And Development Metrics Dashboard Topics PDF
This slide covers product engineering and development KPI dashboard to improve effectiveness. It involves data such as product development team, average result area scores and key result areas. Showcasing this set of slides titled Product Engineering Performance And Development Metrics Dashboard Topics PDF. The topics addressed in these templates are Product Development Team, Average, Cost. All the content presented in this PPT design is completely editable. Download it and make adjustments in color, background, font etc. as per your unique business setting.
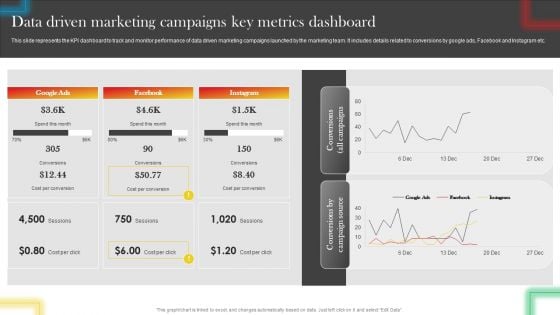
Data Driven Marketing Campaigns Key Metrics Dashboard Microsoft PDF
This slide represents the KPI dashboard to track and monitor performance of data driven marketing campaigns launched by the marketing team. It includes details related to conversions by google ads, Facebook and Instagram etc. There are so many reasons you need a Data Driven Marketing Campaigns Key Metrics Dashboard Microsoft PDF. The first reason is you can not spend time making everything from scratch, Thus, Slidegeeks has made presentation templates for you too. You can easily download these templates from our website easily.
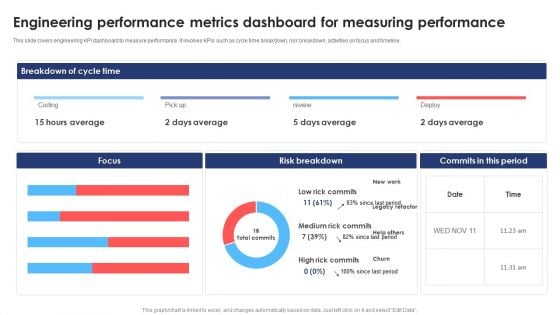
Engineering Performance Metrics Dashboard For Measuring Performance Download PDF
This slide covers engineering KPI dashboard to measure performance. It involves KPIs such as cycle time breakdown, risk breakdown, activities on focus and timeline. Pitch your topic with ease and precision using this Engineering Performance Metrics Dashboard For Measuring Performance Download PDF. This layout presents information on Average, Risk Breakdown, Measuring Performance. It is also available for immediate download and adjustment. So, changes can be made in the color, design, graphics or any other component to create a unique layout.
Lead Tracking Metrics Dashboard With User Responses Diagrams PDF
This slide showcases dashboard for lead conversion metrics that can help organization to filter out total leads interested from the leads who have responded to the phone calls by organization. It also showcases key metrics such as leads busiest hours, leads busiest days, phone number types and lead types. Showcasing this set of slides titled Lead Tracking Metrics Dashboard With User Responses Diagrams PDF. The topics addressed in these templates are Busiest Hours Leads, Conversion Metrics, Lead Types. All the content presented in this PPT design is completely editable. Download it and make adjustments in color, background, font etc. as per your unique business setting.
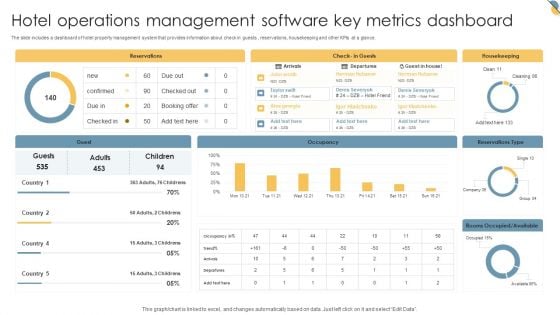
Hotel Operations Management Software Key Metrics Dashboard Inspiration PDF
The slide includes a dashboard of hotel property management system that provides information about check in guests , reservations, housekeeping and other KPIs at a glance. Pitch your topic with ease and precision using this Hotel Operations Management Software Key Metrics Dashboard Inspiration PDF. This layout presents information on Reservations, Housekeeping, Occupancy. It is also available for immediate download and adjustment. So, changes can be made in the color, design, graphics or any other component to create a unique layout.
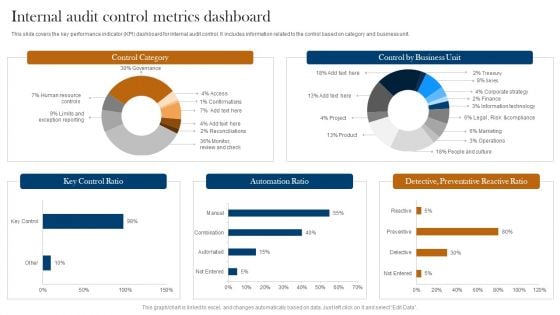
Internal Audit Control Metrics Dashboard Ppt Professional Design Templates PDF
This slide covers the key performance indicator KPI dashboard for internal audit control. It includes information related to the control based on category and business unit. Showcasing this set of slides titled Internal Audit Control Metrics Dashboard Ppt Professional Design Templates PDF. The topics addressed in these templates are Control Category, Key Control Ratio, Automation Ratio. All the content presented in this PPT design is completely editable. Download it and make adjustments in color, background, font etc. as per your unique business setting.
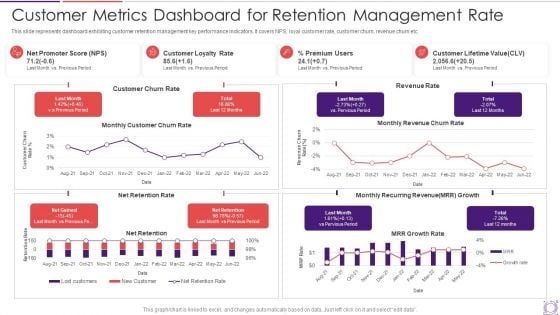
Customer Metrics Dashboard For Retention Management Rate Information PDF
This slide represents dashboard exhibiting customer retention management key performance indicators. It covers NPS, loyal customer rate, customer churn, revenue churn etc. Showcasing this set of slides titled customer metrics dashboard for retention management rate information pdf. The topics addressed in these templates are customer, premium users. All the content presented in this PPT design is completely editable. Download it and make adjustments in color, background, font etc. as per your unique business setting.
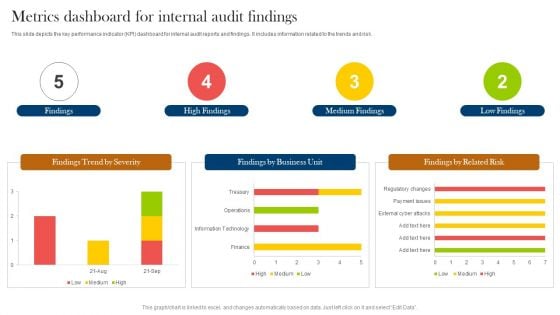
Metrics Dashboard For Internal Audit Findings Ppt Styles Gallery PDF
This slide depicts the key performance indicator KPI dashboard for internal audit reports and findings. It includes information related to the trends and risk. Pitch your topic with ease and precision using this Metrics Dashboard For Internal Audit Findings Ppt Styles Gallery PDF. This layout presents information on Findings, High Findings, Medium Findings, Low Findings. It is also available for immediate download and adjustment. So, changes can be made in the color, design, graphics or any other component to create a unique layout.
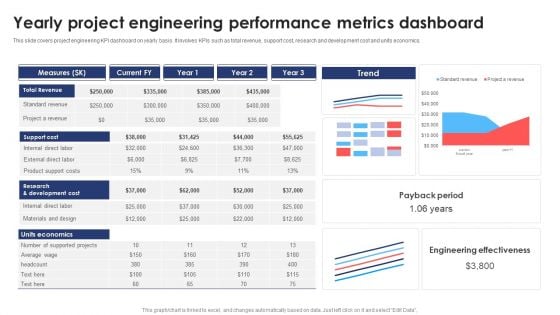
Yearly Project Engineering Performance Metrics Dashboard Information PDF
This slide covers project engineering KPI dashboard on yearly basis. It involves KPIs such as total revenue, support cost, research and development cost and units economics. Pitch your topic with ease and precision using this Yearly Project Engineering Performance Metrics Dashboard Information PDF. This layout presents information on Support Cost, Revenue, Measures. It is also available for immediate download and adjustment. So, changes can be made in the color, design, graphics or any other component to create a unique layout.
Pareto Analysis Shipping Tracking Metrics Dashboard Guidelines PDF
This slide showcases dashboard for analyzing on-time delivery trends. It also includes KPIs such as Pareto analysis and on-time deliveries by shipping organizations. Pitch your topic with ease and precision using this Pareto Analysis Shipping Tracking Metrics Dashboard Guidelines PDF. This layout presents information on Pareto Analysis, Deliveries Trends, Shipping Organization. It is also available for immediate download and adjustment. So, changes can be made in the color, design, graphics or any other component to create a unique layout.
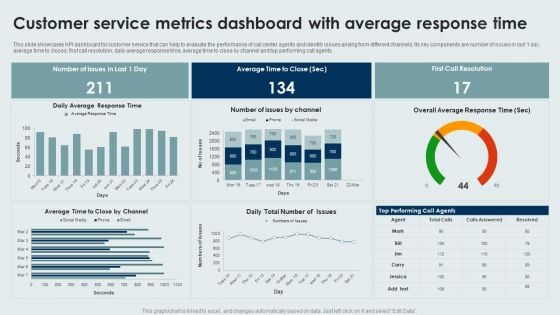
Customer Service Metrics Dashboard With Average Response Time Formats PDF
This slide showcases KPI dashboard for customer service that can help to evaluate the performance of call center agents and identify issues arising from different channels. Its key components are number of issues in last 1 day, average time to closes, first call resolution, daily average response time, average time to close by channel and top performing call agents. Pitch your topic with ease and precision using this Customer Service Metrics Dashboard With Average Response Time Formats PDF. This layout presents information on Customer Service, Metrics Dashboard, Average Response Time. It is also available for immediate download and adjustment. So, changes can be made in the color, design, graphics or any other component to create a unique layout.

Monthly Financial Metrics Dashboard With Revenue And Expenditure Rules PDF
This slide showcases KPI dashboard for monitoring financial health of business to ensure smooth flow of business operations. It includes details such as COGS, net profit, cost breakdown, etc. Showcasing this set of slides titled Monthly Financial Metrics Dashboard With Revenue And Expenditure Rules PDF. The topics addressed in these templates are Net Profit, Costs, Expenditure. All the content presented in this PPT design is completely editable. Download it and make adjustments in color, background, font etc. as per your unique business setting.
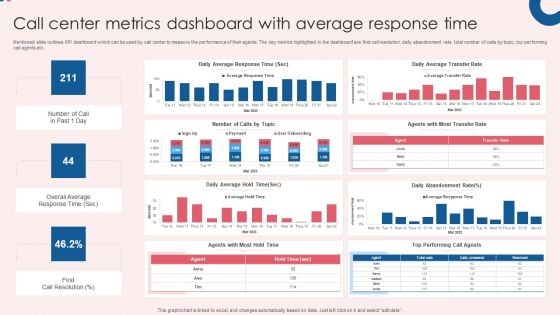
Call Center Metrics Dashboard With Average Response Time Inspiration PDF
Mentioned slide outlines KPI dashboard which can be used by call center to measure the performance of their agents. The key metrics highlighted in the dashboard are first call resolution, daily abandonment rate, total number of calls by topic, top performing call agents etc. Showcasing this set of slides titled Call Center Metrics Dashboard With Average Response Time Inspiration PDF. The topics addressed in these templates are Efficiency, Quality, Activity, Daily Average Response, Daily Average Transfer. All the content presented in this PPT design is completely editable. Download it and make adjustments in color, background, font etc. as per your unique business setting.
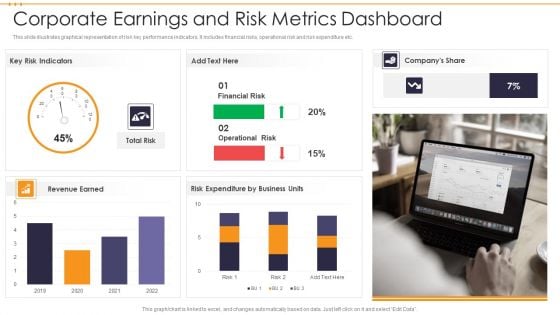
Corporate Earnings And Risk Metrics Dashboard Guidelines PDF
This slide illustrates graphical representation of risk key performance indicators. It includes financial risks, operational risk and risk expenditure etc. Pitch your topic with ease and precision using this Corporate Earnings And Risk Metrics Dashboard Guidelines PDF. This layout presents information on Financial Risk, Operational Risk Expenditure. It is also available for immediate download and adjustment. So, changes can be made in the color, design, graphics or any other component to create a unique layout.
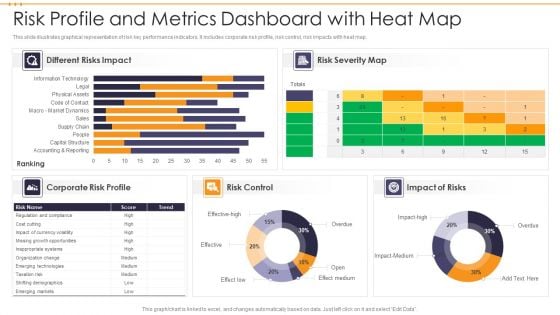
Risk Profile And Metrics Dashboard With Heat Map Brochure PDF
This slide illustrates graphical representation of risk key performance indicators. It includes corporate risk profile, risk control, risk impacts with heat map. Showcasing this set of slides titled Risk Profile And Metrics Dashboard With Heat Map Brochure PDF. The topics addressed in these templates are Risk Control, Impact Of Risks, Risk Severity Map. All the content presented in this PPT design is completely editable. Download it and make adjustments in color, background, font etc. as per your unique business setting.
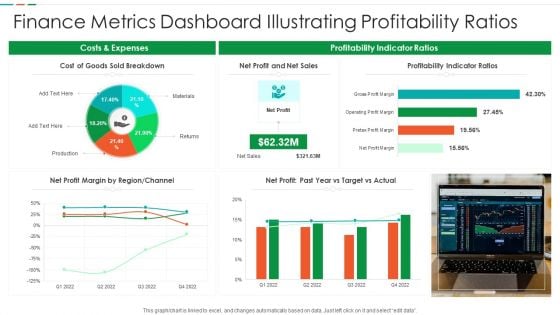
Finance Metrics Dashboard Illustrating Profitability Ratios Diagrams PDF
This graph or chart is linked to excel, and changes automatically based on data. Just left click on it and select edit data. Pitch your topic with ease and precision using this Finance Metrics Dashboard Illustrating Profitability Ratios Diagrams PDF. This layout presents information on Cost Goods Sold, Net Profit Net, Sales Profitability Indicator. It is also available for immediate download and adjustment. So, changes can be made in the color, design, graphics or any other component to create a unique layout.
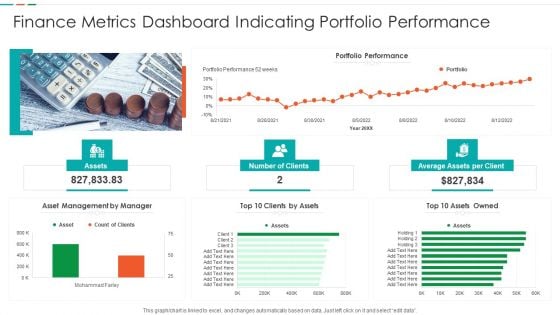
Finance Metrics Dashboard Indicating Portfolio Performance Microsoft PDF
This graph or chart is linked to excel, and changes automatically based on data. Just left click on it and select edit data. Pitch your topic with ease and precision using this Finance Metrics Dashboard Indicating Portfolio Performance Microsoft PDF. This layout presents information on Portfolio Performance Portfolio, Asset Management Manager, Top 10 Assets. It is also available for immediate download and adjustment. So, changes can be made in the color, design, graphics or any other component to create a unique layout.
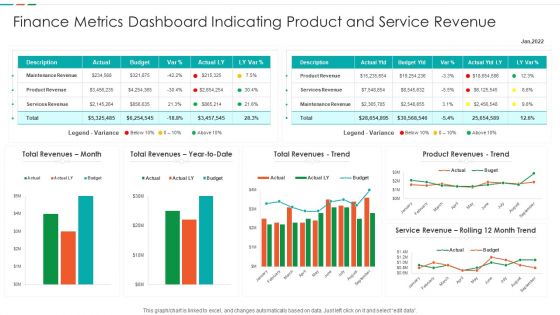
Finance Metrics Dashboard Indicating Product And Service Revenue Designs PDF
This graph or chart is linked to excel, and changes automatically based on data. Just left click on it and select edit data. Showcasing this set of slides titled Finance Metrics Dashboard Indicating Product And Service Revenue Designs PDF. The topics addressed in these templates are Maintenance Revenue Product, Revenue Product Revenues, Service Revenue Rolling. All the content presented in this PPT design is completely editable. Download it and make adjustments in color, background, font etc. as per your unique business setting.
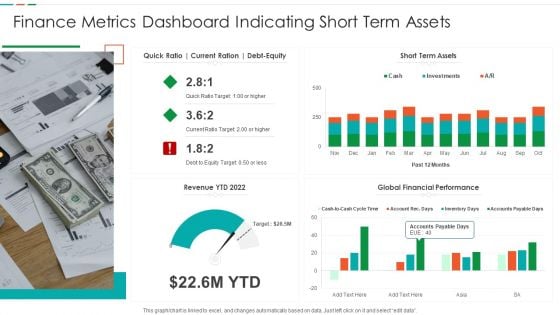
Finance Metrics Dashboard Indicating Short Term Assets Download PDF
This graph or chart is linked to excel, and changes automatically based on data. Just left click on it and select edit data. Pitch your topic with ease and precision using this Finance Metrics Dashboard Indicating Short Term Assets Download PDF. This layout presents information on Short Term Assets, Global Financial Performance, Revenue YTD 2022. It is also available for immediate download and adjustment. So, changes can be made in the color, design, graphics or any other component to create a unique layout.
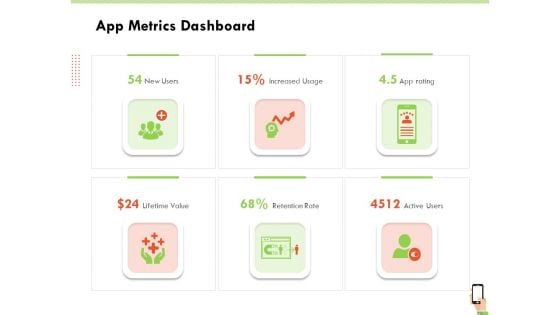
Multi Channel Online Commerce App Metrics Dashboard Sample PDF
This is a multi channel online commerce app metrics dashboard sample pdf template with various stages. Focus and dispense information on six stages using this creative set, that comes with editable features. It contains large content boxes to add your information on topics like lifetime value, active users, retention rate, increased usage. You can also showcase facts, figures, and other relevant content using this PPT layout. Grab it now.
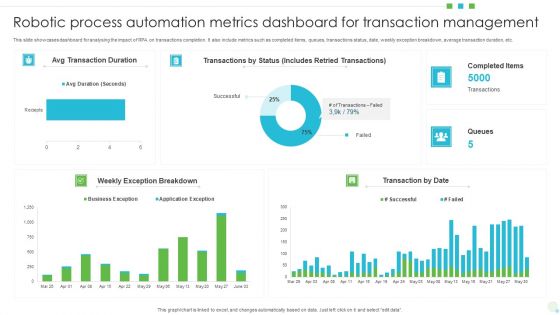
Robotic Process Automation Metrics Dashboard For Transaction Management Ideas PDF
This slide showcases dashboard for analysing the impact of RPA on transactions completion. It also include metrics such as completed items, queues, transactions status, date, weekly exception breakdown, average transaction duration, etc. Showcasing this set of slides titled Robotic Process Automation Metrics Dashboard For Transaction Management Ideas PDF. The topics addressed in these templates are Dashboard For Transaction Management, Robotic Process Automation Metrics. All the content presented in this PPT design is completely editable. Download it and make adjustments in color, background, font etc. as per your unique business setting.
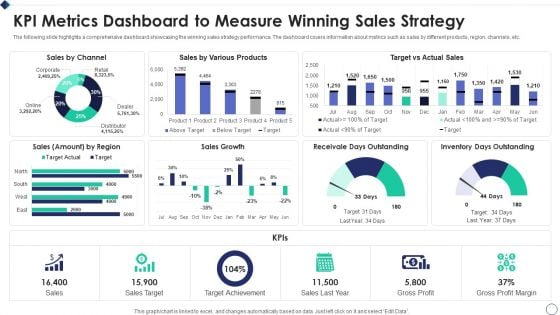
KPI Metrics Dashboard To Measure Winning Sales Strategy Ideas PDF
The following slide highlights a comprehensive dashboard showcasing the winning sales strategy performance. The dashboard covers information about metrics such as sales by different products, region, channels, etc.Showcasing this set of slides titled KPI Metrics Dashboard To Measure Winning Sales Strategy Ideas PDF The topics addressed in these templates are Sales By Channel, Various Products, Inventory Outstanding All the content presented in this PPT design is completely editable. Download it and make adjustments in color, background, font etc. as per your unique business setting.
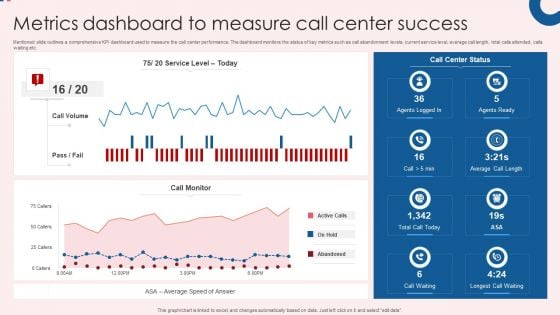
Metrics Dashboard To Measure Call Center Success Themes PDF
Mentioned slide outlines a comprehensive KPI dashboard used to measure the call center performance. The dashboard monitors the status of key metrics such as call abandonment levels, current service level, average call length, total calls attended, calls waiting etc. Showcasing this set of slides titled Metrics Dashboard To Measure Call Center Success Themes PDF. The topics addressed in these templates are Center Success, Call Center Status, Call Monitor. All the content presented in this PPT design is completely editable. Download it and make adjustments in color, background, font etc. as per your unique business setting.

Engineering Performance Metrics Dashboard To Track Pull Requests Background PDF
This slide covers engineering KPI dashboard to track pull request. It involves KPIs such as open time of average pull requests, average comment received, revision rounds, frequency of posting pull requests. Pitch your topic with ease and precision using this Engineering Performance Metrics Dashboard To Track Pull Requests Background PDF. This layout presents information on Dashboard Track Pull Requests, Engineering Performance Metrics. It is also available for immediate download and adjustment. So, changes can be made in the color, design, graphics or any other component to create a unique layout.
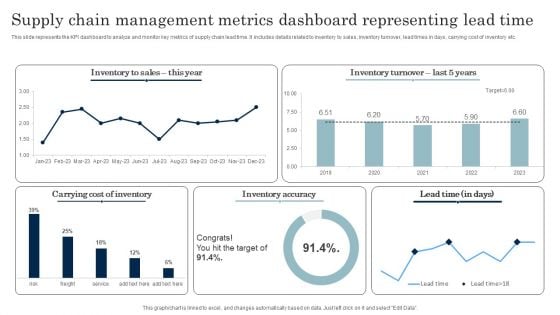
Supply Chain Management Metrics Dashboard Representing Lead Time Download PDF
This slide represents the KPI dashboard to analyze and monitor key metrics of supply chain lead time. It includes details related to inventory to sales, inventory turnover, lead times in days, carrying cost of inventory etc. Pitch your topic with ease and precision using this Supply Chain Management Metrics Dashboard Representing Lead Time Download PDF. This layout presents information on Inventory Accuracy, Carrying Cost Of Inventory. It is also available for immediate download and adjustment. So, changes can be made in the color, design, graphics or any other component to create a unique layout.
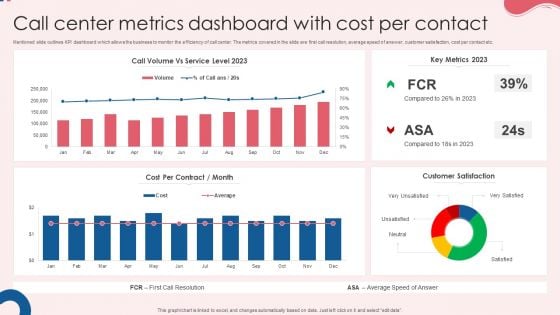
Call Center Metrics Dashboard With Cost Per Contact Rules PDF
Mentioned slide outlines KPI dashboard which allows the business to monitor the efficiency of call center. The metrics covered in the slide are first call resolution, average speed of answer, customer satisfaction, cost per contact etc. Pitch your topic with ease and precision using this Call Center Metrics Dashboard With Cost Per Contact Rules PDF. This layout presents information on Cost Per Contract, Key Metrics, Customer Satisfaction. It is also available for immediate download and adjustment. So, changes can be made in the color, design, graphics or any other component to create a unique layout.
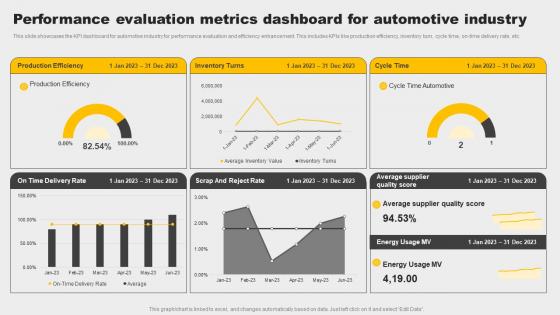
Performance Evaluation Metrics Dashboard For Automotive Industry Mockup Pdf
This slide showcases the KPI dashboard for automotive industry for performance evaluation and efficiency enhancement. This includes KPIs like production efficiency, inventory turn, cycle time, on time delivery rate, etc. Pitch your topic with ease and precision using this Performance Evaluation Metrics Dashboard For Automotive Industry Mockup Pdf. This layout presents information on Production Efficiency, Inventory Turns, Automotive Industry. It is also available for immediate download and adjustment. So, changes can be made in the color, design, graphics or any other component to create a unique layout. This slide showcases the KPI dashboard for automotive industry for performance evaluation and efficiency enhancement. This includes KPIs like production efficiency, inventory turn, cycle time, on time delivery rate, etc.
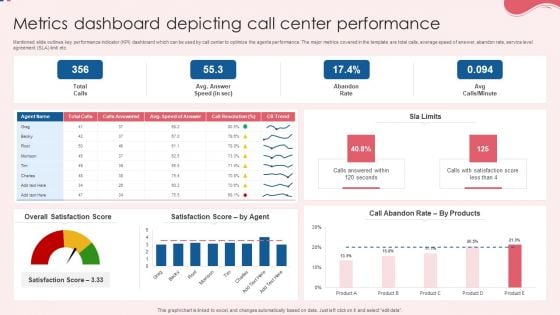
Metrics Dashboard Depicting Call Center Performance Pictures PDF
Mentioned slide outlines key performance indicator KPI dashboard which can be used by call center to optimize the agents performance. The major metrics covered in the template are total calls, average speed of answer, abandon rate, service level agreement SLA limit etc. Pitch your topic with ease and precision using this Metrics Dashboard Depicting Call Center Performance Pictures PDF. This layout presents information on Overall Satisfaction Score, Satisfaction Score, Performance. It is also available for immediate download and adjustment. So, changes can be made in the color, design, graphics or any other component to create a unique layout.

Business Referral Marketing Program Performance Metrics Dashboard Introduction PDF
This slide shows KPI dashboard to effectively track performance of business referral program in order to attract more leads and potential customers to the busines. It includes details related to key metrics such as referral participation rate, referred customers, referral conversion rate and total revenue generated. Showcasing this set of slides titled Business Referral Marketing Program Performance Metrics Dashboard Introduction PDF. The topics addressed in these templates are Referral Participation Rate, Referred Customers, Referral Conversion Rate, Total Revenue Generated. All the content presented in this PPT design is completely editable. Download it and make adjustments in color, background, font etc. as per your unique business setting.
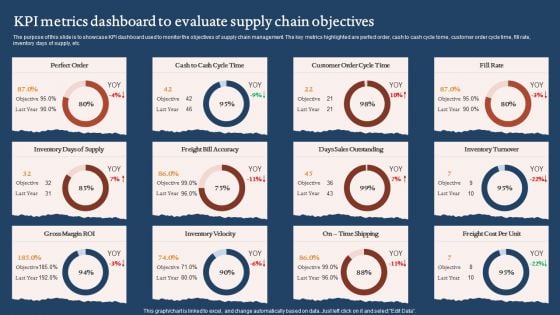
KPI Metrics Dashboard To Evaluate Supply Chain Objectives Graphics PDF
The purpose of this slide is to showcase KPI dashboard used to monitor the objectives of supply chain management. The key metrics highlighted are perfect order, cash to cash cycle tome, customer order cycle time, fill rate, inventory days of supply, etc. Pitch your topic with ease and precision using this KPI Metrics Dashboard To Evaluate Supply Chain Objectives Graphics PDF. This layout presents information on Days Sales Outstanding, Inventory Velocity, Gross Margin Roi. It is also available for immediate download and adjustment. So, changes can be made in the color, design, graphics or any other component to create a unique layout.
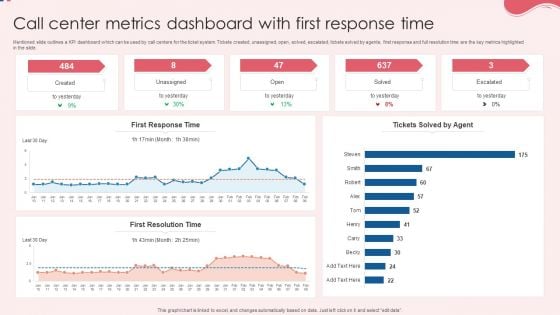
Call Center Metrics Dashboard With First Response Time Background PDF
Mentioned slide outlines a KPI dashboard which can be used by call centers for the ticket system. Tickets created, unassigned, open, solved, escalated, tickets solved by agents, first response and full resolution time are the key metrics highlighted in the slide. Pitch your topic with ease and precision using this Call Center Metrics Dashboard With First Response Time Background PDF. This layout presents information on First Response Time, First Resolution Time, Response Time. It is also available for immediate download and adjustment. So, changes can be made in the color, design, graphics or any other component to create a unique layout.
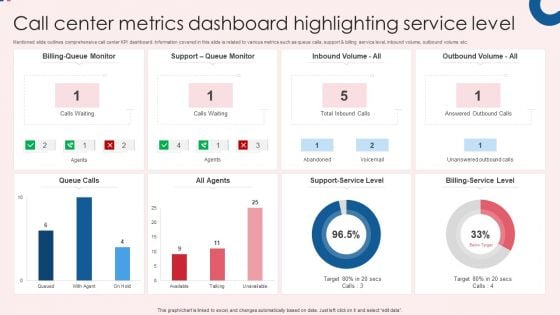
Call Center Metrics Dashboard Highlighting Service Level Infographics PDF
Mentioned slide outlines comprehensive call center KPI dashboard. Information covered in this slide is related to various metrics such as queue calls, support and billing service level, inbound volume, outbound volume etc. Pitch your topic with ease and precision using this Call Center Metrics Dashboard Highlighting Service Level Infographics PDF. This layout presents information on All Agents, Queue Calls, Billing Service Level. It is also available for immediate download and adjustment. So, changes can be made in the color, design, graphics or any other component to create a unique layout.
Altcoins Portfolio Tracking Metrics Dashboard Ppt Inspiration Background Images PDF
This slide covers dashboard for tracking different cryptocurrencies value and growth. It includes metrics such as incomes and expenses, market values, cryptocurrency transactions history, overall growth percentages, exchange rates, etc. Showcasing this set of slides titled Altcoins Portfolio Tracking Metrics Dashboard Ppt Inspiration Background Images PDF. The topics addressed in these templates are Balance, 3 Currencies, Transactions. All the content presented in this PPT design is completely editable. Download it and make adjustments in color, background, font etc. as per your unique business setting.
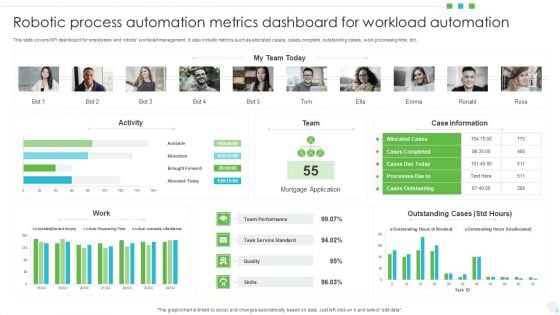
Robotic Process Automation Metrics Dashboard For Workload Automation Mockup PDF
This slide covers KPI dashboard for employees and robots workload management. It also include metrics such as allocated cases, cases complete, outstanding cases, work processing time, etc. Pitch your topic with ease and precision using this Robotic Process Automation Metrics Dashboard For Workload Automation Mockup PDF. This layout presents information on Mortgage Application, Team Performance, Case Information. It is also available for immediate download and adjustment. So, changes can be made in the color, design, graphics or any other component to create a unique layout.
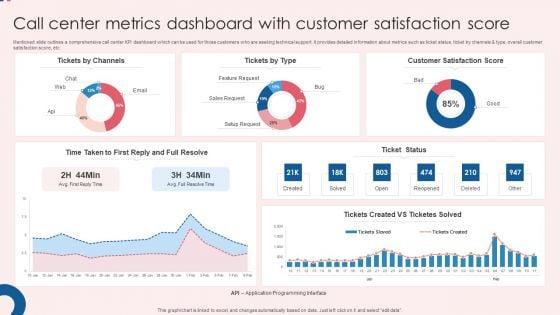
Call Center Metrics Dashboard With Customer Satisfaction Score Ideas PDF
Mentioned slide outlines a comprehensive call center KPI dashboard which can be used for those customers who are seeking technical support. It provides detailed information about metrics such as ticket status, ticket by channels and type, overall customer satisfaction score, etc. Showcasing this set of slides titled Call Center Metrics Dashboard With Customer Satisfaction Score Ideas PDF. The topics addressed in these templates are Customer Satisfaction, Score Ticket Status, Satisfaction Score. All the content presented in this PPT design is completely editable. Download it and make adjustments in color, background, font etc. as per your unique business setting.
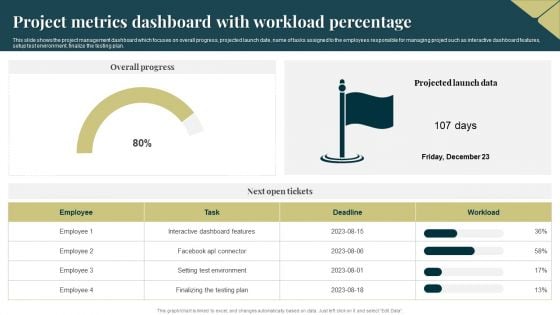
Project Metrics Dashboard With Workload Percentage Ideas PDF
This slide shows the project management dashboard which focuses on overall progress, projected launch date, name of tasks assigned to the employees responsible for managing project such as interactive dashboard features, setup test environment, finalize the testing plan. Showcasing this set of slides titled Project Metrics Dashboard With Workload Percentage Ideas PDF. The topics addressed in these templates are Environment, Plan, Dashboard. All the content presented in this PPT design is completely editable. Download it and make adjustments in color, background, font etc. as per your unique business setting.
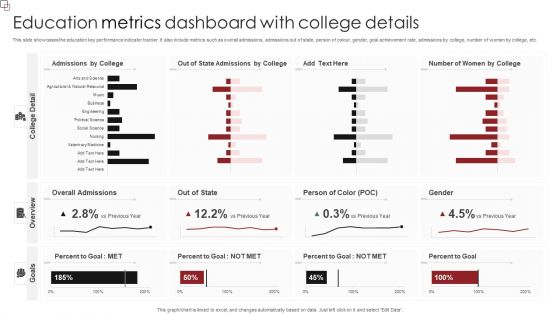
Education Metrics Dashboard With College Details Formats PDF
This slide showcases the education key performance indicator tracker. It also include metrics such as overall admissions, admissions out of state, person of colour, gender, goal achievement rate, admissions by college, number of women by college, etc. Pitch your topic with ease and precision using this Education Metrics Dashboard With College Details Formats PDF. This layout presents information on Overall Admissions, Person Of Color, Percent To Goal. It is also available for immediate download and adjustment. So, changes can be made in the color, design, graphics or any other component to create a unique layout.
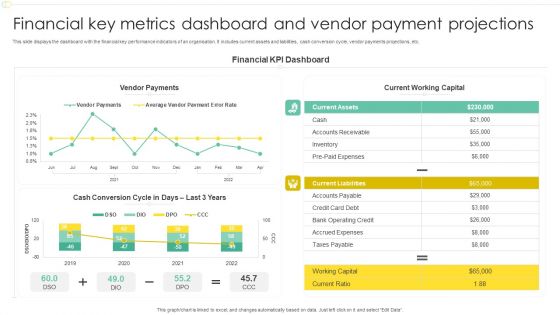
Financial Key Metrics Dashboard And Vendor Payment Projections Professional PDF
This slide displays the dashboard with the financial key performance indicators of an organisation. It includes current assets and liabilities, cash conversion cycle, vendor payments projections, etc. Pitch your topic with ease and precision using this Financial Key Metrics Dashboard And Vendor Payment Projections Professional PDF. This layout presents information on Financial KPI Dashboard, Current Working Capital, Vendor Payments. It is also available for immediate download and adjustment. So, changes can be made in the color, design, graphics or any other component to create a unique layout.
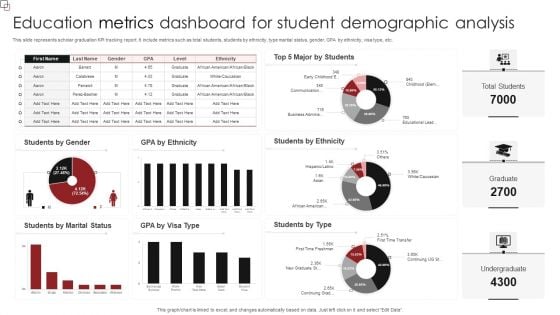
Education Metrics Dashboard For Student Demographic Analysis Diagrams PDF
This slide represents scholar graduation KPI tracking report. It include metrics such as total students, students by ethnicity, type marital status, gender, GPA by ethnicity, visa type, etc. Showcasing this set of slides titled Education Metrics Dashboard For Student Demographic Analysis Diagrams PDF. The topics addressed in these templates are Students Ethnicity, Students Type, Students Marital Status. All the content presented in this PPT design is completely editable. Download it and make adjustments in color, background, font etc. as per your unique business setting.
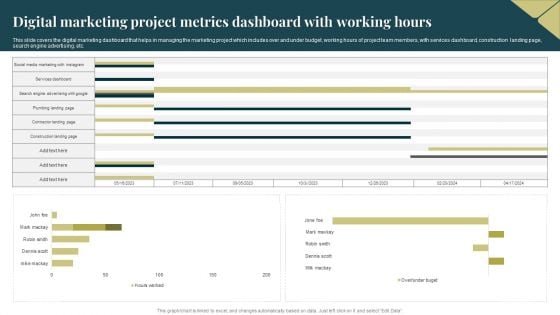
Digital Marketing Project Metrics Dashboard With Working Hours Download PDF
This slide covers the digital marketing dashboard that helps in managing the marketing project which includes over and under budget, working hours of project team members, with services dashboard, construction landing page, search engine advertising, etc. Showcasing this set of slides titled Digital Marketing Project Metrics Dashboard With Working Hours Download PDF. The topics addressed in these templates are Advertising, Social Media Marketing. All the content presented in this PPT design is completely editable. Download it and make adjustments in color, background, font etc. as per your unique business setting.
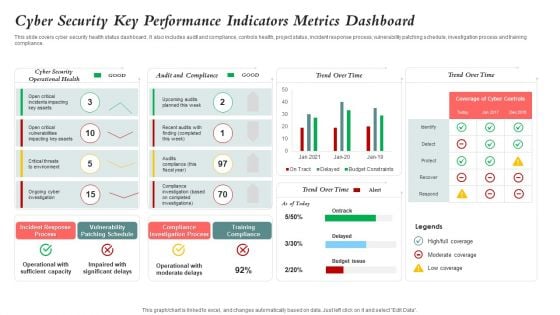
Cyber Security Key Performance Indicators Metrics Dashboard Mockup PDF
This slide covers cyber security health status dashboard . It also includes audit and compliance, controls health, project status, incident response process, vulnerability patching schedule, investigation process and training compliance. Pitch your topic with ease and precision using this Cyber Security Key Performance Indicators Metrics Dashboard Mockup PDF. This layout presents information on Cyber Security, Vulnerability Patching Schedule, Compliance Investigation Process. It is also available for immediate download and adjustment. So, changes can be made in the color, design, graphics or any other component to create a unique layout.
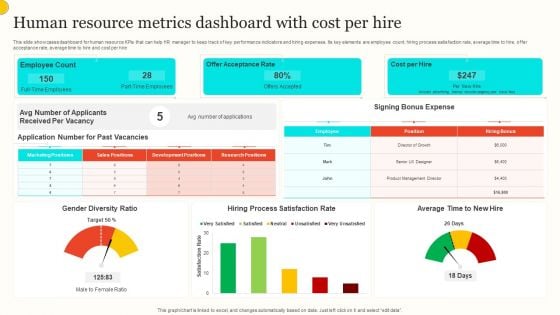
Human Resource Metrics Dashboard With Cost Per Hire Portrait PDF
This slide showcases dashboard for human resource KPIs that can help HR manager to keep track of key performance indicators and hiring expenses. Its key elements are employee count, hiring process satisfaction rate, average time to hire, offer acceptance rate, average time to hire and cost per hire. Showcasing this set of slides titled Human Resource Metrics Dashboard With Cost Per Hire Portrait PDF. The topics addressed in these templates are Employee Count, Offer Acceptance Rate, Cost Per Hire. All the content presented in this PPT design is completely editable. Download it and make adjustments in color, background, font etc. as per your unique business setting.
Customer Service Metrics Dashboard With Customer Retention Rate Icons PDF
This slide showcases KPIs dashboard for customer service that can help organization to track the consumer satisfaction score and improve product or service by improving customer loyalty. Its key components are net promoter score, customer retention and support costs. Showcasing this set of slides titled Customer Service Metrics Dashboard With Customer Retention Rate Icons PDF. The topics addressed in these templates are Customer Retention, Net Promoter Score, Service Level. All the content presented in this PPT design is completely editable. Download it and make adjustments in color, background, font etc. as per your unique business setting.
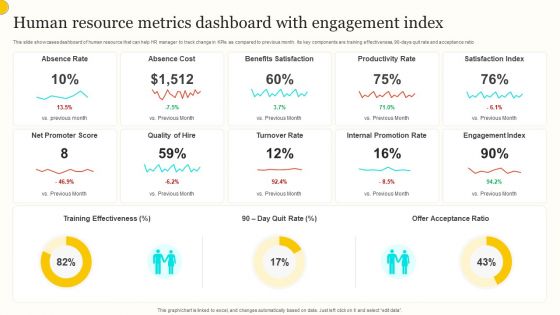
Human Resource Metrics Dashboard With Engagement Index Guidelines PDF
This slide showcases dashboard of human resource that can help HR manager to track change in KPIs as compared to previous month. Its key components are training effectiveness, 90 days quit rate and acceptance ratio. Pitch your topic with ease and precision using this Human Resource Metrics Dashboard With Engagement Index Guidelines PDF. This layout presents information on Absence Rate, Absence Cost, Benefits Satisfaction. It is also available for immediate download and adjustment. So, changes can be made in the color, design, graphics or any other component to create a unique layout.
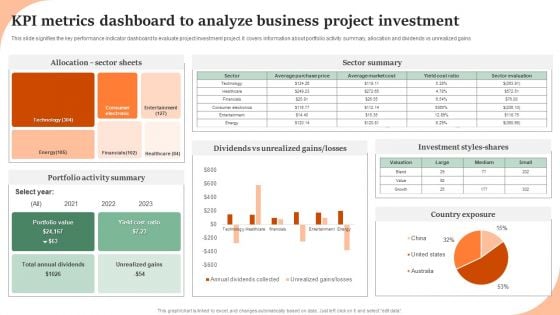
KPI Metrics Dashboard To Analyze Business Project Investment Graphics PDF
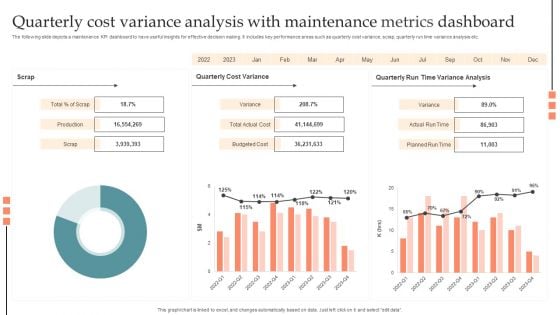
Quarterly Cost Variance Analysis With Maintenance Metrics Dashboard Information PDF
The following slide depicts a maintenance KPI dashboard to have useful insights for effective decision making. It includes key performance areas such as quarterly cost variance, scrap, quarterly run time variance analysis etc. Pitch your topic with ease and precision using this Quarterly Cost Variance Analysis With Maintenance Metrics Dashboard Information PDF. This layout presents information on Production, Budgeted Cost, Planned Run Time, Actual Run Time. It is also available for immediate download and adjustment. So, changes can be made in the color, design, graphics or any other component to create a unique layout.
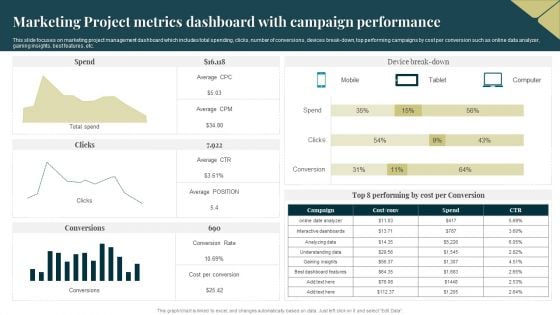
Marketing Project Metrics Dashboard With Campaign Performance Topics PDF
This slide focuses on marketing project management dashboard which includes total spending, clicks, number of conversions, devices break down, top performing campaigns by cost per conversion such as online data analyzer, gaining insights, best features, etc. Showcasing this set of slides titled Marketing Project Metrics Dashboard With Campaign Performance Topics PDF. The topics addressed in these templates are Average, Cost, Analyzing Data. All the content presented in this PPT design is completely editable. Download it and make adjustments in color, background, font etc. as per your unique business setting.
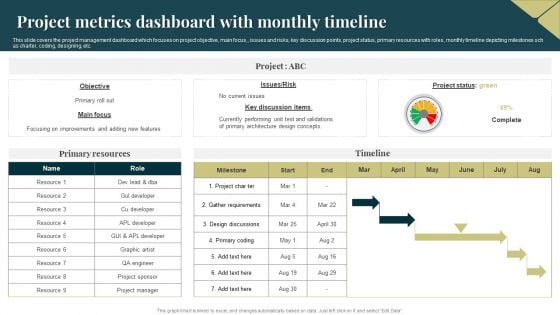
Project Metrics Dashboard With Monthly Timeline Pictures PDF
This slide covers the project management dashboard which focuses on project objective, main focus,, issues and risks, key discussion points, project status, primary resources with roles, monthly timeline depicting milestones sch as charter, coding, designing, etc. Showcasing this set of slides titled Project Metrics Dashboard With Monthly Timeline Pictures PDF. The topics addressed in these templates are Primary Resources, Risk, Requirements. All the content presented in this PPT design is completely editable. Download it and make adjustments in color, background, font etc. as per your unique business setting.
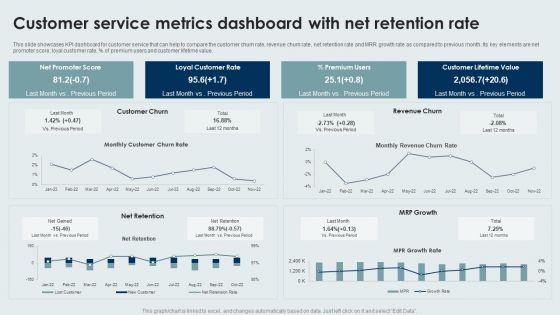
Customer Service Metrics Dashboard With Net Retention Rate Sample PDF
This slide showcases KPI dashboard for customer service that can help to compare the customer churn rate, revenue churn rate, net retention rate and MRR growth rate as compared to previous month. Its key elements are net promoter score, loyal customer rate, percentage of premium users and customer lifetime value. Pitch your topic with ease and precision using this Customer Service Metrics Dashboard With Net Retention Rate Sample PDF. This layout presents information on Loyal Customer Rate, Premium Users, Customer Lifetime Value. It is also available for immediate download and adjustment. So, changes can be made in the color, design, graphics or any other component to create a unique layout.
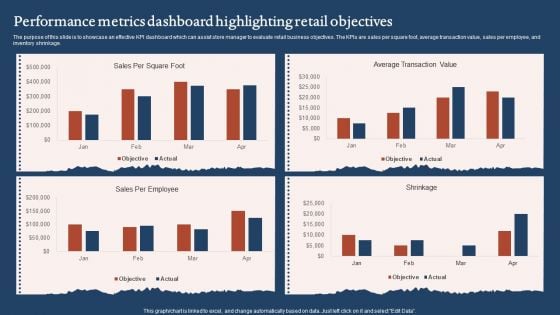
Performance Metrics Dashboard Highlighting Retail Objectives Sample PDF
The purpose of this slide is to showcase an effective KPI dashboard which can assist store manager to evaluate retail business objectives. The KPIs are sales per square foot, average transaction value, sales per employee, and inventory shrinkage. Pitch your topic with ease and precision using this Performance Metrics Dashboard Highlighting Retail Objectives Sample PDF. This layout presents information on Average Transaction Value, Sales Per Employee. It is also available for immediate download and adjustment. So, changes can be made in the color, design, graphics or any other component to create a unique layout.
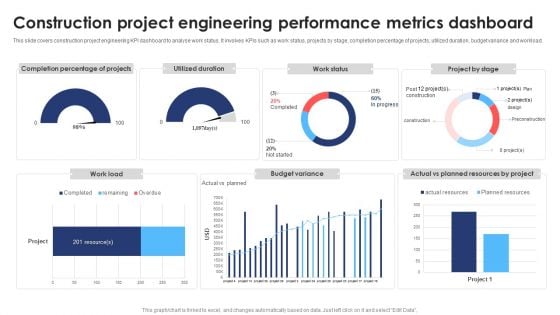
Construction Project Engineering Performance Metrics Dashboard Ideas PDF
This slide covers construction project engineering KPI dashboard to analyse work status. It involves KPIs such as work status, projects by stage, completion percentage of projects, utilized duration, budget variance and workload. Showcasing this set of slides titled Construction Project Engineering Performance Metrics Dashboard Ideas PDF. The topics addressed in these templates are Budget Variance, Resource, Project. All the content presented in this PPT design is completely editable. Download it and make adjustments in color, background, font etc. as per your unique business setting.
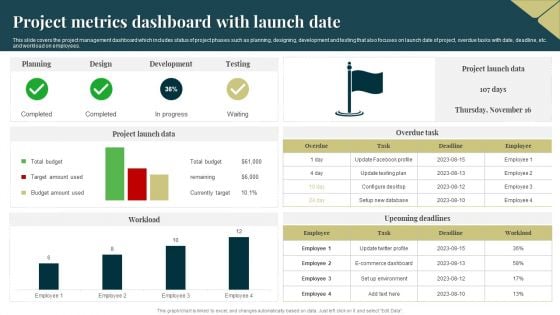
Project Metrics Dashboard With Launch Date Formats PDF
This slide covers the project management dashboard which includes status of project phases such as planning, designing, development and testing that also focuses on launch date of project, overdue tasks with date, deadline, etc. and workload on employees. Showcasing this set of slides titled Project Metrics Dashboard With Launch Date Formats PDF. The topics addressed in these templates are Budget, Project Launch Data, Development. All the content presented in this PPT design is completely editable. Download it and make adjustments in color, background, font etc. as per your unique business setting.
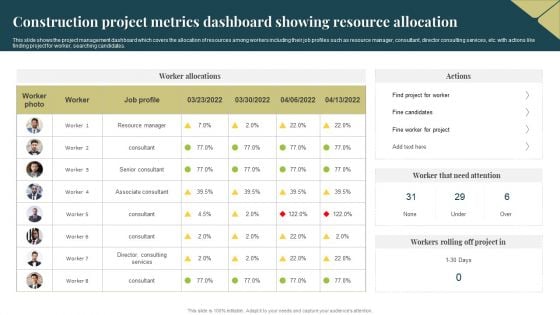
Construction Project Metrics Dashboard Showing Resource Allocation Professional PDF
This slide shows the project management dashboard which covers the allocation of resources among workers including their job profiles such as resource manager, consultant, director consulting services, etc. with actions like finding project for worker, searching candidates. Showcasing this set of slides titled Construction Project Metrics Dashboard Showing Resource Allocation Professional PDF. The topics addressed in these templates are Resource Manager, Services, Project. All the content presented in this PPT design is completely editable. Download it and make adjustments in color, background, font etc. as per your unique business setting.
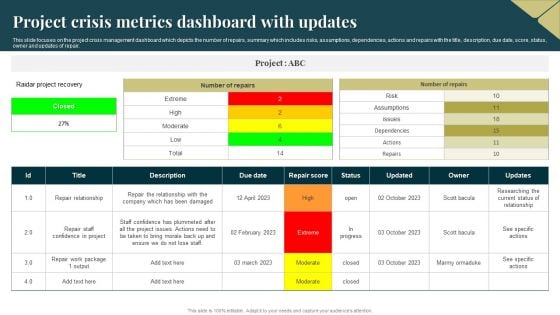
Project Crisis Metrics Dashboard With Updates Sample PDF
This slide focuses on the project crisis management dashboard which depicts the number of repairs, summary which includes risks, assumptions, dependencies, actions and repairs with the title, description, due date, score, status, owner and updates of repair. Showcasing this set of slides titled Project Crisis Metrics Dashboard With Updates Sample PDF. The topics addressed in these templates are Project, Risk, Damaged. All the content presented in this PPT design is completely editable. Download it and make adjustments in color, background, font etc. as per your unique business setting.
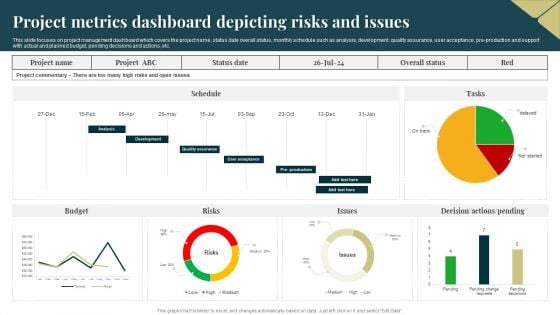
Project Metrics Dashboard Depicting Risks And Issues Rules PDF
This slide focuses on project management dashboard which covers the project name, status date overall status, monthly schedule such as analysis, development, quality assurance, user acceptance, pre production and support with actual and planned budget, pending decisions and actions, etc. Showcasing this set of slides titled Project Metrics Dashboard Depicting Risks And Issues Rules PDF. The topics addressed in these templates are Budget, Risks, Project. All the content presented in this PPT design is completely editable. Download it and make adjustments in color, background, font etc. as per your unique business setting.

 Home
Home