Metrics Dashboard
Lead Tracking Dashboard With Metric Comparison Brochure PDF
This slide showcases dashboard of lead pipeline that can help to identify total number of leads generated and expenses incurred to acquire the audience. It also showcases other key performance metrics like lead breakdown by status and number of leads per month. Pitch your topic with ease and precision using this Lead Tracking Dashboard With Metric Comparison Brochure PDF. This layout presents information on Metric Comparison, Lead Pipeline, Lead Breakdown Status. It is also available for immediate download and adjustment. So, changes can be made in the color, design, graphics or any other component to create a unique layout.
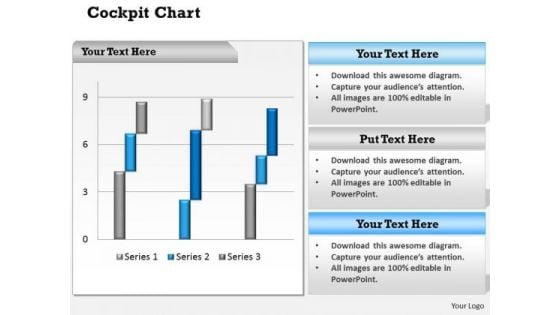
Business Cycle Diagram Dashboard Design Business Metrics Marketing Diagram
Analyze Ailments On Our Business Cycle Diagram Dashboard Design Business Metrics Marketing Diagram Powerpoint Templates. Bring Out The Thinking Doctor In You. Dock Your Thoughts With Our Business Cycle Diagram Dashboard Design Business Metrics Marketing Diagram Powerpoint Templates. They Will Launch Them Into Orbit.
Cyber Security Threat Dashboard With KPI Metrics Icons PDF
This slide shows dashboard of cyber threats to organization and metrics and performance indicators for security officer. It covers operational health, audit and compliance, controls health and project status. Showcasing this set of slides titled Cyber Security Threat Dashboard With KPI Metrics Icons PDF. The topics addressed in these templates are Cyber Security Threat Dashboard, Kpi Metrics. All the content presented in this PPT design is completely editable. Download it and make adjustments in color, background, font etc. as per your unique business setting.
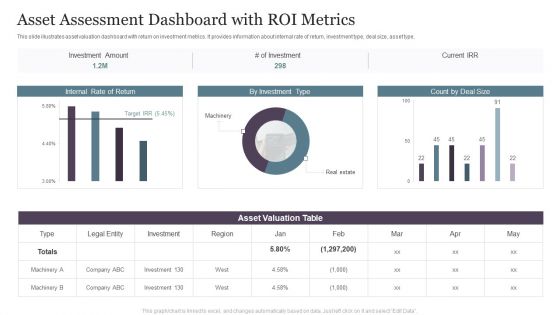
Asset Assessment Dashboard With ROI Metrics Topics PDF
This slide illustrates asset valuation dashboard with return on investment metrics. It provides information about internal rate of return, investment type, deal size, asset type, Pitch your topic with ease and precision using this Asset Assessment Dashboard With ROI Metrics Topics PDF. This layout presents information on Investment Amount, Asset Valuation, Internal Return. It is also available for immediate download and adjustment. So, changes can be made in the color, design, graphics or any other component to create a unique layout.
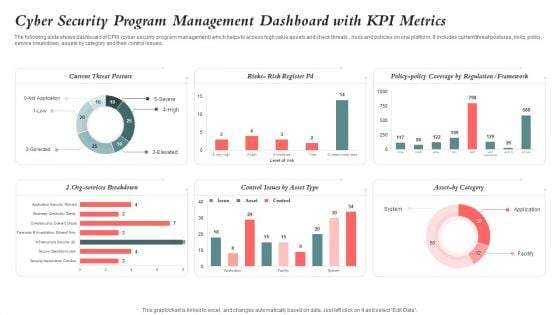
Cyber Security Program Management Dashboard With KPI Metrics Ideas PDF
The following slide shows dashboard of CPM cyber security program management which helps to access high value assets and check threats , risks and policies on one platform. It includes current threat postures, risks, policy, service breakdown, assets by category and their control issues. Pitch your topic with ease and precision using this Cyber Security Program Management Dashboard With KPI Metrics Ideas PDF. This layout presents information on Cyber Security, Program Management Dashboard, Kpi Metrics. It is also available for immediate download and adjustment. So, changes can be made in the color, design, graphics or any other component to create a unique layout.

Employee Feedback Dashboard With Key Metrics Elements PDF
The following slide depicts the key insights of the feedback survey to gauge employee engagement at different department levels. It includes metrics such as engagement score, response rate, no. of comments etc.Showcasing this set of slides titled Employee Feedback Dashboard With Key Metrics Elements PDF The topics addressed in these templates are Employee Feedback Dashboard With Key Metrics All the content presented in this PPT design is completely editable. Download it and make adjustments in color, background, font etc. as per your unique business setting.
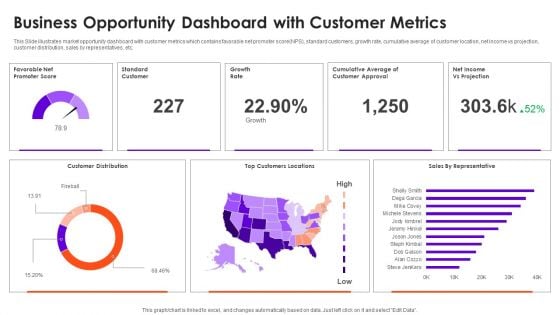
Business Opportunity Dashboard With Customer Metrics Information PDF
This Slide illustrates market opportunity dashboard with customer metrics which contains favorable net promoter score NPS, standard customers, growth rate, cumulative average of customer location, net income vs projection, customer distribution, sales by representatives, etc. Pitch your topic with ease and precision using this Business Opportunity Dashboard With Customer Metrics Information PDF. This layout presents information on Customer Distribution, Growth Rate, Top Customers Locations. It is also available for immediate download and adjustment. So, changes can be made in the color, design, graphics or any other component to create a unique layout.
Tracking Departure Metrics For Employee Exit Interview Dashboard Portrait Pdf
This slide exhibits KPI dashboard of exit interview for visual representation and consolidated data aggregation. It include metrics such as Current employee, Forms submitted, Moving new position, etc. Showcasing this set of slides titled Tracking Departure Metrics For Employee Exit Interview Dashboard Portrait Pdf The topics addressed in these templates are Exit Interview Dashboard, Forms Submitted, Moving New Position All the content presented in this PPT design is completely editable. Download it and make adjustments in color, background, font etc. as per your unique business setting. This slide exhibits KPI dashboard of exit interview for visual representation and consolidated data aggregation. It include metrics such as Current employee, Forms submitted, Moving new position, etc.
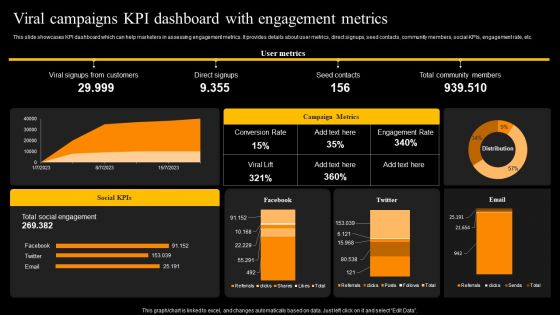
Viral Campaigns Kpi Dashboard With Engagement Metrics Template PDF
This slide showcases KPI dashboard which can help marketers in assessing engagement metrics. It provides details about user metrics, direct signups, seed contacts, community members, social KPIs, engagement rate, etc. Want to ace your presentation in front of a live audience Our Viral Campaigns Kpi Dashboard With Engagement Metrics Template PDF can help you do that by engaging all the users towards you. Slidegeeks experts have put their efforts and expertise into creating these impeccable powerpoint presentations so that you can communicate your ideas clearly. Moreover, all the templates are customizable, and easy to edit and downloadable. Use these for both personal and commercial use.
Transformation KPI Dashboard With Key Metrics And Status Icons PDF
Pitch your topic with ease and precision using this Transformation KPI Dashboard With Key Metrics And Status Icons PDF. This layout presents information on Measure, System Implemented, Innovation. It is also available for immediate download and adjustment. So, changes can be made in the color, design, graphics or any other component to create a unique layout.
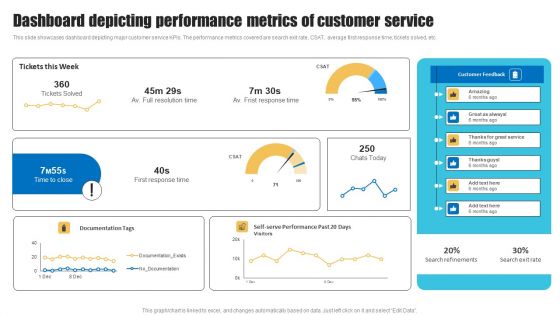
Dashboard Depicting Performance Metrics Of Customer Service Template PDF
This slide showcases dashboard depicting major customer service KPIs. The performance metrics covered are search exit rate, CSAT, average first response time, tickets solved, etc. Take your projects to the next level with our ultimate collection of Dashboard Depicting Performance Metrics Of Customer Service Template PDF. Slidegeeks has designed a range of layouts that are perfect for representing task or activity duration, keeping track of all your deadlines at a glance. Tailor these designs to your exact needs and give them a truly corporate look with your own brand colors they will make your projects stand out from the rest.
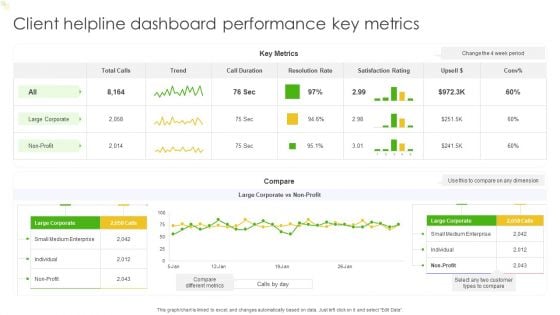
Client Helpline Dashboard Performance Key Metrics Ppt Outline Deck PDF
This graph or chart is linked to excel, and changes automatically based on data. Just left click on it and select Edit Data. Pitch your topic with ease and precision using this Client Helpline Dashboard Performance Key Metrics Ppt Outline Deck PDF. This layout presents information on Key Metrics, Trend, Compare. It is also available for immediate download and adjustment. So, changes can be made in the color, design, graphics or any other component to create a unique layout.
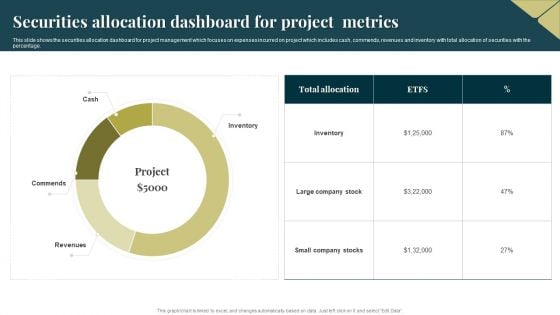
Securities Allocation Dashboard For Project Metrics Information PDF
This slide shows the securities allocation dashboard for project management which focuses on expenses incurred on project which includes cash, commends, revenues and inventory with total allocation of securities with the percentage. Showcasing this set of slides titled Securities Allocation Dashboard For Project Metrics Information PDF. The topics addressed in these templates are Inventory, Project, Revenues. All the content presented in this PPT design is completely editable. Download it and make adjustments in color, background, font etc. as per your unique business setting.
Market Penetration Dashboard With Sales Metrics Ppt Icon Examples PDF
This slide shows market penetration dashboard for sales team. It provides information about regions, emerging markets, planned sales, actual sales, revenue, gender wise sales, etc. Pitch your topic with ease and precision using this Market Penetration Dashboard With Sales Metrics Ppt Icon Examples PDF. This layout presents information on Emerging Markets, Sales Gender, Actual Sales. It is also available for immediate download and adjustment. So, changes can be made in the color, design, graphics or any other component to create a unique layout.
Project Tracking Dashboard With Multiple Metrics Pictures PDF
The following slide highlights the KPI of project management to avoid deviations. It includes elements such as schedule, tasks, issue assessment, budget and risk analysis etc. Pitch your topic with ease and precision using this Project Tracking Dashboard With Multiple Metrics Pictures PDF. This layout presents information on Projected Budget Analysis, Risk Analysis, Quality Affirmation. It is also available for immediate download and adjustment. So, changes can be made in the color, design, graphics or any other component to create a unique layout.

Brand Advertisement Plan Dashboard With Advertising Metrics Inspiration PDF
The following slide showcases marketing plan dashboard to improve the market share of brand and increase revenue. It includes metrics such as brand awareness, commitment, attributes, market share, repeat purchase and frequency profile etc Showcasing this set of slides titled Brand Advertisement Plan Dashboard With Advertising Metrics Inspiration PDF. The topics addressed in these templates are Brand Awareness, Brand Commitment, Awareness. All the content presented in this PPT design is completely editable. Download it and make adjustments in color, background, font etc. as per your unique business setting.
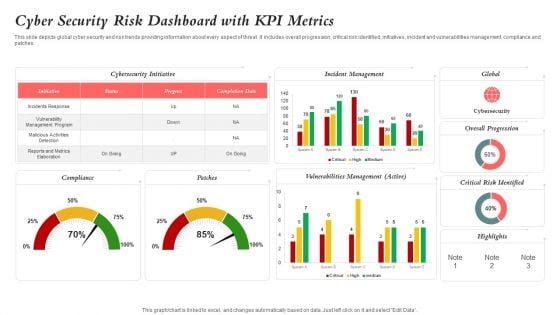
Cyber Security Risk Dashboard With KPI Metrics Elements PDF
This slide depicts global cyber security and risk trends providing information about every aspect of threat. It includes overall progression, critical risk identified, initiatives, incident and vulnerabilities management, compliance and patches. Showcasing this set of slides titled Cyber Security Risk Dashboard With KPI Metrics Elements PDF. The topics addressed in these templates are Vulnerability Management Program, Reports And Metrics Elaboration, Critical Risk Identified. All the content presented in this PPT design is completely editable. Download it and make adjustments in color, background, font etc. as per your unique business setting.
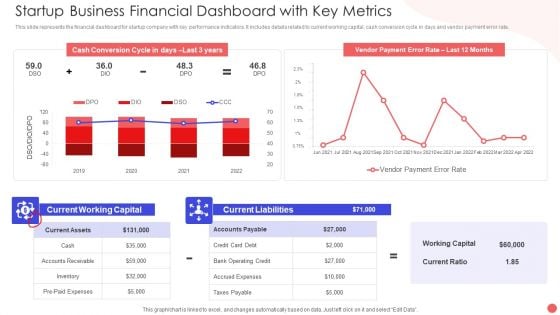
Startup Business Financial Dashboard With Key Metrics Sample PDF
This slide represents the financial dashboard for startup company with key performance indicators. It includes details related to current working capital, cash conversion cycle in days and vendor payment error rate. Pitch your topic with ease and precision using this Startup Business Financial Dashboard With Key Metrics Sample PDF. This layout presents information on Cash Conversion Cycle, Current Working Capital, Current Liabilities Debt. It is also available for immediate download and adjustment. So, changes can be made in the color, design, graphics or any other component to create a unique layout.
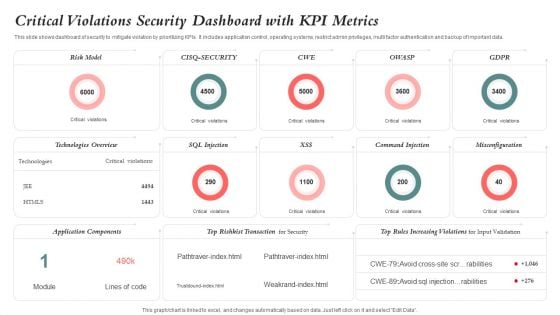
Critical Violations Security Dashboard With KPI Metrics Graphics PDF
This slide shows dashboard of security to mitigate violation by prioritizing KPIs. It includes application control, operating systems, restrict admin privileges, multi factor authentication and backup of important data. Showcasing this set of slides titled Critical Violations Security Dashboard With KPI Metrics Graphics PDF. The topics addressed in these templates are Risk Model, Application Components, Technologies Overview. All the content presented in this PPT design is completely editable. Download it and make adjustments in color, background, font etc. as per your unique business setting.
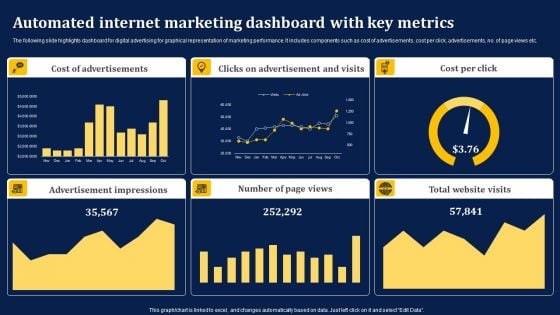
Automated Internet Marketing Dashboard With Key Metrics Information PDF
The following slide highlights dashboard for digital advertising for graphical representation of marketing performance. It includes components such as cost of advertisements, cost per click, advertisements, no. of page views etc. Showcasing this set of slides titled Automated Internet Marketing Dashboard With Key Metrics Information PDF. The topics addressed in these templates are Cost Advertisements, Clicks Advertisement, Cost Per Click. All the content presented in this PPT design is completely editable. Download it and make adjustments in color, background, font etc. as per your unique business setting.
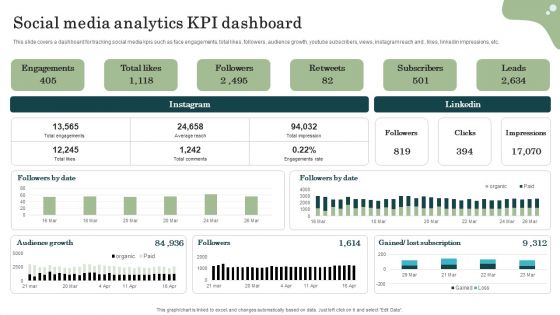
Marketing Success Metrics Social Media Analytics KPI Dashboard Elements PDF
This slide covers a dashboard for tracking social media kpis such as face engagements, total likes, followers, audience growth, youtube subscribers, views, instagram reach and , likes, linkedin impressions, etc. Find a pre-designed and impeccable Marketing Success Metrics Social Media Analytics KPI Dashboard Elements PDF. The templates can ace your presentation without additional effort. You can download these easy-to-edit presentation templates to make your presentation stand out from others. So, what are you waiting for Download the template from Slidegeeks today and give a unique touch to your presentation.
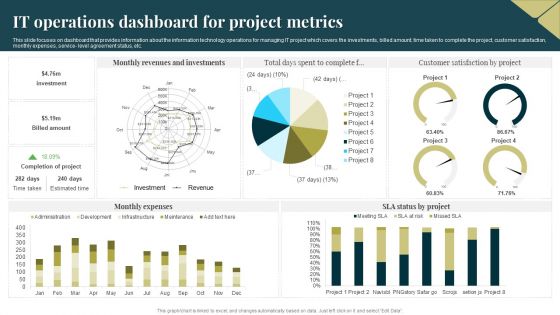
IT Operations Dashboard For Project Metrics Portrait PDF
This slide focuses on dashboard that provides information about the information technology operations for managing IT project which covers the investments, billed amount, time taken to complete the project, customer satisfaction, monthly expenses, service level agreement status, etc. Pitch your topic with ease and precision using this IT Operations Dashboard For Project Metrics Portrait PDF. This layout presents information on Revenues, Investments, Monthly Expenses. It is also available for immediate download and adjustment. So, changes can be made in the color, design, graphics or any other component to create a unique layout.
Cyber Security Team Analytics Dashboard With KPI Metrics Icons PDF
The following slide shows cyber analytics dashboard to monitor and inspect threats and accordingly plan preventive actions. It includes open and resolved incidents and tickets. Pitch your topic with ease and precision using this Cyber Security Team Analytics Dashboard With KPI Metrics Icons PDF. This layout presents information on Energy Security Team, Digital Security Center, Security Operations Center. It is also available for immediate download and adjustment. So, changes can be made in the color, design, graphics or any other component to create a unique layout.
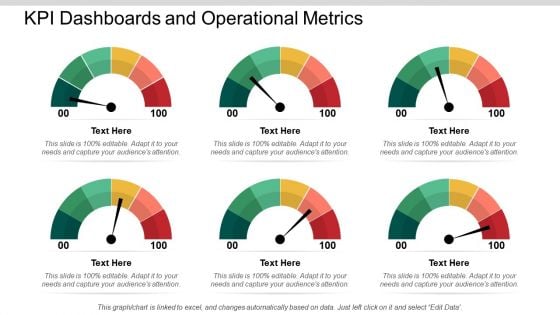
KPI Dashboards And Operational Metrics Ppt PowerPoint Presentation Portfolio Infographics
Lead Tracking Dashboard Icon With Key Metrics Clipart PDF
Persuade your audience using this Lead Tracking Dashboard Icon With Key Metrics Clipart PDF. This PPT design covers three stages, thus making it a great tool to use. It also caters to a variety of topics including Lead Tracking, Dashboard, Key Metrics. Download this PPT design now to present a convincing pitch that not only emphasizes the topic but also showcases your presentation skills.
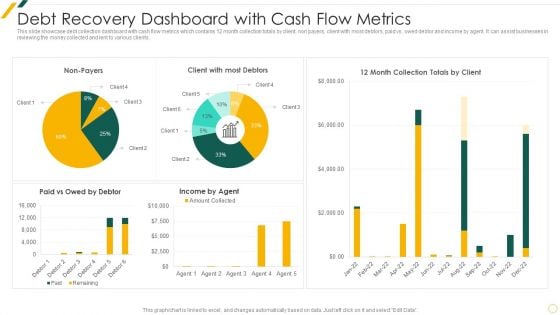
Debt Recovery Dashboard With Cash Flow Metrics Summary PDF
This slide showcase debt collection dashboard with cash flow metrics which contains 12 month collection totals by client, non payers, client with most debtors, paid vs. owed debtor and income by agent. It can assist businesses in reviewing the money collected and lent to various clients.Pitch your topic with ease and precision using this Debt Recovery Dashboard With Cash Flow Metrics Summary PDF This layout presents information on Debt Recovery, Dashboard Cash, Flow Metrics It is also available for immediate download and adjustment. So, changes can be made in the color, design, graphics or any other component to create a unique layout.
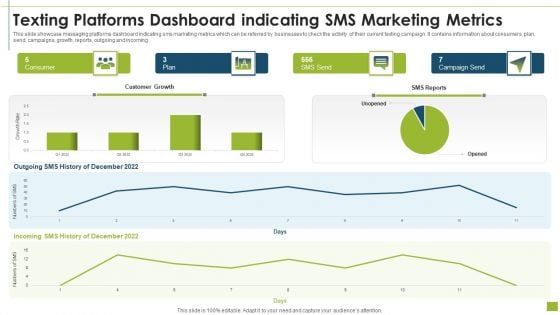
Texting Platforms Dashboard Indicating SMS Marketing Metrics Designs PDF
This slide showcase messaging platforms dashboard indicating sms marketing metrics which can be referred by businesses to check the activity of their current texting campaign. It contains information about consumers, plan, send, campaigns, growth, reports, outgoing and incoming.Pitch your topic with ease and precision using this texting platforms dashboard indicating sms marketing metrics designs pdf This layout presents information on texting platforms dashboard indicating sms marketing metrics It is also available for immediate download and adjustment. So, changes can be made in the color, design, graphics or any other component to create a unique layout.
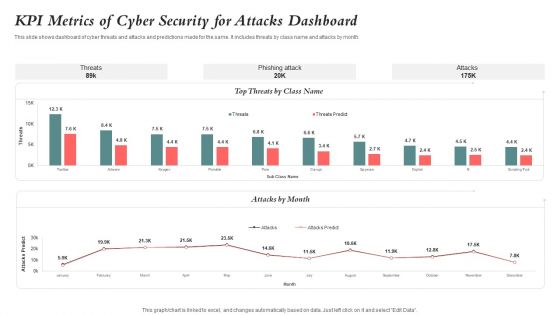
KPI Metrics Of Cyber Security For Attacks Dashboard Guidelines PDF
This slide shows dashboard of cyber threats and attacks and predictions made for the same. It includes threats by class name and attacks by month. Showcasing this set of slides titled KPI Metrics Of Cyber Security For Attacks Dashboard Guidelines PDF. The topics addressed in these templates are Kpi Metrics, Cyber Security, Attacks Dashboard. All the content presented in this PPT design is completely editable. Download it and make adjustments in color, background, font etc. as per your unique business setting.

Dashboard For Monthly Recruitment Metrics And Analytics Themes PDF
The slide depicts the dashboard for monthly recruitment metrics and analytics depicting monthly recruitment, recruitment by department and source, candidate feedback and offer acceptance rate.Showcasing this set of slides titled Dashboard For Monthly Recruitment Metrics And Analytics Themes PDF The topics addressed in these templates are Recruitment Department, Recruitment Source, Interview Activity All the content presented in this PPT design is completely editable. Download it and make adjustments in color, background, font etc. as per your unique business setting.
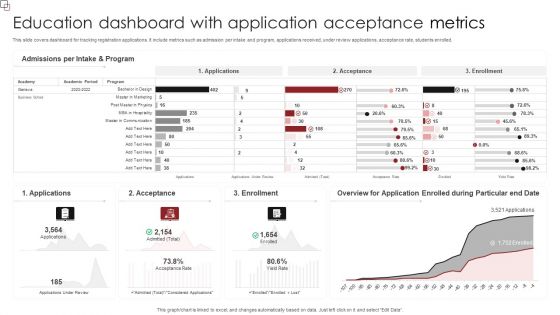
Education Dashboard With Application Acceptance Metrics Clipart PDF
This slide covers dashboard for tracking registration applications. It include metrics such as admission per intake and program, applications received, under review applications, acceptance rate, students enrolled. Showcasing this set of slides titled Education Dashboard With Application Acceptance Metrics Clipart PDF. The topics addressed in these templates are Admissions Per, Intake And Program, Enrollment. All the content presented in this PPT design is completely editable. Download it and make adjustments in color, background, font etc. as per your unique business setting.
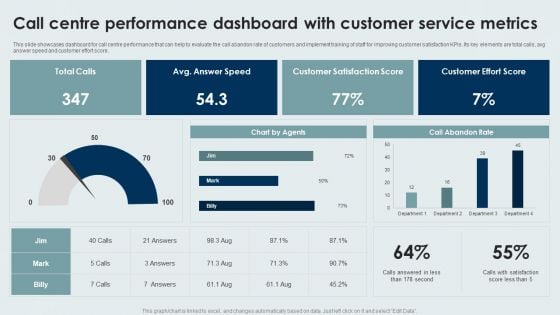
Call Centre Performance Dashboard With Customer Service Metrics Background PDF
This slide showcases dashboard for call centre performance that can help to evaluate the call abandon rate of customers and implement training of staff for improving customer satisfaction KPIs. Its key elements are total calls, avg answer speed and customer effort score. Showcasing this set of slides titled Call Centre Performance Dashboard With Customer Service Metrics Background PDF. The topics addressed in these templates are Call Centre Performance Dashboard, Customer Service Metrics. All the content presented in this PPT design is completely editable. Download it and make adjustments in color, background, font etc. as per your unique business setting.
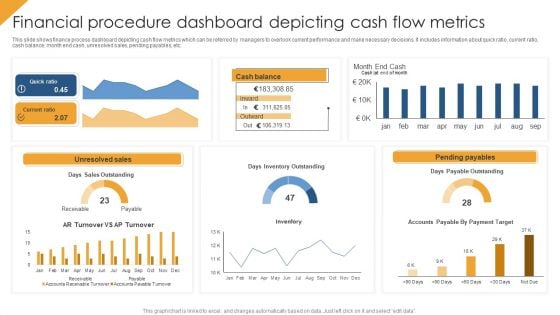
Financial Procedure Dashboard Depicting Cash Flow Metrics Structure PDF
This slide shows finance process dashboard depicting cash flow metrics which can be referred by managers to overlook current performance and make necessary decisions. It includes information about quick ratio, current ratio, cash balance, month end cash, unresolved sales, pending payables, etc. Pitch your topic with ease and precision using this Financial Procedure Dashboard Depicting Cash Flow Metrics Structure PDF. This layout presents information on Quick Ratio, Unresolved Sales, Pending Payables. It is also available for immediate download and adjustment. So, changes can be made in the color, design, graphics or any other component to create a unique layout.
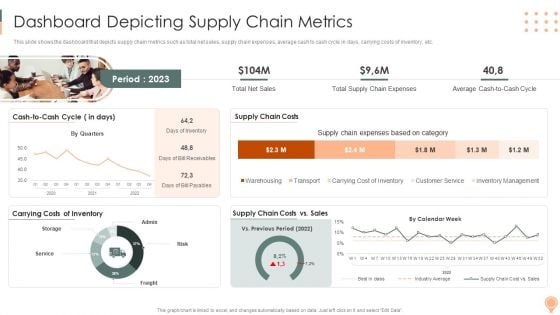
Supply Chain Approaches Dashboard Depicting Supply Chain Metrics Background PDF
This slide shows the dashboard that depicts supply chain metrics such as total net sales, supply chain expenses, average cash to cash cycle in days, carrying costs of inventory, etc.Deliver and pitch your topic in the best possible manner with this Supply Chain Approaches Dashboard Depicting Supply Chain Metrics Background PDF. Use them to share invaluable insights on Supply Chain, Expenses Based Category, Chain Expenses and impress your audience. This template can be altered and modified as per your expectations. So, grab it now.
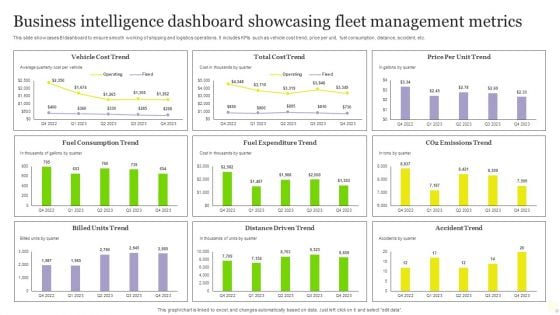
Business Intelligence Dashboard Showcasing Fleet Management Metrics Elements PDF
This slide showcases BI dashboard to ensure smooth working of shipping and logistics operations. It includes KPIs such as vehicle cost trend, price per unit, fuel consumption, distance, accident, etc. Showcasing this set of slides titled Business Intelligence Dashboard Showcasing Fleet Management Metrics Elements PDF. The topics addressed in these templates are Cost Trend, Price Per Unit Trend, Vehicle Cost Trend. All the content presented in this PPT design is completely editable. Download it and make adjustments in color, background, font etc. as per your unique business setting.
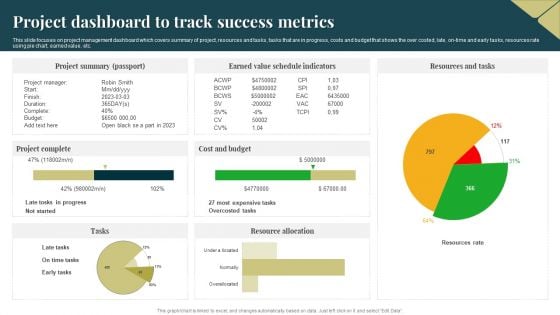
Project Dashboard To Track Success Metrics Background PDF
This slide focuses on project management dashboard which covers summary of project, resources and tasks, tasks that are in progress, costs and budget that shows the over costed, late, on time and early tasks, resources rate using pie chart, earned value, etc. Pitch your topic with ease and precision using this Project Dashboard To Track Success Metrics Background PDF. This layout presents information on Cost And Budget, Project Summary, Resource Allocation. It is also available for immediate download and adjustment. So, changes can be made in the color, design, graphics or any other component to create a unique layout.
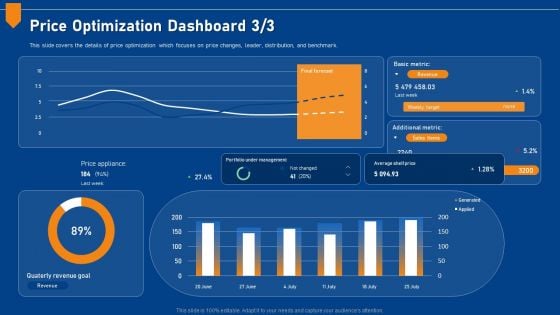
Evaluating Price Efficiency In Organization Price Optimization Dashboard Metric Designs PDF
This slide covers the details of price optimization which focuses on price changes, leader, distribution, and benchmark. Deliver and pitch your topic in the best possible manner with this evaluating price efficiency in organization price optimization dashboard metric designs pdf. Use them to share invaluable insights on portfolio, management, price, revenue, target and impress your audience. This template can be altered and modified as per your expectations. So, grab it now.
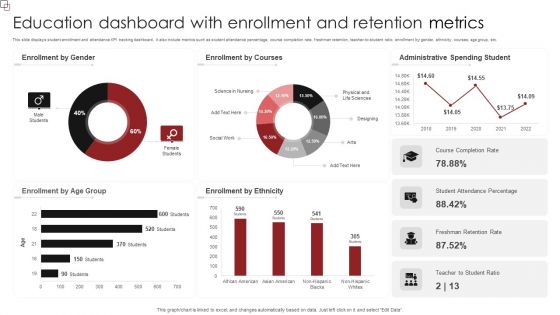
Education Dashboard With Enrollment And Retention Metrics Sample PDF
This slide displays student enrollment and attendance KPI tracking dashboard. It also include metrics such as student attendance percentage, course completion rate, freshman retention, teacher-to-student ratio, enrollment by gender, ethnicity, courses, age group, etc. Pitch your topic with ease and precision using this Education Dashboard With Enrollment And Retention Metrics Sample PDF. This layout presents information on Enrollment Gender, Enrollment Courses, Administrative Spending Student. It is also available for immediate download and adjustment. So, changes can be made in the color, design, graphics or any other component to create a unique layout.
Dashboard For Tracking Sales Target Metrics Introduction PDF
This slide presents KPI dashboard for tracking Sales Target Metrics achievement monthly and region wise helpful in adjusting activities as per ongoing performance. It includes average weekly sales revenue, average sales target, annual sales growth, regional sales performance and average revenue per unit that should be regularly tracked. Showcasing this set of slides titled Dashboard For Tracking Sales Target Metrics Introduction PDF. The topics addressed in these templates are Average Revenue, Per Unit, Average Weekly, Sales Revenue. All the content presented in this PPT design is completely editable. Download it and make adjustments in color, background, font etc. as per your unique business setting.
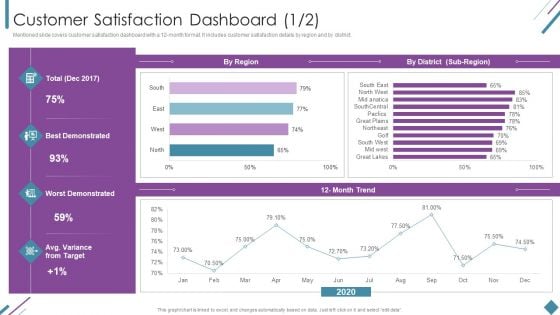
Metrics To Measure Business Performance Customer Satisfaction Dashboard Summary PDF
Mentioned slide covers customer satisfaction dashboard with a 12-month format. It includes customer satisfaction details by region and by district. Deliver an awe inspiring pitch with this creative Metrics To Measure Business Performance Customer Satisfaction Dashboard Summary PDF bundle. Topics like Best Demonstrated, Worst Demonstrated, 2020 can be discussed with this completely editable template. It is available for immediate download depending on the needs and requirements of the user.
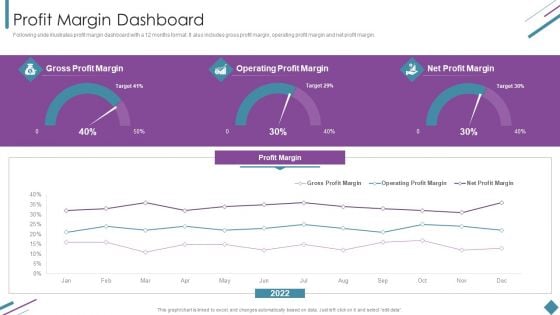
Metrics To Measure Business Performance Profit Margin Dashboard Designs PDF
Following slide illustrates profit margin dashboard with a 12 months format. It also includes gross profit margin, operating profit margin and net profit margin. Deliver and pitch your topic in the best possible manner with this Metrics To Measure Business Performance Profit Margin Dashboard Designs PDF. Use them to share invaluable insights on Gross Profit Margin, Operating Profit Margin, Net Profit Margin and impress your audience. This template can be altered and modified as per your expectations. So, grab it now.
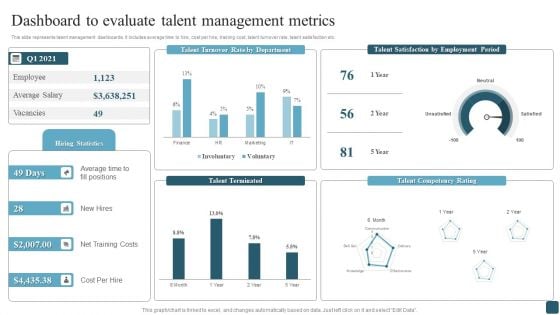
Dashboard To Evaluate Talent Management Metrics Professional PDF
This slide represents talent management dashboards. It includes average time to hire, cost per hire, training cost, talent turnover rate, talent satisfaction etc. Whether you have daily or monthly meetings, a brilliant presentation is necessary. Dashboard To Evaluate Talent Management Metrics Professional PDF can be your best option for delivering a presentation. Represent everything in detail using Dashboard To Evaluate Talent Management Metrics Professional PDF and make yourself stand out in meetings. The template is versatile and follows a structure that will cater to your requirements. All the templates prepared by Slidegeeks are easy to download and edit. Our research experts have taken care of the corporate themes as well. So, give it a try and see the results.
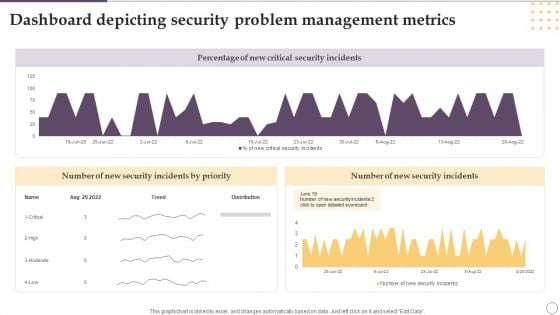
Dashboard Depicting Security Problem Management Metrics Ppt Gallery Designs PDF
This graph or chart is linked to excel, and changes automatically based on data. Just left click on it and select Edit Data. Showcasing this set of slides titled Dashboard Depicting Security Problem Management Metrics Ppt Gallery Designs PDF. The topics addressed in these templates are Percentage, New Critical, Security Incidents. All the content presented in this PPT design is completely editable. Download it and make adjustments in color, background, font etc. as per your unique business setting.
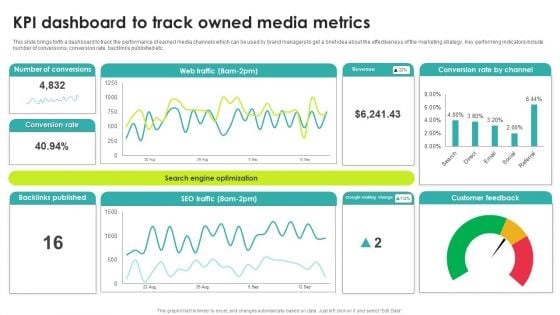
Kpi Dashboard To Track Owned Media Metrics Rules PDF
This slide brings forth a dashboard to track the performance of earned media channels which can be used by brand managers to get a brief idea about the effectiveness of the marketing strategy. Key performing indicators include number of conversions, conversion rate, backlinks published etc. Pitch your topic with ease and precision using this Kpi Dashboard To Track Owned Media Metrics Rules PDF. This layout presents information on Conversions, Backlinks Published, Metrics. It is also available for immediate download and adjustment. So, changes can be made in the color, design, graphics or any other component to create a unique layout.
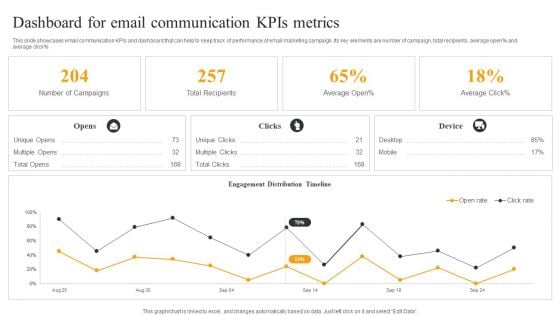
Dashboard For Email Communication Kpis Metrics Topics PDF
This slide showcases email communication KPIs and dashboard that can help to keep track of performance of email marketing campaign. Its key elements are number of campaign, total recipients, average open percent and average click percent. Showcasing this set of slides titled Dashboard For Email Communication Kpis Metrics Topics PDF. The topics addressed in these templates are Number Campaigns, Total Recipients, Engagement Distribution. All the content presented in this PPT design is completely editable. Download it and make adjustments in color, background, font etc. as per your unique business setting.
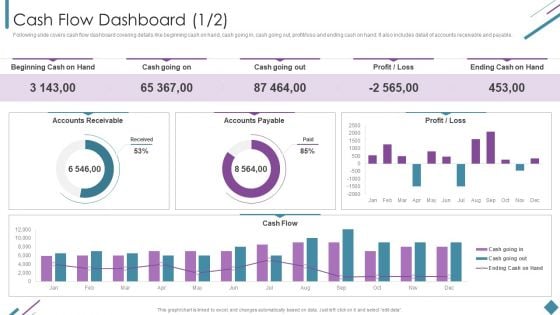
Metrics To Measure Business Performance Cash Flow Dashboard Rules PDF
Following slide covers cash flow dashboard covering details like beginning cash on hand, cash going in, cash going out, profit or loss and ending cash on hand. It also includes detail of accounts receivable and payable. Deliver an awe inspiring pitch with this creative Metrics To Measure Business Performance Cash Flow Dashboard Rules PDF bundle. Topics like Beginning Cash Hand, Cash Going Out, Accounts Payable, Accounts Receivable can be discussed with this completely editable template. It is available for immediate download depending on the needs and requirements of the user.
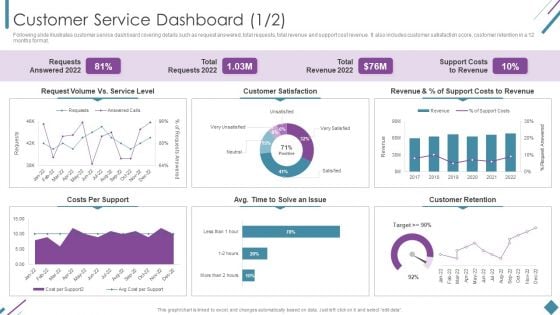
Metrics To Measure Business Performance Customer Service Dashboard Sample PDF
Following slide illustrates customer service dashboard covering details such as request answered, total requests, total revenue and support cost revenue. It also includes customer satisfaction score, customer retention in a 12 months format. Deliver and pitch your topic in the best possible manner with this Metrics To Measure Business Performance Customer Service Dashboard Sample PDF. Use them to share invaluable insights on Requests Answered 2022, Total Requests 2022, Total Revenue 2022 and impress your audience. This template can be altered and modified as per your expectations. So, grab it now.
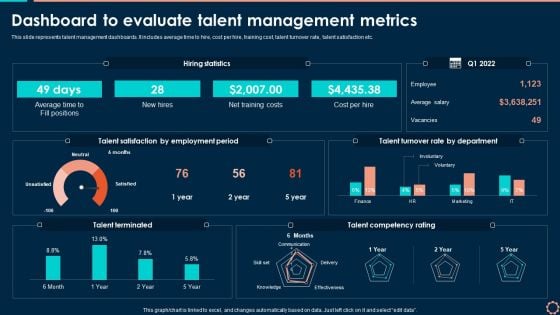
Dashboard To Evaluate Talent Management Metrics Topics PDF
This slide represents talent management dashboards. It includes average time to hire, cost per hire, training cost, talent turnover rate, talent satisfaction etc. Boost your pitch with our creative Dashboard To Evaluate Talent Management Metrics Topics PDF. Deliver an awe inspiring pitch that will mesmerize everyone. Using these presentation templates you will surely catch everyones attention. You can browse the ppts collection on our website. We have researchers who are experts at creating the right content for the templates. So you do not have to invest time in any additional work. Just grab the template now and use them.
SEO Dashboard Funnel Metrics Ppt PowerPoint Presentation Visual Aids Layouts Cpb
Presenting this set of slides with name seo dashboard funnel metrics ppt powerpoint presentation visual aids layouts cpb. This is a six stage process. The stages in this process are seo dashboard funnel metrics. This is a completely editable PowerPoint presentation and is available for immediate download. Download now and impress your audience.
Robotic Process Automation Metrics Performance Analysis KPI Dashboard Icon Graphics PDF
Pitch your topic with ease and precision using this Robotic Process Automation Metrics Performance Analysis KPI Dashboard Icon Graphics PDF. This layout presents information on Robotic Process Automation Metrics, Performance Analysis, Kpi Dashboard Icon. It is also available for immediate download and adjustment. So, changes can be made in the color, design, graphics or any other component to create a unique layout.
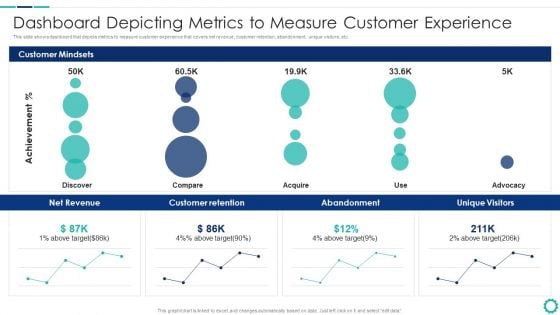
Creating Successful Strategies To Enhance Customer Experience Dashboard Depicting Metrics To Measure Slides PDF
This slide shows dashboard that depicts metrics to measure customer experience that covers net revenue, customer retention, abandonment, unique visitors, etc.Deliver an awe inspiring pitch with this creative Creating Successful Strategies To Enhance Customer Experience Dashboard Depicting Metrics To Measure Slides PDF bundle. Topics like Customer Retention, Abandonment, Unique Visitors can be discussed with this completely editable template. It is available for immediate download depending on the needs and requirements of the user.
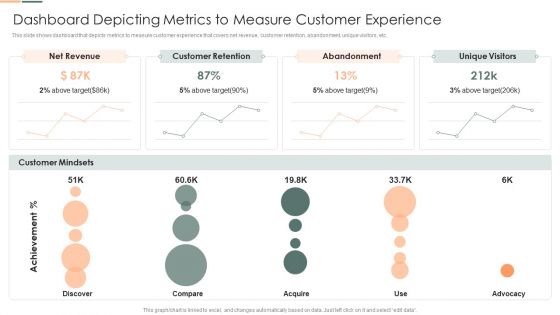
Developing Client Engagement Techniques Dashboard Depicting Metrics To Measure Customer Experience Summary PDF
This slide shows dashboard that depicts metrics to measure customer experience that covers net revenue, customer retention, abandonment, unique visitors, etc. Deliver and pitch your topic in the best possible manner with this Developing Client Engagement Techniques Dashboard Depicting Metrics To Measure Customer Experience Summary PDF. Use them to share invaluable insights on Customer Mindsets, Net Revenue, Customer Retention and impress your audience. This template can be altered and modified as per your expectations. So, grab it now.
Dashboard Depicting Metrics To Measure Customer Experience Icons PDF Elements PDF
This slide shows dashboard that depicts metrics to measure customer experience that covers net revenue, customer retention, abandonment, unique visitors, etc.Deliver and pitch your topic in the best possible manner with this Dashboard Depicting Metrics To Measure Customer Experience Icons PDF Elements PDF. Use them to share invaluable insights on Customer Retention, Abandonment, Customer Mindsets and impress your audience. This template can be altered and modified as per your expectations. So, grab it now.
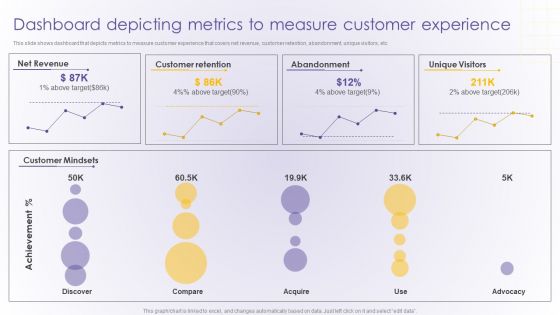
Dashboard Depicting Metrics To Measure Customer Experience Developing Online Summary PDF
This slide shows dashboard that depicts metrics to measure customer experience that covers net revenue, customer retention, abandonment, unique visitors, etc.Deliver an awe inspiring pitch with this creative Dashboard Depicting Metrics To Measure Customer Experience Developing Online Summary PDF bundle. Topics like Net Revenue, Customer Retention, Abandonment can be discussed with this completely editable template. It is available for immediate download depending on the needs and requirements of the user.
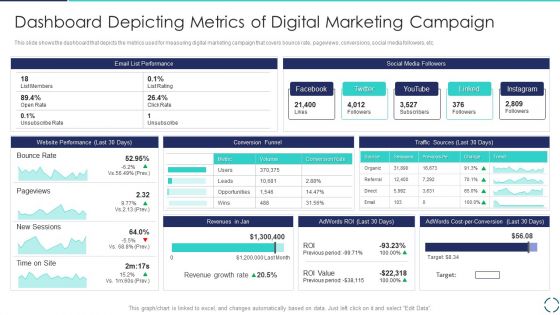
Optimizing E Business Promotion Plan Dashboard Depicting Metrics Of Digital Marketing Campaign Pictures PDF
This slide shows the dashboard that depicts the metrics used for measuring digital marketing campaign that covers bounce rate, pageviews, conversions, social media followers, etc. Deliver and pitch your topic in the best possible manner with this Optimizing E Business Promotion Plan Dashboard Depicting Metrics Of Digital Marketing Campaign Pictures PDF. Use them to share invaluable insights on Social Media, Revenues, Website Performance and impress your audience. This template can be altered and modified as per your expectations. So, grab it now.
Electronic Commerce Systems Dashboard Depicting Metrics Of Digital Marketing Campaign Icons PDF
This slide shows the dashboard that depicts the metrics used for measuring digital marketing campaign that covers bounce rate, pageviews, conversions, social media followers, etc. Deliver an awe inspiring pitch with this creative Electronic Commerce Systems Dashboard Depicting Metrics Of Digital Marketing Campaign Icons PDF bundle. Topics like Website Performance, Conversion Funnel, Traffic Sources can be discussed with this completely editable template. It is available for immediate download depending on the needs and requirements of the user.
Action Plan To Enhance Dashboard Depicting Metrics To Measure Customer Icons PDF
This slide shows dashboard that depicts metrics to measure customer experience that covers net revenue, customer retention, abandonment, unique visitors, etc. Find highly impressive Action Plan To Enhance Dashboard Depicting Metrics To Measure Customer Icons PDF on Slidegeeks to deliver a meaningful presentation. You can save an ample amount of time using these presentation templates. No need to worry to prepare everything from scratch because Slidegeeks experts have already done a huge research and work for you. You need to download Action Plan To Enhance Dashboard Depicting Metrics To Measure Customer Icons PDF for your upcoming presentation. All the presentation templates are 100 percent editable and you can change the color and personalize the content accordingly. Download now
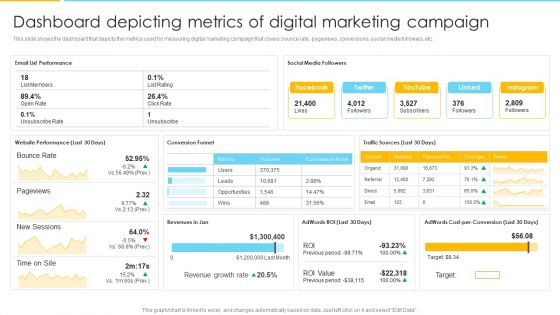
Optimizing Ecommerce Marketing Plan To Improve Sales Dashboard Depicting Metrics Of Digital Marketing Campaign Information PDF
This slide shows the dashboard that depicts the metrics used for measuring digital marketing campaign that covers bounce rate, pageviews, conversions, social media followers, etc. Deliver and pitch your topic in the best possible manner with this Optimizing Ecommerce Marketing Plan To Improve Sales Dashboard Depicting Metrics Of Digital Marketing Campaign Information PDF. Use them to share invaluable insights on Traffic Sources, Conversion Rate, Revenue Growth Rate and impress your audience. This template can be altered and modified as per your expectations. So, grab it now.
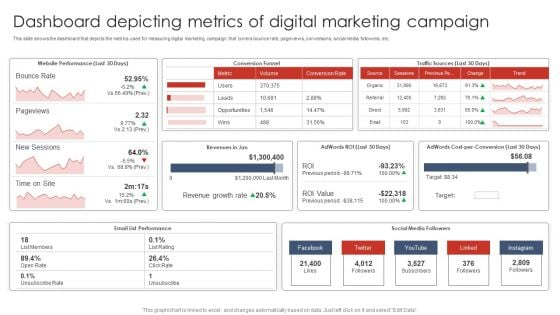
Dashboard Depicting Metrics Of Digital Marketing Campaign Digital Marketing Strategy Deployment Clipart PDF
This slide shows the dashboard that depicts the metrics used for measuring digital marketing campaign that covers bounce rate, pageviews, conversions, social media followers, etc.Slidegeeks is one of the best resources for PowerPoint templates. You can download easily and regulate Dashboard Depicting Metrics Of Digital Marketing Campaign Digital Marketing Strategy Deployment Clipart PDF for your personal presentations from our wonderful collection. A few clicks is all it takes to discover and get the most relevant and appropriate templates. Use our Templates to add a unique zing and appeal to your presentation and meetings. All the slides are easy to edit and you can use them even for advertisement purposes.
Stock Performance Dashboard For Metrics Team Management Ppt Outline Icons PDF
This slide represents the dashboard for tracking the management team member, manager, and teams ability to ensure inventory accuracy over time. It includes KPIs such as inventory, average result area scores and result areas. Pitch your topic with ease and precision using this Stock Performance Dashboard For Metrics Team Management Ppt Outline Icons PDF. This layout presents information on Result areas, Metrics Team, Needs Help. It is also available for immediate download and adjustment. So, changes can be made in the color, design, graphics or any other component to create a unique layout.
Education Dashboard Icon With Student Performance Analysis Metrics Information PDF
Presenting Education Dashboard Icon With Student Performance Analysis Metrics Information PDF to dispense important information. This template comprises four stages. It also presents valuable insights into the topics including Education Dashboard Icon, Student Performance, Analysis Metrics. This is a completely customizable PowerPoint theme that can be put to use immediately. So, download it and address the topic impactfully.

 Home
Home