Metrics List
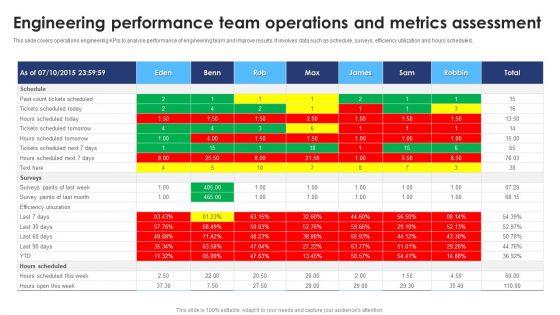
Engineering Performance Team Operations And Metrics Assessment Demonstration PDF
This slide covers operations engineering KPIs to analyse performance of engineering team and improve results. It involves data such as schedule, surveys, efficiency utilization and hours scheduled. Showcasing this set of slides titled Engineering Performance Team Operations And Metrics Assessment Demonstration PDF. The topics addressed in these templates are Engineering Performance Team Operations, Metrics Assessment. All the content presented in this PPT design is completely editable. Download it and make adjustments in color, background, font etc. as per your unique business setting.
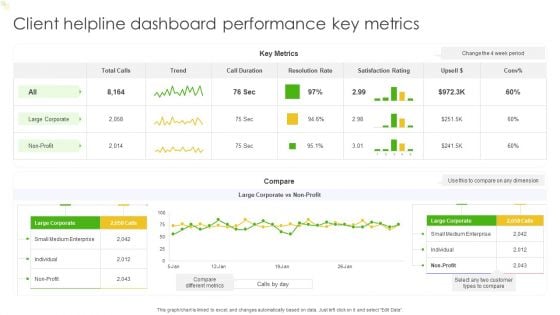
Client Helpline Dashboard Performance Key Metrics Ppt Outline Deck PDF
This graph or chart is linked to excel, and changes automatically based on data. Just left click on it and select Edit Data. Pitch your topic with ease and precision using this Client Helpline Dashboard Performance Key Metrics Ppt Outline Deck PDF. This layout presents information on Key Metrics, Trend, Compare. It is also available for immediate download and adjustment. So, changes can be made in the color, design, graphics or any other component to create a unique layout.
Measuring Website Metrics Ppt PowerPoint Presentation Outline Background Cpb
Presenting this set of slides with name measuring website metrics ppt powerpoint presentation outline backgroun. This is an editable Powerpoint four stages graphic that deals with topics like measuring website metrics to help convey your message better graphically. This product is a premium product available for immediate download and is 100 percent editable in Powerpoint. Download this now and use it in your presentations to impress your audience.
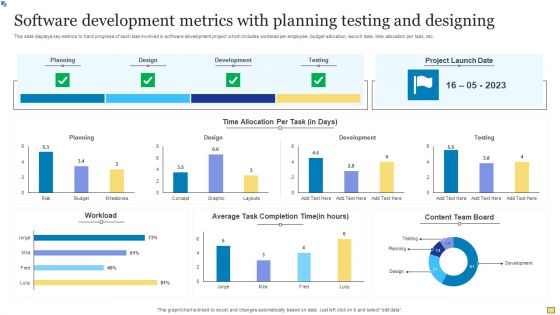
Software Development Metrics With Planning Testing And Designing Introduction PDF
This slide displays key metrics to track progress of each task involved in software development project which includes workload per employee, budget allocation, launch date, time allocation per task, etc. Showcasing this set of slides titled Software Development Metrics With Planning Testing And Designing Introduction PDF. The topics addressed in these templates are Planning, Workload, Development. All the content presented in this PPT design is completely editable. Download it and make adjustments in color, background, font etc. as per your unique business setting.
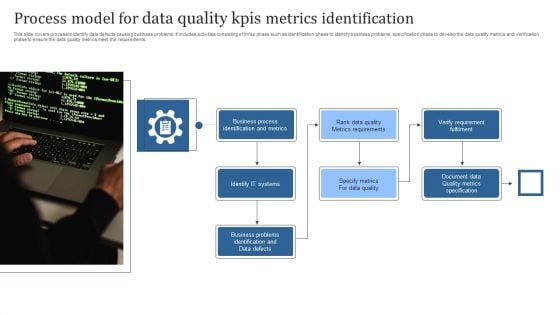
Process Model For Data Quality Kpis Metrics Identification Brochure PDF
This slide covers process to identify data defects causing business problems. It includes activities consisting of three phase such as identification phase to identify business problems, specification phase to develop the data quality metrics and verification phase to ensure the data quality metrics meet the requirements. Persuade your audience using this Process Model For Data Quality Kpis Metrics Identification Brochure PDF. This PPT design covers Seven stages, thus making it a great tool to use. It also caters to a variety of topics including Business Process, Identification And Metrics, Verify Requirement Fulfilment. Download this PPT design now to present a convincing pitch that not only emphasizes the topic but also showcases your presentation skills.
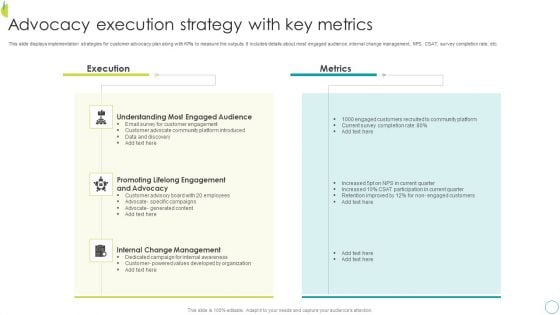
Advocacy Execution Strategy With Key Metrics Diagrams PDF
This slide displays implementation strategies for customer advocacy plan along with KPIs to measure the outputs. It includes details about most engaged audience, internal change management, NPS, CSAT, survey completion rate, etc. Showcasing this set of slides titled Advocacy Execution Strategy With Key Metrics Diagrams PDF The topics addressed in these templates are Execution, Metrics, Audience. All the content presented in this PPT design is completely editable. Download it and make adjustments in color, background, font etc. as per your unique business setting.
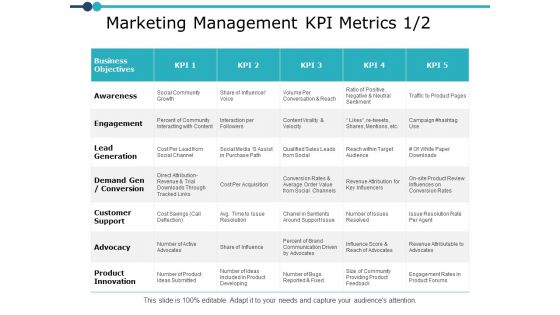
Marketing Management Kpi Metrics Planning Ppt PowerPoint Presentation Model Graphics
This is a marketing management kpi metrics planning ppt powerpoint presentation model graphics. The topics discussed in this diagram are marketing, business, management, planning, strategy This is a completely editable PowerPoint presentation, and is available for immediate download.
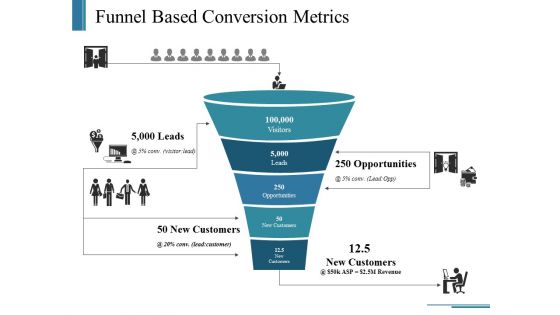
Funnel Based Conversion Metrics Ppt PowerPoint Presentation Outline Layouts
This is a funnel based conversion metrics ppt powerpoint presentation outline layouts. This is a five stage process. The stages in this process are visitors, leads, opportunities, new customers, business.
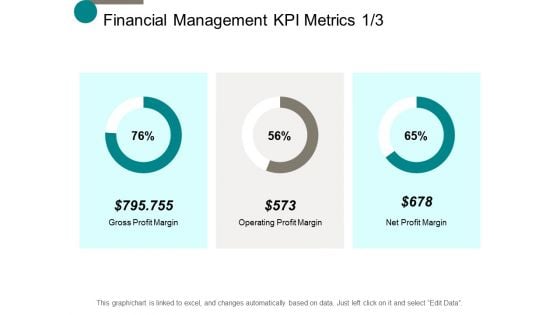
Financial Management Kpi Metrics Management Ppt Powerpoint Presentation Outline Themes
This is a financial management kpi metrics management ppt powerpoint presentation outline themes. This is a three stage process. The stages in this process are finance, marketing, management, investment, analysis.
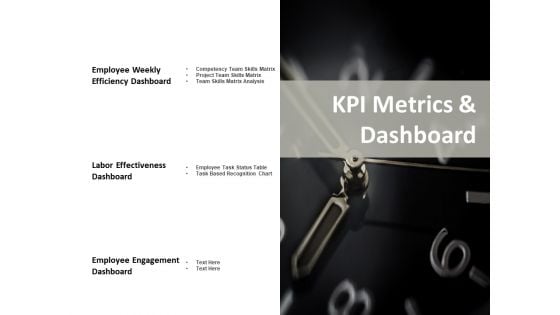
Kpi Metrics And Dashboard Ppt PowerPoint Presentation Show Skills
This is a kpi metrics and dashboard ppt powerpoint presentation show skills. This is a three stage process. The stages in this process are measure, business, management, planning, strategy.
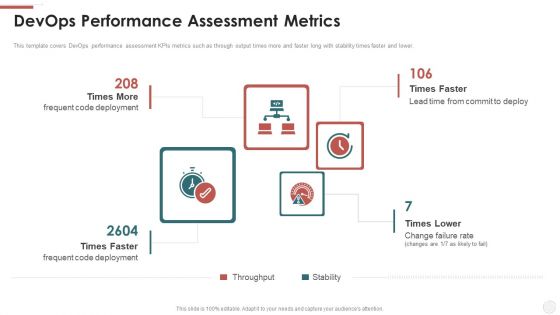
Devops Performance Assessment Metrics Ppt Summary Examples PDF
This template covers DevOps performance assessment KPIs metrics such as through output times more and faster long with stability times faster and lower. Deliver and pitch your topic in the best possible manner with this devops performance assessment metrics ppt summary examples pdf. Use them to share invaluable insights on deployment, rate and impress your audience. This template can be altered and modified as per your expectations. So, grab it now.
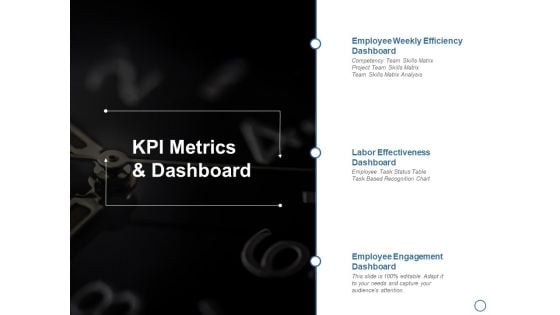
KPI Metrics And Dashboard Ppt PowerPoint Presentation Inspiration Format Ideas
This is a kpi metrics and dashboard ppt powerpoint presentation inspiration format ideas. This is a three stage process. The stages in this process are business, planning, strategy, marketing, management.
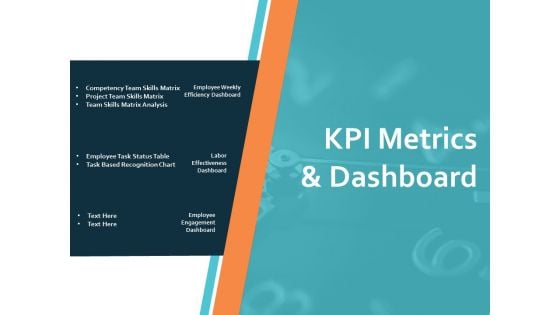
KPI Metrics And Dashboard Ppt PowerPoint Presentation Infographics Model
This is a kpi metrics and dashboard ppt powerpoint presentation infographics model. This is a three stage process. The stages in this process are business, planning, strategy, marketing, management.
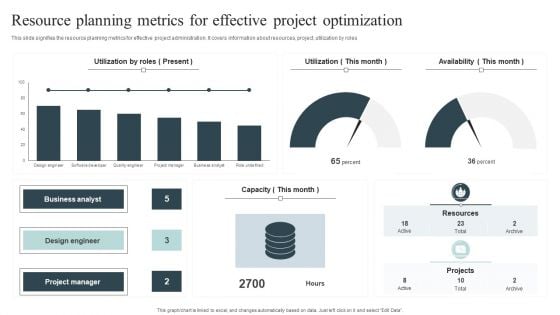
Resource Planning Metrics For Effective Project Optimization Brochure PDF
This slide signifies the resource planning metrics for effective project administration. It covers information about resources, project, utilization by roles.Pitch your topic with ease and precision using this Resource Planning Metrics For Effective Project Optimization Brochure PDF. This layout presents information on Business Analyst, Design Engineer, Project Manager. It is also available for immediate download and adjustment. So, changes can be made in the color, design, graphics or any other component to create a unique layout.
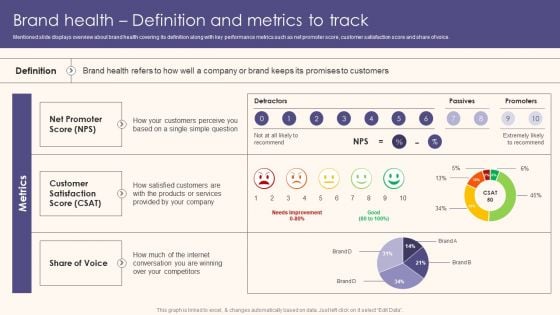
Brand Health Definition And Metrics To Track Background PDF
Mentioned slide displays overview about brand health covering its definition along with key performance metrics such as net promoter score, customer satisfaction score and share of voice.Presenting this PowerPoint presentation, titled Brand Health Definition And Metrics To Track Background PDF, with topics curated by our researchers after extensive research. This editable presentation is available for immediate download and provides attractive features when used. Download now and captivate your audience. Presenting this Brand Health Definition And Metrics To Track Background PDF. Our researchers have carefully researched and created these slides with all aspects taken into consideration. This is a completely customizable Brand Health Definition And Metrics To Track Background PDF that is available for immediate downloading. Download now and make an impact on your audience. Highlight the attractive features available with our PPTs.
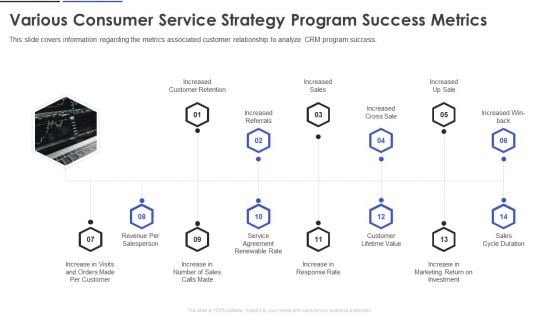
Various Consumer Service Strategy Program Success Metrics Designs PDF
This slide covers information regarding the metrics associated customer relationship to analyze CRM program success. Presenting Various Consumer Service Strategy Program Success Metrics Designs PDF to provide visual cues and insights. Share and navigate important information on forteen stages that need your due attention. This template can be used to pitch topics like Increased Sales Increased, Customer Retention, Customer Lifetime Value. In addtion, this PPT design contains high resolution images, graphics, etc, that are easily editable and available for immediate download.
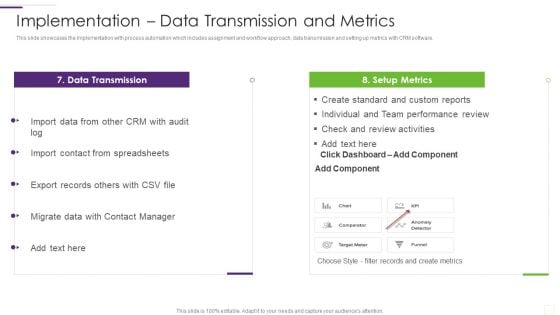
CRM Implementation Strategy Implementation Data Transmission And Metrics Slides PDF
This slide showcases the Implementation with process automation which includes assignment and workflow approach, data transmission and setting up metrics with CRM software.Deliver and pitch your topic in the best possible manner with this CRM Implementation Strategy Implementation Data Transmission And Metrics Slides PDF Use them to share invaluable insights on Data Transmission, Performance Review, Review Activities and impress your audience. This template can be altered and modified as per your expectations. So, grab it now.
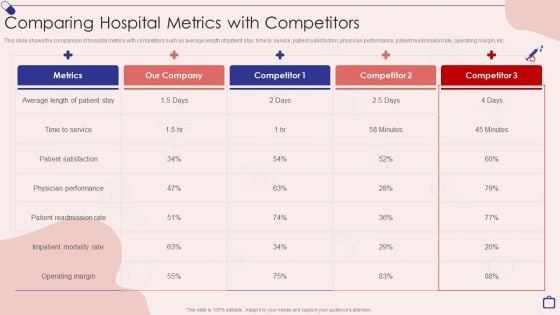
Implementing Integrated Software Comparing Hospital Metrics With Competitors Professional PDF
This slide shows the comparison of hospital metrics with competitors such as average length of patient stay, time to service, patient satisfaction, physician performance, patient readmission rate, operating margin, etc.Deliver and pitch your topic in the best possible manner with this Implementing Integrated Software Comparing Hospital Metrics With Competitors Professional PDF. Use them to share invaluable insights on Physician Performance, Patient Satisfaction, Patient Readmission and impress your audience. This template can be altered and modified as per your expectations. So, grab it now.
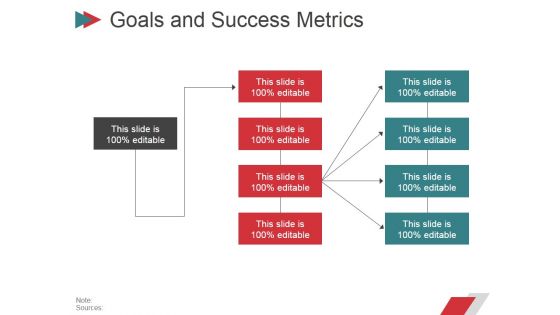
Goals And Success Metrics Ppt PowerPoint Presentation Ideas Guide
This is a goals and success metrics ppt powerpoint presentation ideas guide. This is a eight stage process. The stages in this process are business, strategy, marketing, planning, arrow.
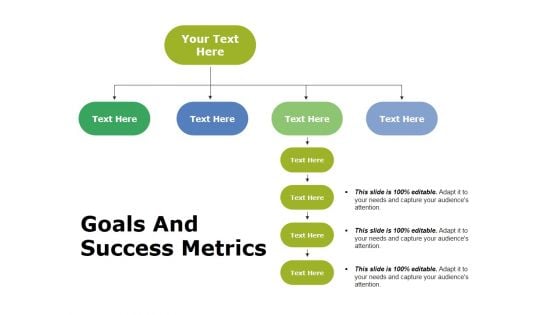
Goals And Success Metrics Ppt PowerPoint Presentation Layouts Design Templates
This is a goals and success metrics ppt powerpoint presentation layouts design templates. This is a four stage process. The stages in this process are goals, marketing, success, planning, strategy.

Cyber Security KPI Dashboard With Metrics Microsoft PDF
This slide showcases dashboard of security support cell based on complaints recorded from ABC company. It includes complaints, non complaints, open and close tickets and security incident by quarter. Showcasing this set of slides titled Cyber Security KPI Dashboard With Metrics Microsoft PDF. The topics addressed in these templates are Cyber Security, Kpi Dashboard With Metrics. All the content presented in this PPT design is completely editable. Download it and make adjustments in color, background, font etc. as per your unique business setting.
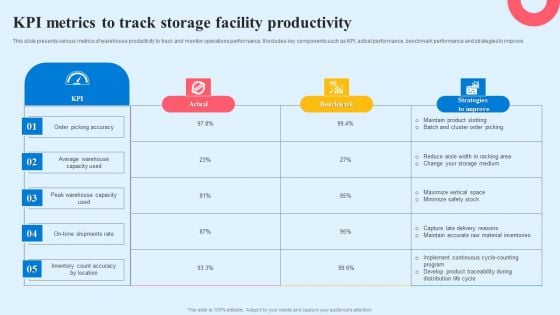
KPI Metrics To Track Storage Facility Productivity Designs PDF
This slide presents various metrics of warehouse productivity to track and monitor operations performance. It includes key components such as KPI, actual performance, benchmark performance and strategies to improve. Showcasing this set of slides titled KPI Metrics To Track Storage Facility Productivity Designs PDF. The topics addressed in these templates are Actual, Benchmark, Strategies To Improve. All the content presented in this PPT design is completely editable. Download it and make adjustments in color, background, font etc. as per your unique business setting.
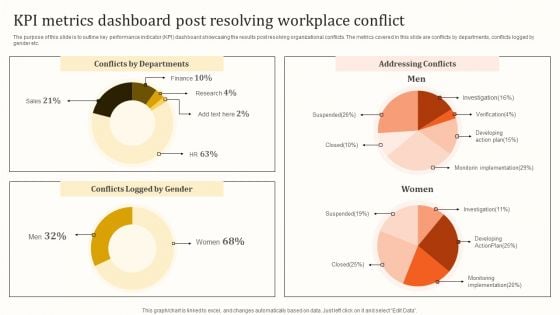
KPI Metrics Dashboard Post Resolving Workplace Conflict Template PDF
The purpose of this slide is to outline key performance indicator KPI dashboard showcasing the results post resolving organizational conflicts. The metrics covered in this slide are conflicts by departments, conflicts logged by gender etc. Presenting this PowerPoint presentation, titled KPI Metrics Dashboard Post Resolving Workplace Conflict Template PDF, with topics curated by our researchers after extensive research. This editable presentation is available for immediate download and provides attractive features when used. Download now and captivate your audience. Presenting this KPI Metrics Dashboard Post Resolving Workplace Conflict Template PDF. Our researchers have carefully researched and created these slides with all aspects taken into consideration. This is a completely customizable KPI Metrics Dashboard Post Resolving Workplace Conflict Template PDF that is available for immediate downloading. Download now and make an impact on your audience. Highlight the attractive features available with our PPTs.
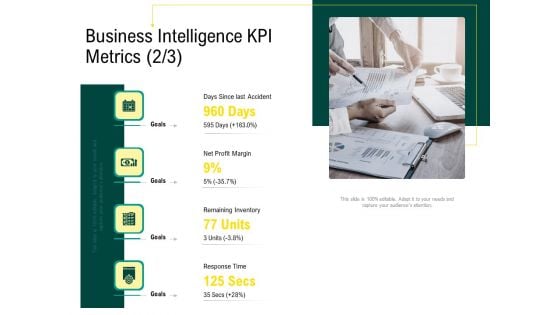
Expert Systems Business Intelligence KPI Metrics Goals Mockup PDF
This is a expert systems business intelligence kpi metrics goals mockup pdf template with various stages. Focus and dispense information on four stages using this creative set, that comes with editable features. It contains large content boxes to add your information on topics like business intelligence, kpi metrics. You can also showcase facts, figures, and other relevant content using this PPT layout. Grab it now.
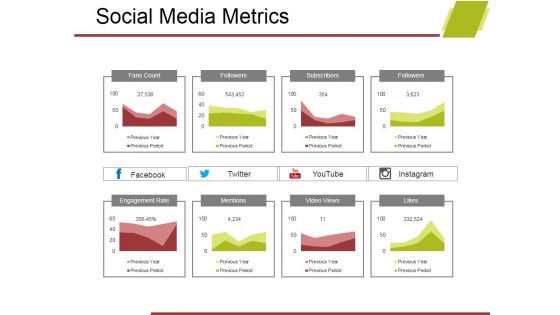
Social Media Metrics Ppt PowerPoint Presentation Styles Topics
This is a social media metrics ppt powerpoint presentation styles topics. This is a eight stage process. The stages in this process are fans count, followers, subscribers, engagement rate, mentions, video views, likes.
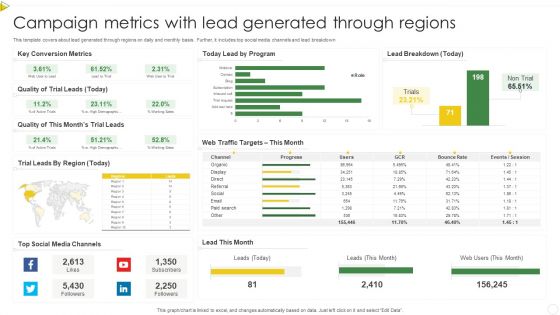
Campaign Metrics With Lead Generated Through Regions Clipart PDF
This template covers about lead generated through regions on daily and monthly basis . Further, it includes top social media channels and lead breakdown. Showcasing this set of slides titled Campaign Metrics With Lead Generated Through Regions Clipart PDF. The topics addressed in these templates are Key Conversion Metrics, Quality, Social Media. All the content presented in this PPT design is completely editable. Download it and make adjustments in color, background, font etc. as per your unique business setting.
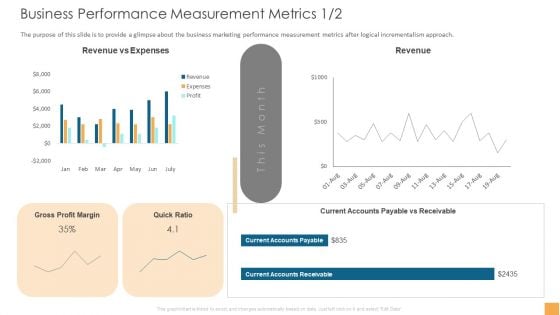
Analytical Incrementalism Business Performance Measurement Metrics Sales Infographics PDF
The purpose of this slide is to provide a glimpse about the business marketing performance measurement metrics after logical incrementalism approach. Deliver an awe-inspiring pitch with this creative analytical incrementalism business performance measurement metrics sales infographics pdf bundle. Topics like gross profit margin, revenue, quick ratio can be discussed with this completely editable template. It is available for immediate download depending on the needs and requirements of the user.
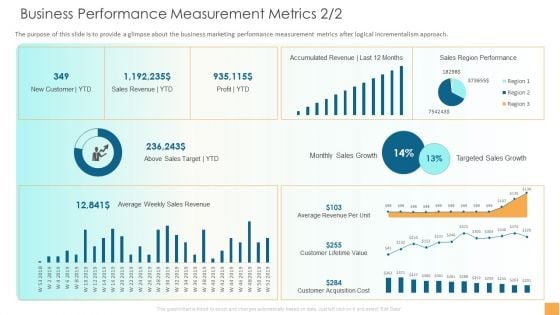
Analytical Incrementalism Business Performance Measurement Metrics Download PDF
The purpose of this slide is to provide a glimpse about the business marketing performance measurement metrics after logical incrementalism approach. Deliver an awe-inspiring pitch with this creative analytical incrementalism business performance measurement metrics download pdf bundle. Topics like sales revenue, new customer, sales growth, sales region performance, profit can be discussed with this completely editable template. It is available for immediate download depending on the needs and requirements of the user.
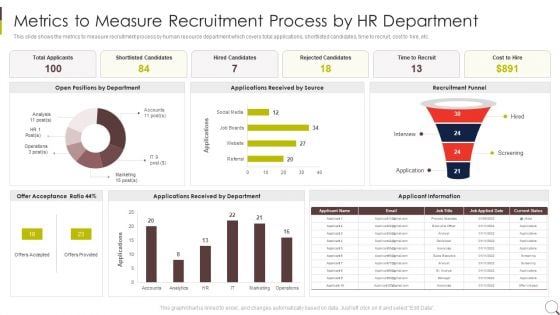
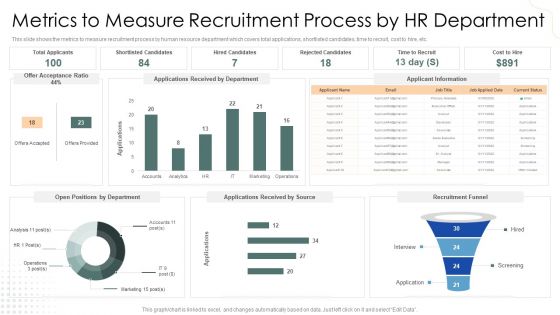
Metrics To Measure Recruitment Process By HR Department Graphics PDF
This slide shows the metrics to measure recruitment process by human resource department which covers total applications, shortlisted candidates, time to recruit, cost to hire, etc.Deliver an awe inspiring pitch with this creative Metrics To Measure Recruitment Process By HR Department Graphics PDF bundle. Topics like Applications Received, Applicant Information, Rejected Candidates can be discussed with this completely editable template. It is available for immediate download depending on the needs and requirements of the user.
Metrics To Measure Recruitment Process By HR Department Guidelines PDF
This slide shows the metrics to measure recruitment process by human resource department which covers total applications, shortlisted candidates, time to recruit, cost to hire, etc.Deliver and pitch your topic in the best possible manner with this Metrics To Measure Recruitment Process By HR Department Guidelines PDF. Use them to share invaluable insights on Applications Received, Positions Department, Applications Received and impress your audience. This template can be altered and modified as per your expectations. So, grab it now.

Internal Audit Metrics Flowchart Ppt Infographic Template Example Introduction PDF
This slide depicts the flowchart for the internal audit KPI metrics. It includes the information related to steps involved in the audit process and planning. Presenting Internal Audit Metrics Flowchart Ppt Infographic Template Example Introduction PDF to dispense important information. This template comprises one stages. It also presents valuable insights into the topics including Audit Members, Risk Assessment, Audit Scheduling. This is a completely customizable PowerPoint theme that can be put to use immediately. So, download it and address the topic impactfully.
Search Engine Optimization Metrics Sample Diagram Ppt Slides
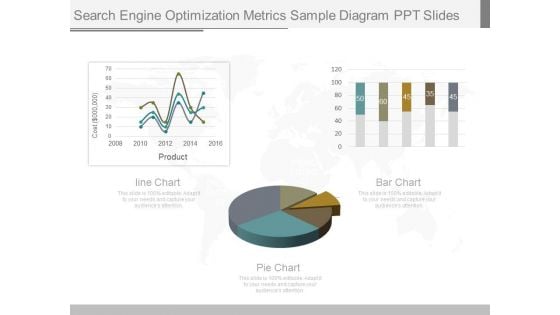
This is a search engine optimization metrics sample diagram ppt slides. This is a three stage process. The stages in this process are cost, product, line chart, bar chart, pie chart.
Dashboard Depicting Metrics Of Digital Marketing Campaign Topics PDF
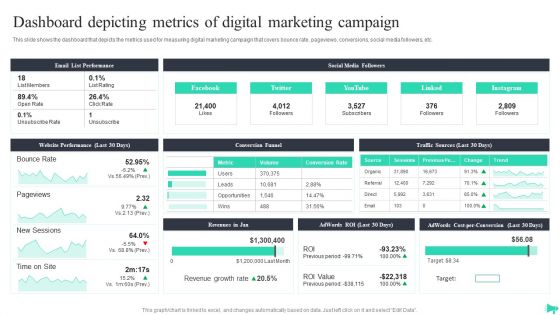
This slide shows the dashboard that depicts the metrics used for measuring digital marketing campaign that covers bounce rate, pageviews, conversions, social media followers, etc. Presenting this PowerPoint presentation, titled Dashboard Depicting Metrics Of Digital Marketing Campaign Topics PDF, with topics curated by our researchers after extensive research. This editable presentation is available for immediate download and provides attractive features when used. Download now and captivate your audience. Presenting this Dashboard Depicting Metrics Of Digital Marketing Campaign Topics PDF. Our researchers have carefully researched and created these slides with all aspects taken into consideration. This is a completely customizable Dashboard Depicting Metrics Of Digital Marketing Campaign Topics PDF that is available for immediate downloading. Download now and make an impact on your audience. Highlight the attractive features available with our PPTs.
Dashboard Depicting Metrics Of Digital Marketing Campaign Guidelines PDF
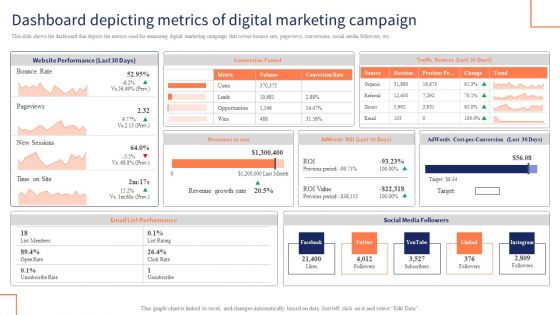
This slide shows the dashboard that depicts the metrics used for measuring digital marketing campaign that covers bounce rate, pageviews, conversions, social media followers, etc. Presenting this PowerPoint presentation, titled Dashboard Depicting Metrics Of Digital Marketing Campaign Guidelines PDF, with topics curated by our researchers after extensive research. This editable presentation is available for immediate download and provides attractive features when used. Download now and captivate your audience. Presenting this Dashboard Depicting Metrics Of Digital Marketing Campaign Guidelines PDF. Our researchers have carefully researched and created these slides with all aspects taken into consideration. This is a completely customizable Dashboard Depicting Metrics Of Digital Marketing Campaign Guidelines PDF that is available for immediate downloading. Download now and make an impact on your audience. Highlight the attractive features available with our PPTs.
Primary And Secondary Shipping Tracking Metrics Profile Rules PDF
This slide covers the KPI profile for defining measures to evaluate KPI performance. It also includes the details for enlisted KPIs such as ID, name, value, unit and rating. Showcasing this set of slides titled Primary And Secondary Shipping Tracking Metrics Profile Rules PDF. The topics addressed in these templates are Secondary, Primary, Metrics Profile. All the content presented in this PPT design is completely editable. Download it and make adjustments in color, background, font etc. as per your unique business setting.
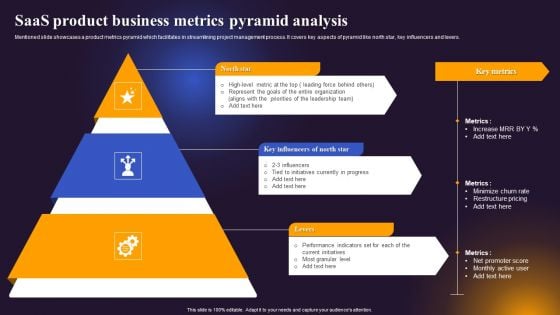
Saas Product Business Metrics Pyramid Analysis Portrait PDF
Mentioned slide showcases a product metrics pyramid which facilitates in streamlining project management process. It covers key aspects of pyramid like north star, key influencers and levers. Presenting Saas Product Business Metrics Pyramid Analysis Portrait PDF to dispense important information. This template comprises three stages. It also presents valuable insights into the topics including North Star, Key Influencers North Star, Levers. This is a completely customizable PowerPoint theme that can be put to use immediately. So, download it and address the topic impactfully.
Productivity Metrics Ppt PowerPoint Presentation Outline Template Cpb
Presenting this set of slides with name productivity metrics ppt powerpoint presentation outline template cpb. This is an editable Powerpoint five stages graphic that deals with topics like productivity metrics to help convey your message better graphically. This product is a premium product available for immediate download and is 100 percent editable in Powerpoint. Download this now and use it in your presentations to impress your audience.
Human Resource Metrics Ppt PowerPoint Presentation Ideas Outline Cpb
Presenting this set of slides with name human resource metrics ppt powerpoint presentation ideas outline cpb. This is an editable Powerpoint four stages graphic that deals with topics like human resource metrics to help convey your message better graphically. This product is a premium product available for immediate download and is 100 percent editable in Powerpoint. Download this now and use it in your presentations to impress your audience.
Retailer Internal Search Metrics Ppt PowerPoint Presentation Outline Demonstration Cpb
Presenting this set of slides with name retailer internal search metrics ppt powerpoint presentation outline demonstration cpb. This is an editable Powerpoint four stages graphic that deals with topics like retailer internal search metrics to help convey your message better graphically. This product is a premium product available for immediate download and is 100 percent editable in Powerpoint. Download this now and use it in your presentations to impress your audience.
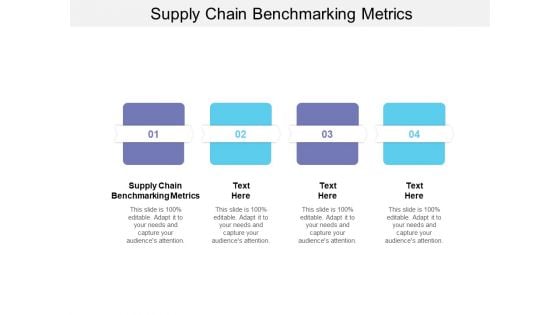
Supply Chain Benchmarking Metrics Ppt PowerPoint Presentation Outline Layout Cpb
Presenting this set of slides with name supply chain benchmarking metrics ppt powerpoint presentation outline layout cpb. This is an editable Powerpoint four stages graphic that deals with topics like supply chain benchmarking metrics to help convey your message better graphically. This product is a premium product available for immediate download and is 100 percent editable in Powerpoint. Download this now and use it in your presentations to impress your audience.
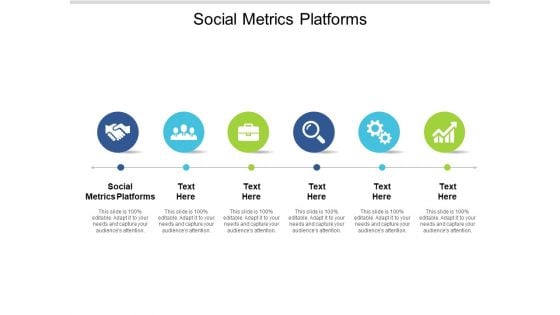
Social Metrics Platforms Ppt PowerPoint Presentation Outline Layouts Cpb
Presenting this set of slides with name social metrics platforms ppt powerpoint presentation outline layouts cpb. This is an editable Powerpoint six stages graphic that deals with topics like social metrics platforms to help convey your message better graphically. This product is a premium product available for immediate download and is 100 percent editable in Powerpoint. Download this now and use it in your presentations to impress your audience.
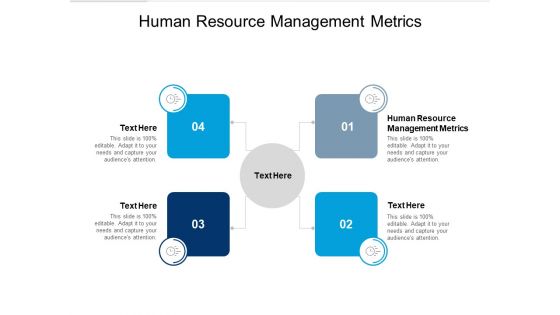
Human Resource Management Metrics Ppt PowerPoint Presentation Outline Example Cpb
Presenting this set of slides with name human resource management metrics ppt powerpoint presentation outline example cpb. This is an editable Powerpoint four stages graphic that deals with topics like human resource management metrics to help convey your message better graphically. This product is a premium product available for immediate download and is 100 percent editable in Powerpoint. Download this now and use it in your presentations to impress your audience.
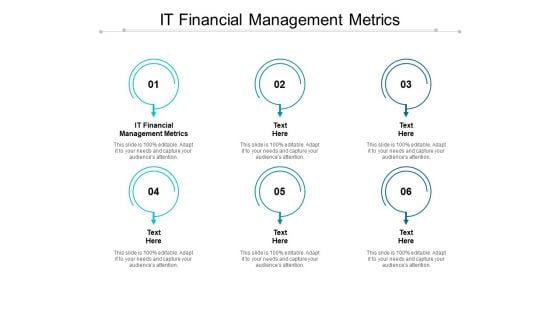
IT Financial Management Metrics Ppt PowerPoint Presentation Outline Vector Cpb
Presenting this set of slides with name it financial management metrics ppt powerpoint presentation outline vector cpb. This is an editable Powerpoint six stages graphic that deals with topics like it financial management metrics to help convey your message better graphically. This product is a premium product available for immediate download and is 100 percent editable in Powerpoint. Download this now and use it in your presentations to impress your audience.
Financial Forecast And Essential Metrics Icon Ppt Outline Display PDF
Persuade your audience using this Financial Forecast And Essential Metrics Icon Ppt Outline Display PDF. This PPT design covers three stages, thus making it a great tool to use. It also caters to a variety of topics including Financial Forecast, Essential Metrics, Icon. Download this PPT design now to present a convincing pitch that not only emphasizes the topic but also showcases your presentation skills.

Financial Projections And Key Metrics Ppt PowerPoint Presentation Styles Skills
This is a financial projections and key metrics ppt powerpoint presentation styles skills. This is a five stage process. The stages in this process are expenses, profits, sales, employees, years.
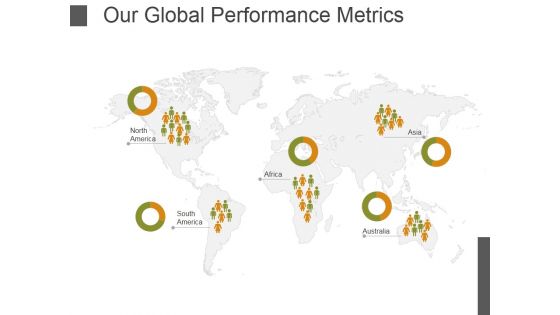
Our Global Performance Metrics Ppt PowerPoint Presentation Infographics Format
This is a our global performance metrics ppt powerpoint presentation infographics format. This is a five stage process. The stages in this process are north, south, africa, australia, america.
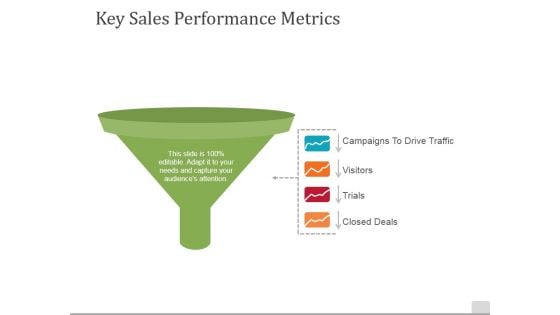
Key Sales Performance Metrics Ppt PowerPoint Presentation Slides Designs
This is a key sales performance metrics ppt powerpoint presentation slides designs. This is a four stage process. The stages in this process are campaigns to drive traffic, visitors, trials, closed deals.
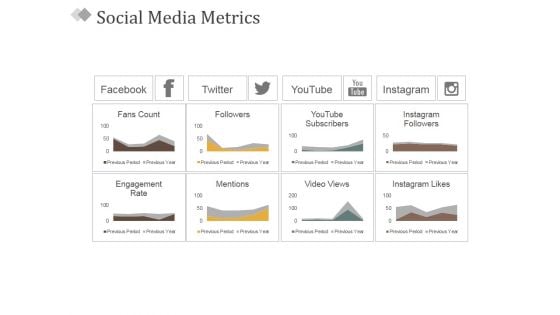
Social Media Metrics Ppt PowerPoint Presentation Infographic Template Graphics Example
This is a social media metrics ppt powerpoint presentation infographic template graphics example. This is a eight stage process. The stages in this process are facebook, twitter, youtube, fans count, instagram.
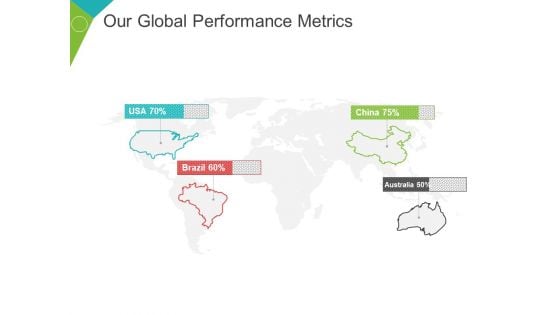
Our Global Performance Metrics Ppt PowerPoint Presentation Summary Grid
This is a our global performance metrics ppt powerpoint presentation summary grid. This is a four stage process. The stages in this process are usa, brazil, china, australia, percentage.
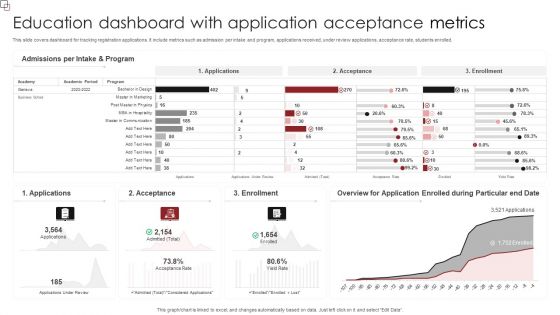
Education Dashboard With Application Acceptance Metrics Clipart PDF
This slide covers dashboard for tracking registration applications. It include metrics such as admission per intake and program, applications received, under review applications, acceptance rate, students enrolled. Showcasing this set of slides titled Education Dashboard With Application Acceptance Metrics Clipart PDF. The topics addressed in these templates are Admissions Per, Intake And Program, Enrollment. All the content presented in this PPT design is completely editable. Download it and make adjustments in color, background, font etc. as per your unique business setting.
Training And Education Metrics Tracking Dashboard Guidelines PDF
This slide showcases dashboard for tracking training programs details. It include metrics such as training to invited percentage, unique trained, training man-days, total program names, etc. Pitch your topic with ease and precision using this Training And Education Metrics Tracking Dashboard Guidelines PDF. This layout presents information on Location Wise Training, Training Concerning Vertical, Tennessee. It is also available for immediate download and adjustment. So, changes can be made in the color, design, graphics or any other component to create a unique layout.
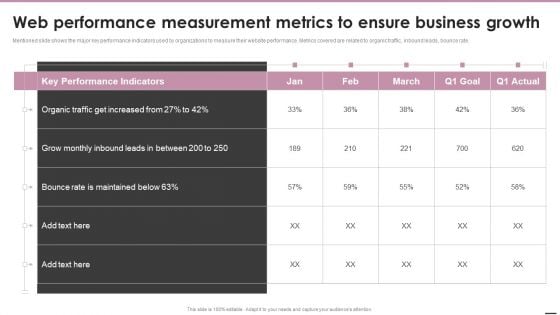
Web Performance Measurement Metrics To Ensure Business Growth Microsoft PDF
Mentioned slide shows the major key performance indicators used by organizations to measure their website performance. Metrics covered are related to organic traffic, inbound leads, bounce rate.Deliver an awe inspiring pitch with this creative Web Performance Measurement Metrics To Ensure Business Growth Microsoft PDF bundle. Topics like Performance Indicators, Organic Traffic, Rate Is Maintained can be discussed with this completely editable template. It is available for immediate download depending on the needs and requirements of the user.
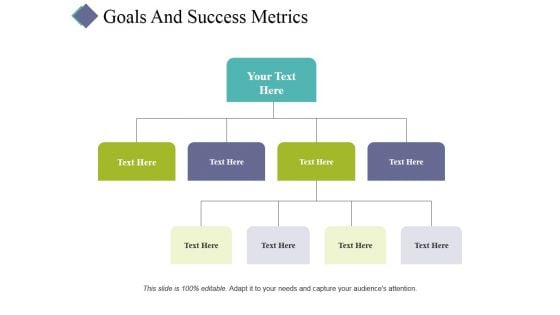
Goals And Success Metrics Ppt PowerPoint Presentation Pictures Shapes
This is a goals and success metrics ppt powerpoint presentation pictures shapes. This is a four stage process. The stages in this process are business, process, management, strategy, analysis.
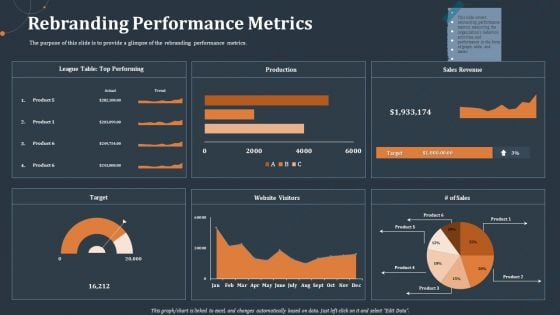
Rebranding Performance Metrics Ppt PowerPoint Presentation Infographics Layout PDF
The purpose of this slide is to provide a glimpse of the rebranding performance metrics.Deliver an awe inspiring pitch with this creative rebranding performance metrics ppt powerpoint presentation infographics layout pdf bundle. Topics like league table top performing, production, sales revenue, website visitors, target can be discussed with this completely editable template. It is available for immediate download depending on the needs and requirements of the user.
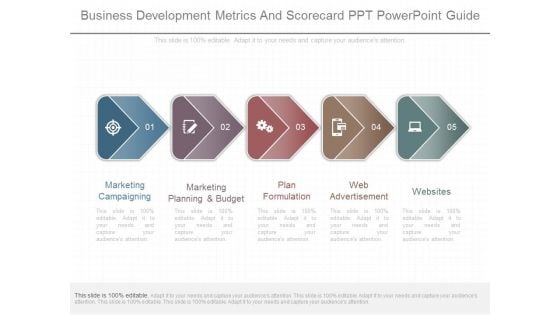
Business Development Metrics And Scorecard Ppt Powerpoint Guide
This is a business development metrics and scorecard ppt powerpoint guide. This is a five stage process. The stages in this process are marketing campaigning, marketing planning and budget, plan formulation, web advertisement, websites.
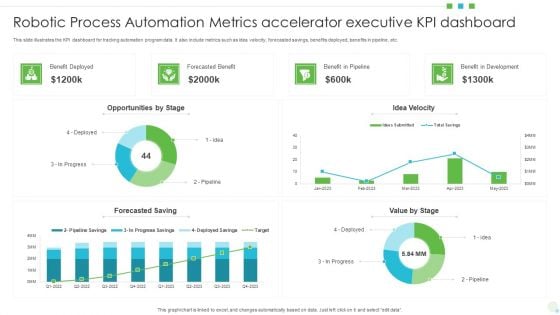
Robotic Process Automation Metrics Accelerator Executive KPI Dashboard Formats PDF
This slide illustrates the KPI dashboard for tracking automation program data. It also include metrics such as idea velocity, forecasted savings, benefits deployed, benefits in pipeline, etc. Showcasing this set of slides titled Robotic Process Automation Metrics Accelerator Executive KPI Dashboard Formats PDF. The topics addressed in these templates are Opportunities, Benefit In Development, Value. All the content presented in this PPT design is completely editable. Download it and make adjustments in color, background, font etc. as per your unique business setting.
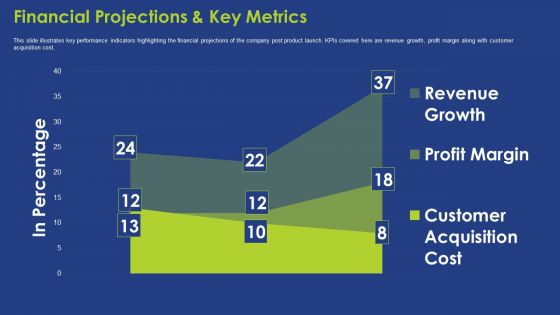
Financial Projections And Key Metrics Ppt Summary Background PDF
This slide illustrates key performance indicators highlighting the financial projections of the company post product launch. KPIs covered here are revenue growth, profit margin along with customer acquisition cost. Deliver an awe inspiring pitch with this creative financial projections and key metrics ppt summary background pdf bundle. Topics like financial projections and key metrics can be discussed with this completely editable template. It is available for immediate download depending on the needs and requirements of the user.
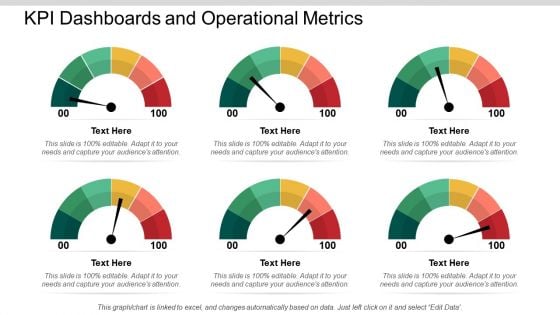
KPI Dashboards And Operational Metrics Ppt PowerPoint Presentation Portfolio Infographics
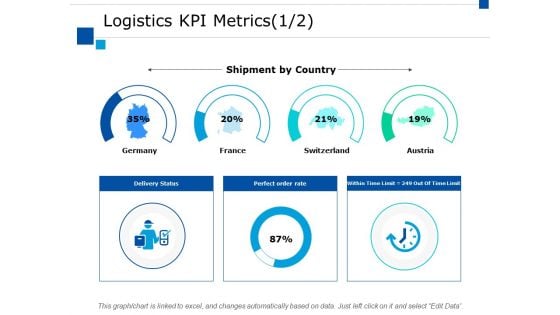
Logistics Kpi Metrics Business Ppt PowerPoint Presentation Ideas Infographics
This is a logistics kpi metrics business ppt powerpoint presentation ideas infographics. This is a four stage process. The stages in this process are finance, marketing, management, investment, analysis.
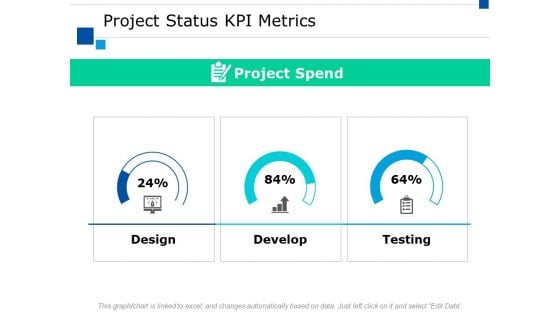
Project Status Kpi Metrics Slide Ppt PowerPoint Presentation Model Picture
This is a project status kpi metrics slide ppt powerpoint presentation model picture. This is a two stage process. The stages in this process are finance, marketing, management, investment, analysis.

 Home
Home