Percentage Growth
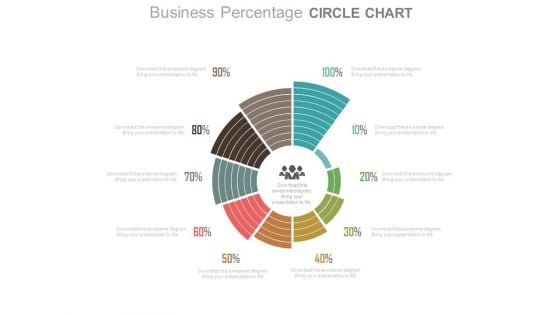
Business Percentage Ratio Circle Chart Powerpoint Slides
This PowerPoint template contains design of circle chart with team icon and percentage ratios. You may download this slide to display steps for strategic growth planning. You can easily customize this template to make it more unique as per your need.
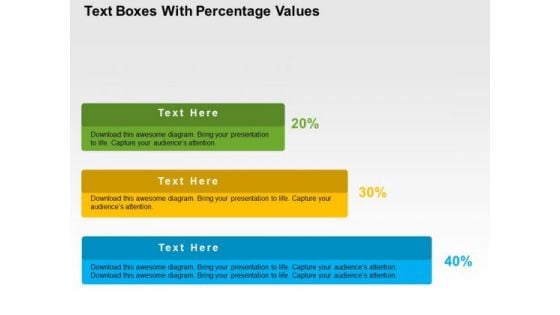
Text Boxes With Percentage Values PowerPoint Template
Growth analysis for business can be defined with this business diagram. This slide depicts text boxes in increasing flow. Present your views using this innovative slide and be assured of leaving a lasting impression
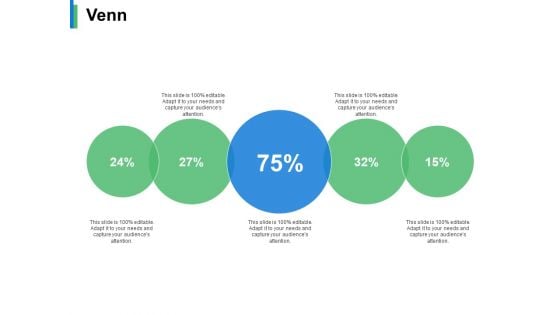
Venn Percentage Ppt PowerPoint Presentation Slides Vector
This is a venn percentage ppt powerpoint presentation slides vector. This is a five stage process. The stages in this process are business, management, strategy, analysis, percentage.
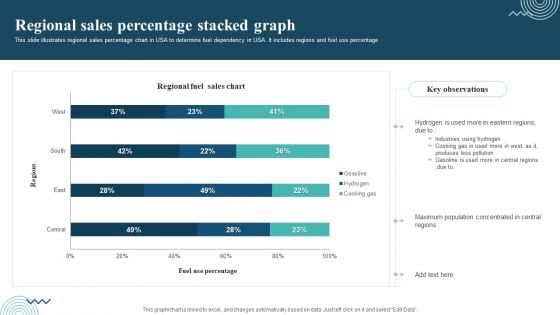
Regional Sales Percentage Stacked Graph Themes PDF
This slide illustrates regional sales percentage chart in USA to determine fuel dependency in USA. It includes regions and fuel use percentage. Pitch your topic with ease and precision using this Regional Sales Percentage Stacked Graph Themes PDF. This layout presents information on Regional Sales, Industries Using Hydrogen, Cooking Gas. It is also available for immediate download and adjustment. So, changes can be made in the color, design, graphics or any other component to create a unique layout.
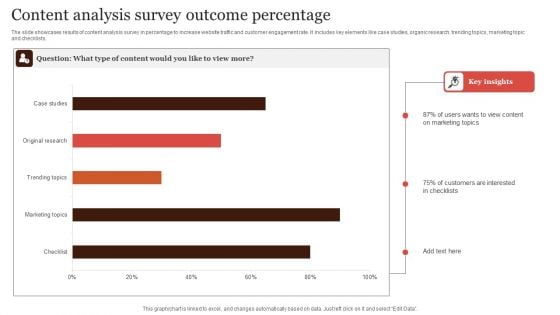
Content Analysis Survey Outcome Percentage Formats PDF
The slide showcases results of content analysis survey in percentage to increase website traffic and customer engagement rate. It includes key elements like case studies, organic research, trending topics, marketing topic and checklists. Showcasing this set of slides titled Content Analysis Survey Outcome Percentage Formats PDF. The topics addressed in these templates are Content Analysis, Survey Outcome Percentage. All the content presented in this PPT design is completely editable. Download it and make adjustments in color, background, font etc. as per your unique business setting.

Employee Photo With Percentage Bars Powerpoint Slides
This dashboard template contains employee photo with percentage bars. This dashboard PowerPoint template conveys employees performance in a visual manner. Download this PPT slide for quick decision-making.
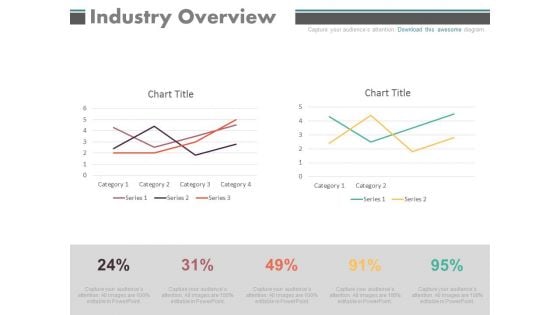
Industry Overview Percentage Chart Ppt Slides
This is a industry overview percentage chart ppt slides. This is a two stage process. The stages in this process are business, marketing.
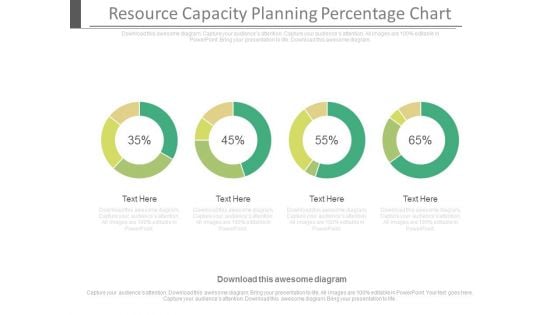
Resource Capacity Planning Percentage Chart Ppt Slides
This is a resource capacity planning percentage chart ppt slides. This is a four stage process. The stages in this process are business, finance, marketing.
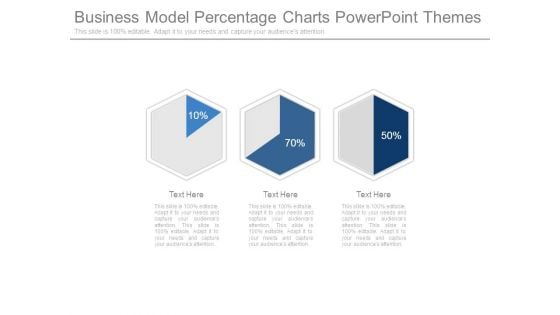
Business Model Percentage Charts Powerpoint Themes
This is a business model percentage charts powerpoint themes. This is a three stage process. The stages in this process are business, management, finance, strategy, marketing.
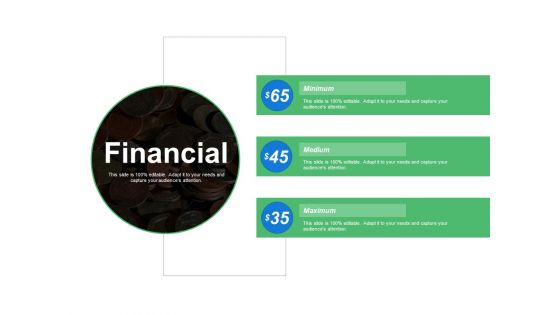
Financial Percentage Ppt PowerPoint Presentation Ideas Professional
This is a financial percentage ppt powerpoint presentation ideas professional. This is a three stage process. The stages in this process are business, management, financial, strategy, analysis.
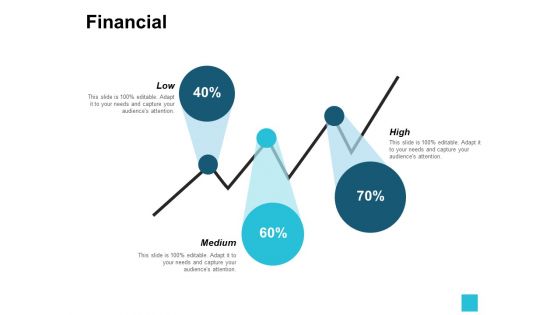
Financial Percentage Business Ppt PowerPoint Presentation Ideas
This is a financial percentage business ppt powerpoint presentation ideas. This is a three stage process. The stages in this process are financial, business, management, strategy, analysis.

65 Percentage Ppt PowerPoint Presentation Styles Designs
This is a 65 percentage ppt powerpoint presentation styles designs. This is a two stage process. The stages in this process are compare, business, analysis, strategy, marketing.
Financial Percentage Ppt PowerPoint Presentation Icon Templates
This is a financial percentage ppt powerpoint presentation icon templates. This is a three stage process. The stages in this process are business, marketing, management, financial.
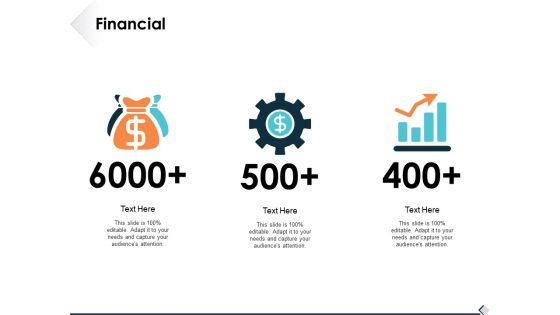
Financial Percentage Ppt PowerPoint Presentation File Gallery
This is a financial percentage ppt powerpoint presentation file gallery. This is a two stage process. The stages in this process are icons, finance, strategy, analysis, marketing.
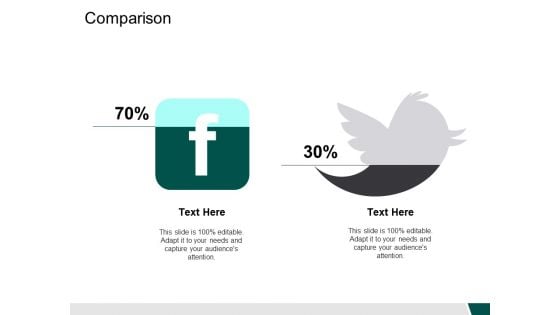
Comparison Percentage Ppt PowerPoint Presentation Outline Layout
This is a comparison percentage ppt powerpoint presentation outline layout. This is a two stage process. The stages in this process are comparison, management, strategy, analysis, marketing.
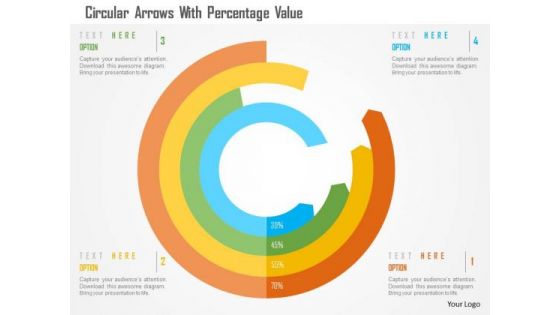
Business Diagram Circular Arrows With Percentage Value Presentation Template
This business slide has been designed with circular arrows. You may download this diagram to display percentage growth data. This template is innovatively designed to highlight your worthy views
Survey Outcome Percentage Report Icon Diagrams PDF
Presenting Survey Outcome Percentage Report Icon Diagrams PDF to dispense important information. This template comprises three stages. It also presents valuable insights into the topics including Survey Outcome, Percentage Report Icon. This is a completely customizable PowerPoint theme that can be put to use immediately. So, download it and address the topic impactfully.
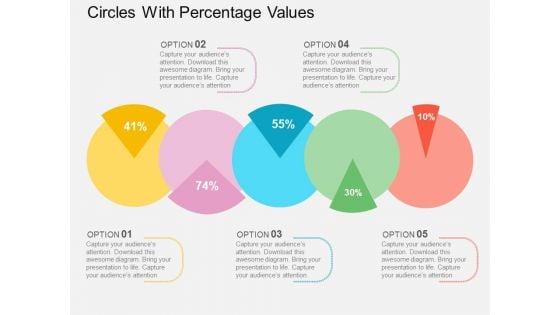
Circles With Percentage Values Powerpoint Templates
This PowerPoint template displays circles with percentage values. This business diagram is suitable for financial data analysis. Use this business diagram slide to highlight the key issues of your presentation.
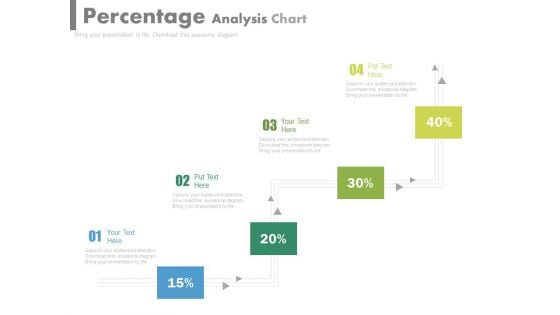
Pipeline Percentage Analysis Chart Powerpoint Slides
This PowerPoint template has been designed with pipeline percentage analysis chart. This PPT slide can be used to display business strategy plan. You can download finance PowerPoint template to prepare awesome presentations.
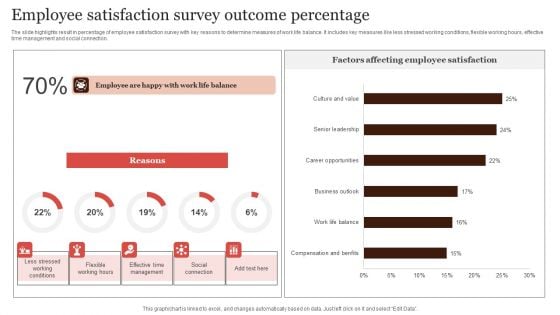
Employee Satisfaction Survey Outcome Percentage Graphics PDF
The slide highlights result in percentage of employee satisfaction survey with key reasons to determine measures of work life balance. It includes key measures like less stressed working conditions, flexible working hours, effective time management and social connection. Showcasing this set of slides titled Employee Satisfaction Survey Outcome Percentage Graphics PDF. The topics addressed in these templates are Factors Affecting, Employee Satisfaction, Survey Outcome Percentage. All the content presented in this PPT design is completely editable. Download it and make adjustments in color, background, font etc. as per your unique business setting.
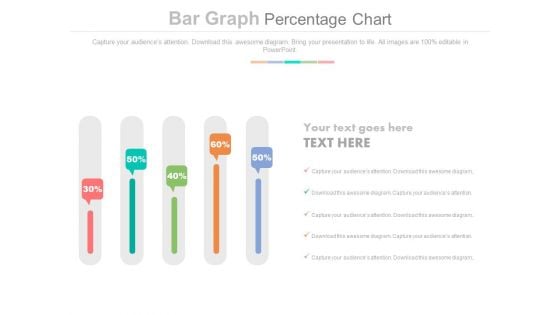
Sliders Percentage Data Chart Powerpoint Slides
This PowerPoint slide has been designed with slider chart and percentage data. This PPT diagram may be used to display business trends. This diagram slide can be used to make impressive presentations.
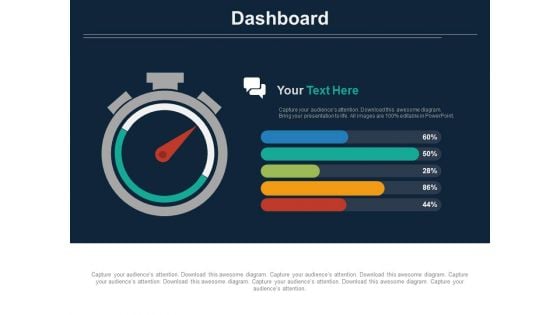
Stopwatch With Percentage Value Analysis Powerpoint Slides
The above template displays a diagram of stopwatch with percentage value. This diagram has been professionally designed to emphasize on time management. Grab center stage with this slide and capture the attention of your audience.
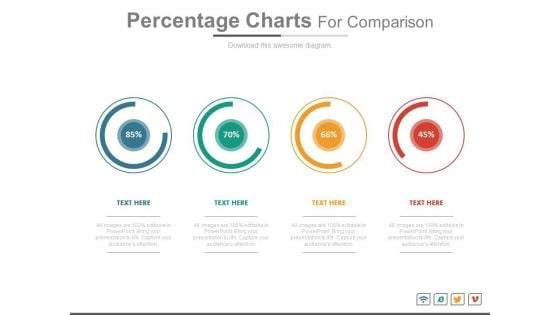
Percentage Charts For Statistical Comparison Powerpoint Slides
This PowerPoint template has been chart of percentage values. You may download this diagram for statistical comparison and analysis. Add this PPT slide to your presentation and impress your superiors.
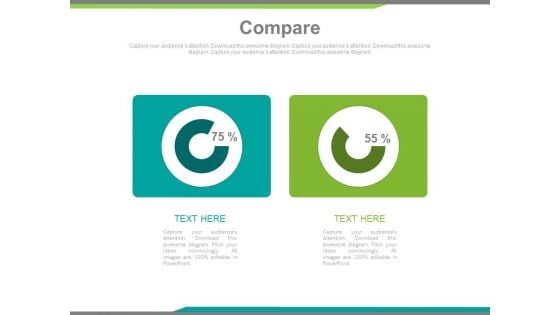
Two Percentage Values Comparison Charts Powerpoint Slides
This PowerPoint template has been designed with two percentage values You may download this PPT slide to use as comparison chart. Add this slide to your presentation and impress your superiors.
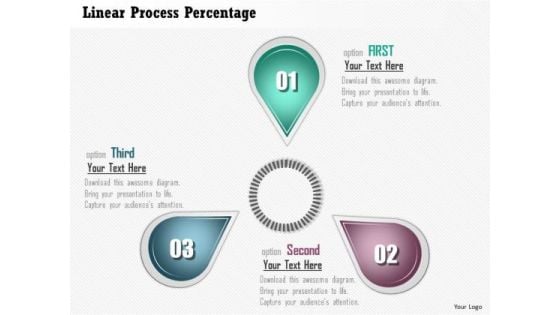
Business Diagram Linear Process Percentage Presentation Template
This slide contains linear process percentage diagram presentation template. This business diagram has been designed with graphic of three staged linear process diagram. This diagram has been crafted to display the concept of financial planning. Use this diagram for your finance and business related presentations.
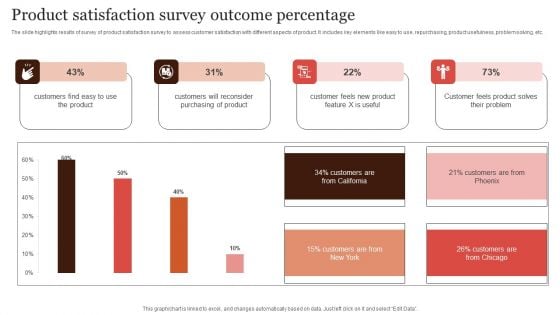
Product Satisfaction Survey Outcome Percentage Elements PDF
The slide highlights results of survey of product satisfaction survey to assess customer satisfaction with different aspects of product. It includes key elements like easy to use, repurchasing, product usefulness, problem solving, etc. Showcasing this set of slides titled Product Satisfaction Survey Outcome Percentage Elements PDF. The topics addressed in these templates are Customers Will Reconsider, Purchasing Of Product, Survey Outcome Percentage. All the content presented in this PPT design is completely editable. Download it and make adjustments in color, background, font etc. as per your unique business setting.
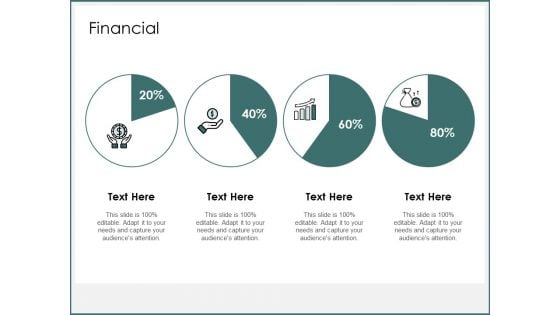
Financial Percentage Ppt PowerPoint Presentation Ideas Shapes
Presenting this set of slides with name financial percentage ppt powerpoint presentation ideas shapes. This is a four process. The stages in this process are finance, marketing, management, investment, analysis. This is a completely editable PowerPoint presentation and is available for immediate download. Download now and impress your audience.
Comparison Percentage Ppt PowerPoint Presentation Model Icon
Presenting this set of slides with name comparison percentage ppt powerpoint presentation model icon. This is a two stage process. The stages in this process are comparison, male, female, marketing, strategy. This is a completely editable PowerPoint presentation and is available for immediate download. Download now and impress your audience.
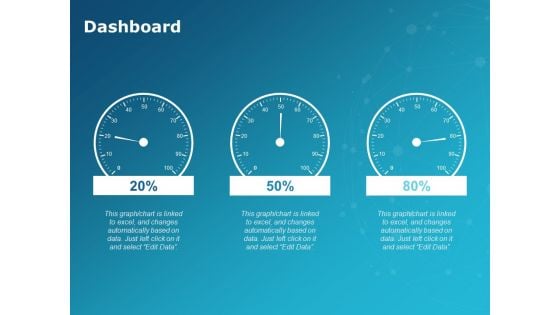
Dashboard Percentage Ppt PowerPoint Presentation Professional Rules
Presenting this set of slides with name dashboard percentage ppt powerpoint presentation professional rules. The topics discussed in these slides are finance, marketing, management, investment, analysis. This is a completely editable PowerPoint presentation and is available for immediate download. Download now and impress your audience.
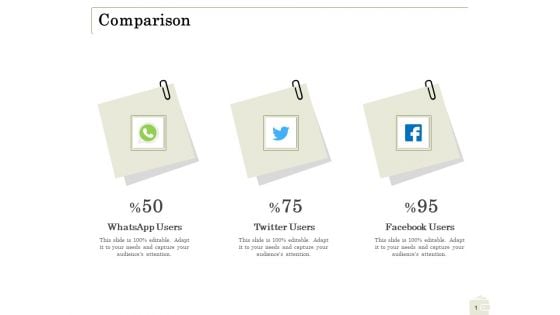
Percentage Share Customer Expenditure Comparison Background PDF
Presenting this set of slides with name percentage share customer expenditure comparison background pdf. This is a three stage process. The stages in this process are whatsapp users, twitter users, facebook users. This is a completely editable PowerPoint presentation and is available for immediate download. Download now and impress your audience.
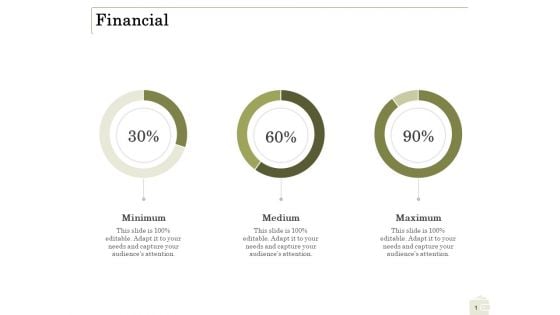
Percentage Share Customer Expenditure Financial Clipart PDF
Presenting this set of slides with name percentage share customer expenditure financial clipart pdf. This is a three stage process. The stages in this process are minimum, medium, maximum. This is a completely editable PowerPoint presentation and is available for immediate download. Download now and impress your audience.
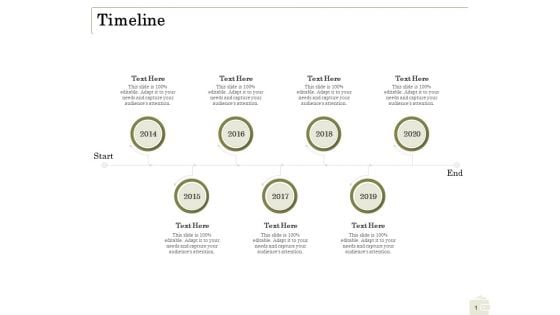
Percentage Share Customer Expenditure Timeline Topics PDF
Presenting this set of slides with name percentage share customer expenditure timeline topics pdf. This is a seven stage process. The stages in this process are timeline, 2014 to 2020. This is a completely editable PowerPoint presentation and is available for immediate download. Download now and impress your audience.
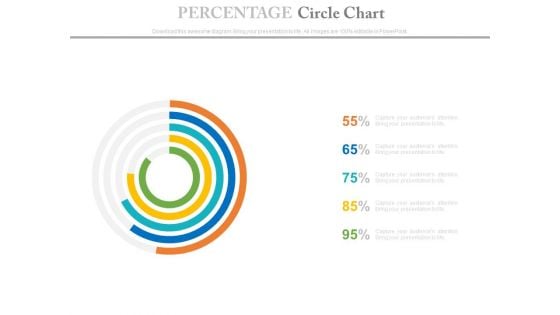
Percentage Data Circle Chart Powerpoint Slides
This PowerPoint template has been designed with circle chart. Download this PPT chart to depict financial ratio analysis. This PowerPoint slide is of great help in the business sector to make realistic presentations and provides effective way of presenting your newer thoughts.
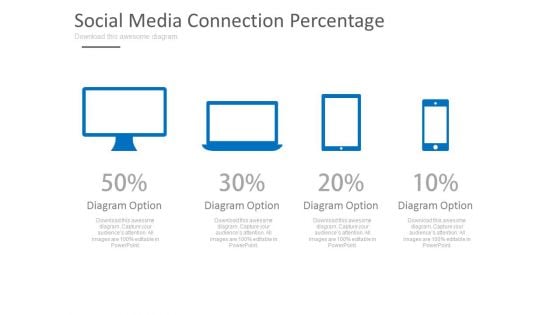
Computer Devices With Percentage Values Powerpoint Slides
This PPT slide displays graphics of computer, laptop, tablet and mobile. Use this PPT design to display comparison of computer devices. This PowerPoint template can be customized as per requirements of business education or any other theme.
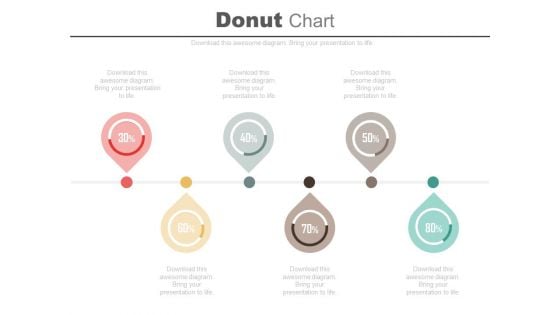
Six Pointers Percentage Timeline Diagram Powerpoint Slides
Profitability indicator ratios have been displayed this business slide. This PowerPoint template contains linear pointers timeline diagram. Use this professional diagram slide to build an exclusive presentation.
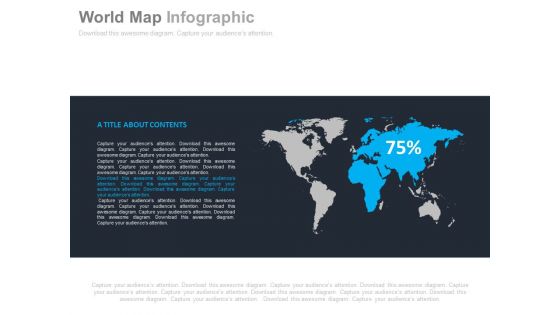
World Map With Percentage Value Powerpoint Slides
This professionally designed PowerPoint template displays diagram of world map. You can download this diagram to exhibit global business analysis. Above PPT slide is suitable for business presentation.
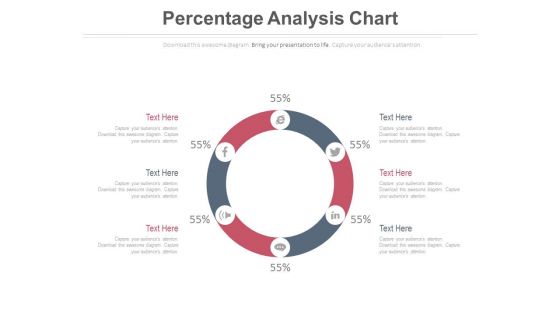
Circular Diagram For Percentage Analysis Powerpoint Slides
This PowerPoint slide has been designed with circular diagram with social media icons. This diagram slide may be used to display users of social media. Prove the viability of your ideas with this professional slide.
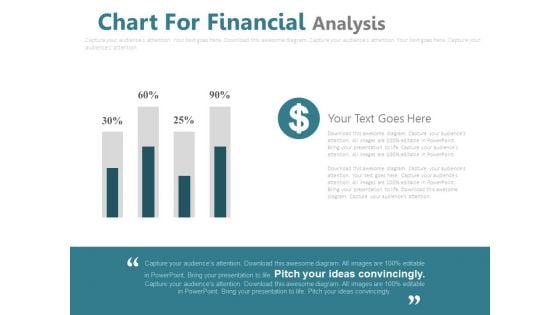
Chart For Financial Percentage Analysis Powerpoint Slides
This PowerPoint template has been designed with financial chart with dollar icon. This PPT slide may be used to display dollar value analysis chart. Download this slide to build unique presentation.
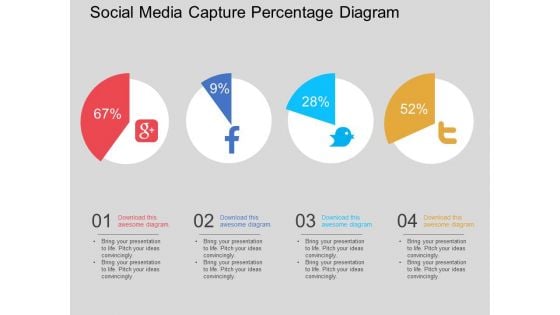
Social Media Capture Percentage Diagram Powerpoint Template
This PowerPoint template displays graphics of four circles with social media icons. This business diagram has been designed to exhibit ratios of social media users. Download this diagram slide to make impressive presentations.
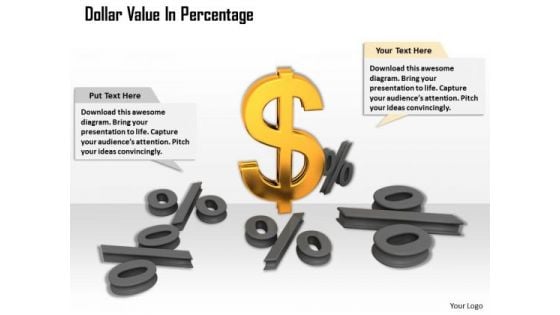
Business Management Strategy Dollar Value Percentage Clipart Images
Touch Base With Our business management strategy dollar value percentage clipart images Powerpoint Templates. Review Your Growth With Your Audience.

3D Men Icon With Percentage Values Powerpoint Templates
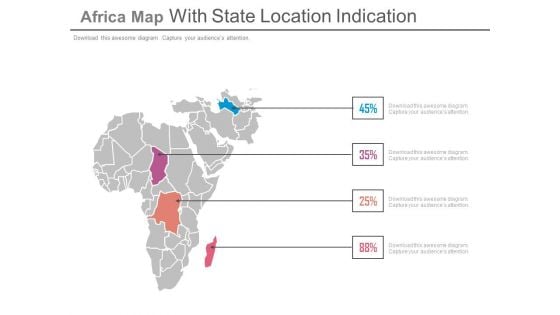
State Location On Africa Map With Percentage Data Powerpoint Slides
This PowerPoint template displays state location on Africa map with percentage data. This Map template can be used for annual growth report. This slide can also be used by school students for educational projects.
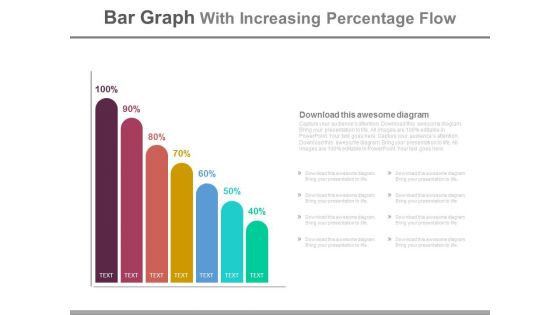
Bar Graph With Increasing Percentage Flow Powerpoint Slides
This PowerPoint slide has been designed with bar graph and increasing percentage values. This diagram slide may be used to display profit growth. Prove the viability of your ideas with this professional slide.
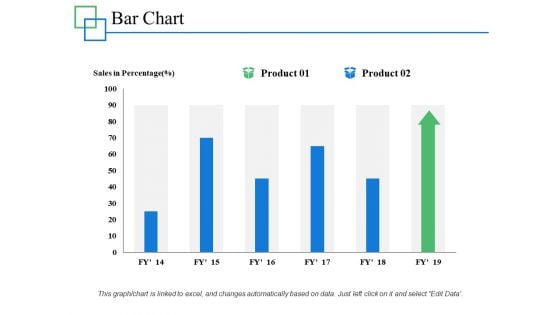
Bar Chart Percentage Product Ppt PowerPoint Presentation Layouts Designs Download
This is a bar chart percentage product ppt powerpoint presentation layouts designs download. This is a two stage process. The stages in this process are percentage, product, business, management.

Stacked Column Percentage Product Ppt PowerPoint Presentation Infographics Outfit
This is a stacked column percentage product ppt powerpoint presentation infographics outfit. This is a two stage process. The stages in this process are marketing, business, management, percentage, product.
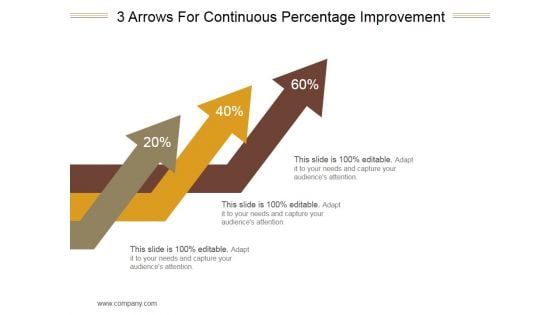
3 Arrows For Continuous Percentage Improvement Ppt PowerPoint Presentation Images
This is a 3 arrows for continuous percentage improvement ppt powerpoint presentation images. This is a three stage process. The stages in this process are arrows, marketing, strategy, management, business.
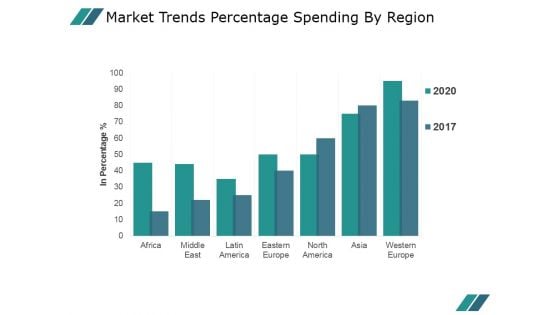
Market Trends Percentage Spending By Region Ppt PowerPoint Presentation Picture
This is a market trends percentage spending by region ppt powerpoint presentation picture. This is a seven stage process. The stages in this process are business, marketing, growth, planning, management.
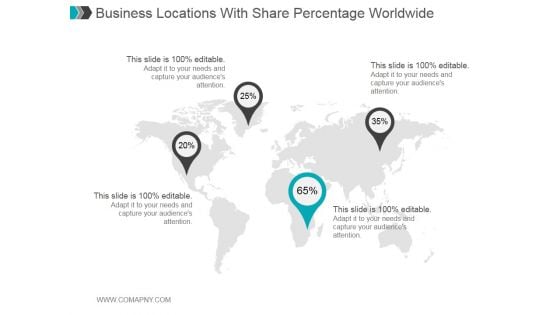
Business Locations With Share Percentage Worldwide Ppt PowerPoint Presentation Graphics
This is a business locations with share percentage worldwide ppt powerpoint presentation graphics. This is a four stage process. The stages in this process are business, location, geography, percentage, strategy, success.

Percentage Sales Marketing Ppt PowerPoint Presentation Model Example Cpb
Presenting this set of slides with name percentage sales marketing ppt powerpoint presentation model example cpb. This is a three stage process. The stages in this process are percentage sales marketing. This is a completely editable PowerPoint presentation and is available for immediate download. Download now and impress your audience.
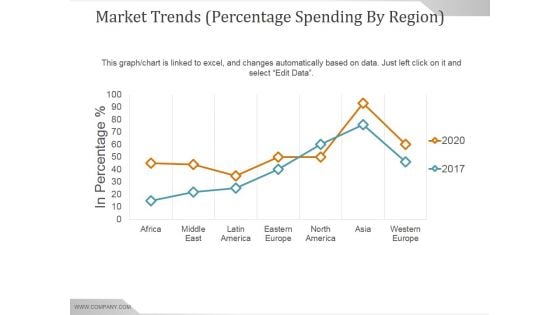
Market Trends Percentage Spending By Region Ppt PowerPoint Presentation Sample
This is a market trends percentage spending by region ppt powerpoint presentation sample. This is a seven stage process. The stages in this process are africa, middle east, latin america, eastern europe, north america, asia, western europe.
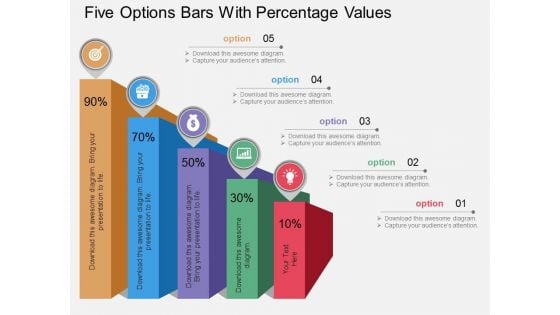
Five Options Bars With Percentage Values Powerpoint Template
Our professionally designed business diagram is as an effective tool for communicating ideas and planning. It contains five options bars with percentage values. Convey your views with this diagram slide. It will amplify the strength of your logic.
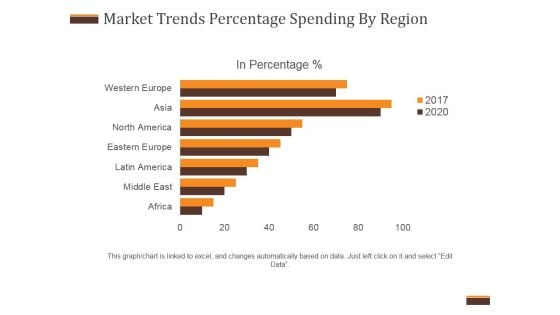
Market Trends Percentage Spending By Region Ppt PowerPoint Presentation Diagrams
This is a market trends percentage spending by region ppt powerpoint presentation diagrams. This is a seven stage process. The stages in this process are business, marketing, management, planning, finance.
Map Of Czech With Percentage Data And Icons Powerpoint Slides
This PowerPoint template displays map of Czech with percentage data and icons. This Map template can be used for annual growth report. This slide can also be used by school students for educational projects.
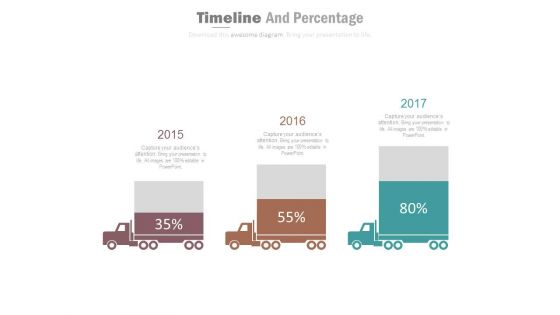
Three Trucks Timeline Diagram With Percentage Value Powerpoint Slides
This PowerPoint timeline template has been designed with three trucks with percentage values. This timeline template may be used to display three years growth planning. Download this PowerPoint timeline template to make impressive presentations.
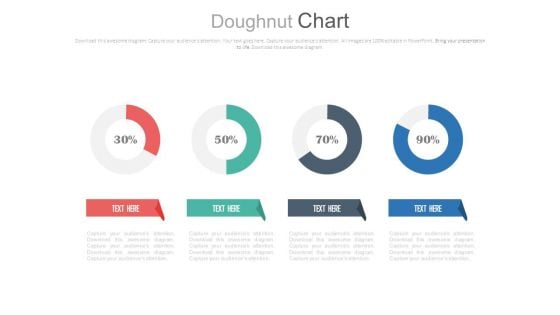
Four Circle Chart With Percentage Ratios Powerpoint Slides
This PowerPoint template has been designed with graphics of four circles and percentage ratios. You may use this dashboard slide design for topics like profit growth and financial planning. This PPT slide is powerful tool to describe your ideas.

Pie Chart With Increasing Percentage Values Powerpoint Slides
This PowerPoint template has been designed with diagram of pie chart with increasing percentage values. This PPT slide can be used to prepare presentations for profit growth report and also for financial data analysis. You can download finance PowerPoint template to prepare awesome presentations.
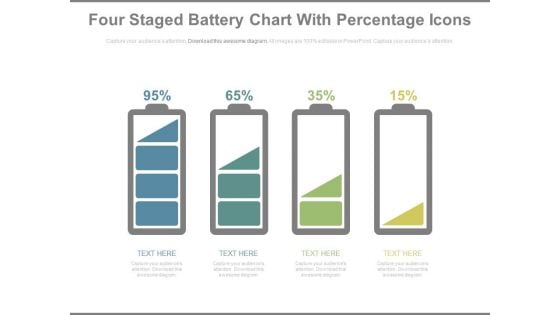
Battery Chart With Percentage Values For Comparison PowerPoint Slides
This year?s sales has matched up with your expectations. Now match this slide with your presentation to show the same. Show your company?s performance or business growth with this four staged battery chart PowerPoint template. With this slide, you can easily convince your colleagues how your company gave a tremendous growth over the years or months. Perfect illustration to show that the targets are achieved. This PPT template is easy to edit. You can choose the color of your choice. Your colleagues are already impressed with the sales growth. Now impress others and choose this PPT innovative designed template.
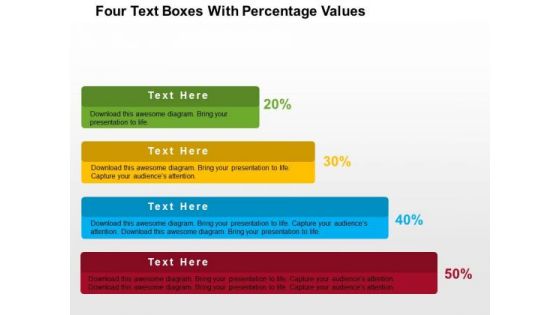
Four Text Boxes With Percentage Values PowerPoint Template
Growth analysis for business can be defined with this business diagram. This slide depicts text boxes in increasing flow. Present your views using this innovative slide and be assured of leaving a lasting impression
Four Circles With Percentage Values And Icons Powerpoint Slides
This PowerPoint template displays info graphic diagram of linear circles. This diagram may be used to exhibit financial growth and analysis. Grab center stage with this slide and capture the attention of your audience.
Healthy Body Fats Percentage In Powerpoint And Google Slides Cpb
Introducing our well designed Healthy Body Fats Percentage In Powerpoint And Google Slides Cpb This PowerPoint design presents information on topics like Healthy Body Fats Percentage As it is predesigned it helps boost your confidence level. It also makes you a better presenter because of its high quality content and graphics. This PPT layout can be downloaded and used in different formats like PDF, PNG, and JPG. Not only this, it is available in both Standard Screen and Widescreen aspect ratios for your convenience. Therefore, click on the download button now to persuade and impress your audience. Our Healthy Body Fats Percentage In Powerpoint And Google Slides Cpb are topically designed to provide an attractive backdrop to any subject. Use them to look like a presentation pro.

 Home
Home