Plot
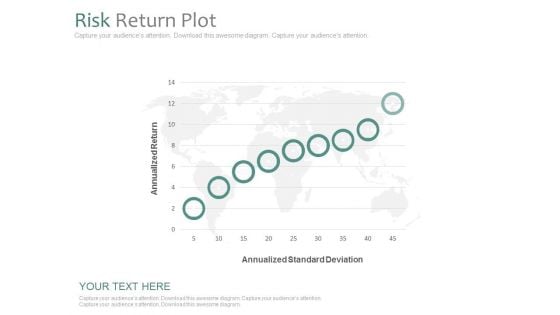
Risk Return Plot Ppt Slides
This is a risk return plot ppt slides. This is a nine stage process. The stages in this process are business, finance, marketing.
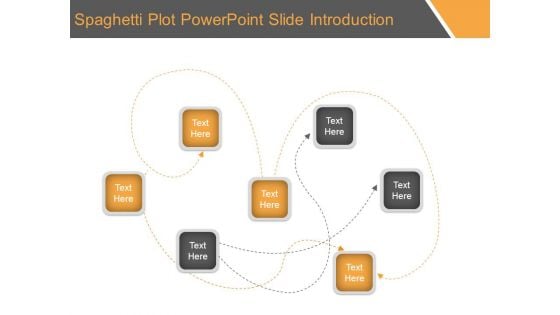
Spaghetti Plot Powerpoint Slide Introduction
This is a spaghetti plot powerpoint slide introduction. This is a seven stage process. The stages in this process are business, marketing, management, process, strategy.
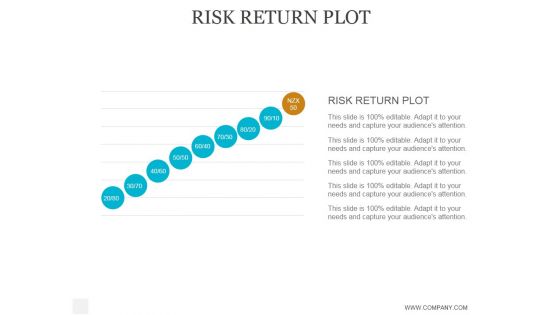
Risk Return Plot Ppt PowerPoint Presentation Pictures
This is a risk return plot ppt powerpoint presentation pictures. This is a nine stage process. The stages in this process are business, strategy, marketing, analysis, risk return plot.
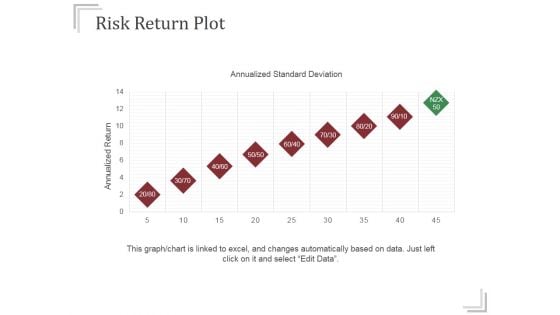
Risk Return Plot Ppt PowerPoint Presentation Themes
This is a risk return plot ppt powerpoint presentation themes. This is a nine stage process. The stages in this process are annualized return, annualized standard deviation.
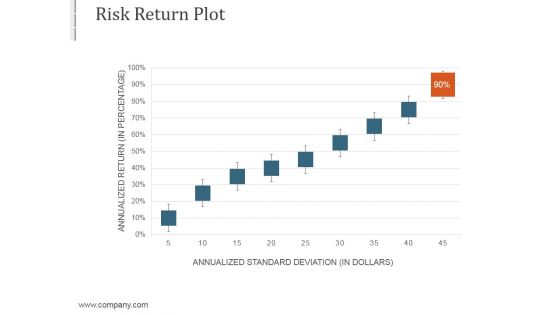
Risk Return Plot Ppt PowerPoint Presentation Backgrounds
This is a risk return plot ppt powerpoint presentation backgrounds. This is a one stage process. The stages in this process are business, process, marketing, strategy, success.
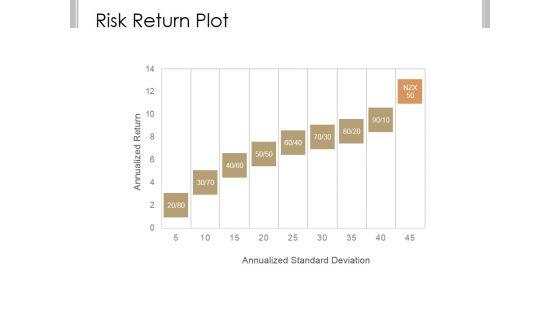
Risk Return Plot Ppt PowerPoint Presentation Styles
This is a risk return plot ppt powerpoint presentation styles. This is a nine stage process. The stages in this process are annualized return, annualized standard deviation.
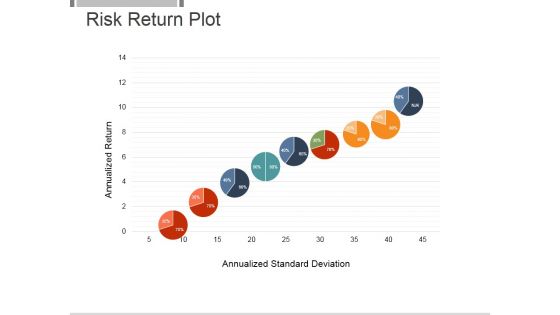
Risk Return Plot Ppt PowerPoint Presentation Rules
This is a risk return plot ppt powerpoint presentation rules. This is a nine stage process. The stages in this process are annualized return, annualized standard deviation.
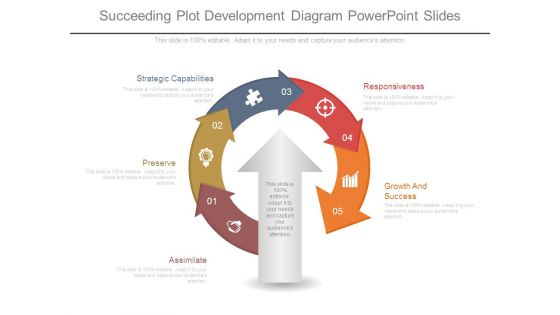
Succeeding Plot Development Diagram Powerpoint Slides
This is a succeeding plot development diagram powerpoint slides. This is a five stage process. The stages in this process are assimilate, preserve, strategic capabilities, responsiveness, growth and success.

Risk Return Plot Ppt PowerPoint Presentation Microsoft
This is a risk return plot ppt powerpoint presentation microsoft. This is a eleven stage process. The stages in this process are annualized return, annualized standard deviation, growth, success.
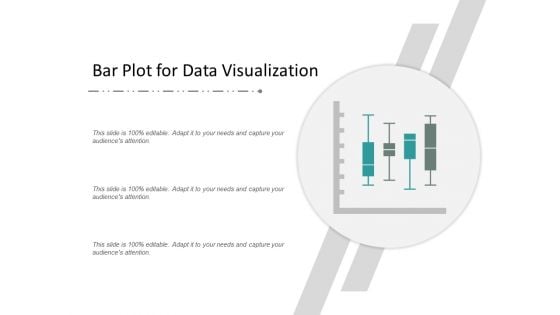
Bar Plot For Data Visualization Ppt Powerpoint Presentation Pictures Guide
This is a bar plot for data visualization ppt powerpoint presentation pictures guide. This is a four stage process. The stages in this process are scatter plot, probability plots, plot diagram.
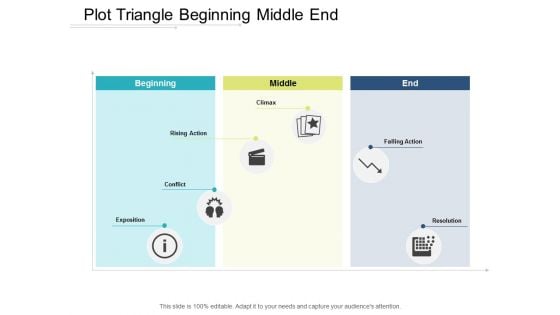
Plot Triangle Beginning Middle End Ppt Powerpoint Presentation Model Diagrams
This is a plot triangle beginning middle end ppt powerpoint presentation model diagrams. This is a three stage process. The stages in this process are scatter plot, probability plots, plot diagram.
Parametric Plot In Powerpoint And Google Slides Cpb
Introducing our well designed Parametric Plot In Powerpoint And Google Slides Cpb. This PowerPoint design presents information on topics like Parametric Plot. As it is predesigned it helps boost your confidence level. It also makes you a better presenter because of its high-quality content and graphics. This PPT layout can be downloaded and used in different formats like PDF, PNG, and JPG. Not only this, it is available in both Standard Screen and Widescreen aspect ratios for your convenience. Therefore, click on the download button now to persuade and impress your audience. Our Parametric Plot In Powerpoint And Google Slides Cpb are topically designed to provide an attractive backdrop to any subject. Use them to look like a presentation pro.
Plot Classification Report Python In Powerpoint And Google Slides Cpb
Presenting our innovatively-designed set of slides titled Plot Classification Report Python In Powerpoint And Google Slides Cpb. This completely editable PowerPoint graphic exhibits Plot Classification Report Python that will help you convey the message impactfully. It can be accessed with Google Slides and is available in both standard screen and widescreen aspect ratios. Apart from this, you can download this well-structured PowerPoint template design in different formats like PDF, JPG, and PNG. So, click the download button now to gain full access to this PPT design. Our Plot Classification Report Python In Powerpoint And Google Slides Cpb are topically designed to provide an attractive backdrop to any subject. Use them to look like a presentation pro.
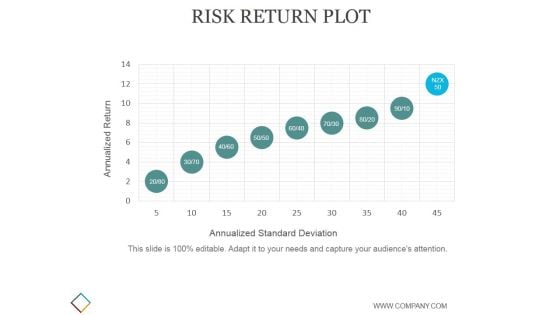
Risk Return Plot Ppt PowerPoint Presentation Background Images
This is a risk return plot ppt powerpoint presentation background images. This is a nine stage process. The stages in this process are annualized return, annualized standard deviation.
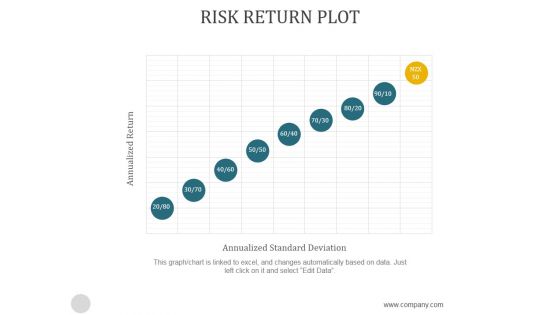
Risk Return Plot Ppt PowerPoint Presentation Background Image
This is a risk return plot ppt powerpoint presentation background image. This is a one stage process. The stages in this process are annualized return, annualized standard deviation.
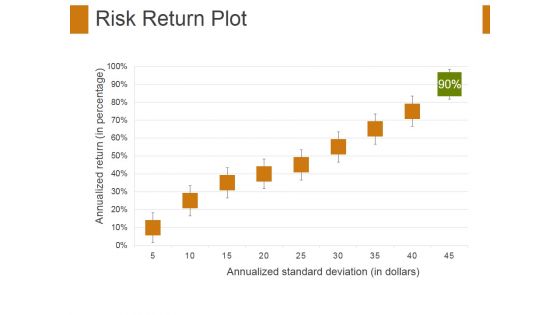
Risk Return Plot Ppt PowerPoint Presentation Styles Visuals
This is a risk return plot ppt powerpoint presentation styles visuals. This is a eight stage process. The stages in this process are annualized standard deviation, annualized return.
Strategic Management Organization Plot Business Finance Strategy Development
Your Thoughts Will Be The Main Course. Provide The Dressing With Our Strategic Management Organization plot Business Finance Strategy Development Powerpoint Templates. Dress Up Your Views With Our Strategic Management Organization plot Business Finance Strategy Development Powerpoint Templates. Deliver Your Ideas With Aplomb.
Computer App Icon With Mapping Plot Chart Icons PDF
Presenting Computer App Icon With Mapping Plot Chart Icons PDF to dispense important information. This template comprises four stages. It also presents valuable insights into the topics including Computer App Icon, Mapping Plot Chart. This is a completely customizable PowerPoint theme that can be put to use immediately. So, download it and address the topic impactfully.
Scatter Plot Grid Diagram Icon For Product Poisting Professional PDF
Presenting Scatter Plot Grid Diagram Icon For Product Poisting Professional PDF to dispense important information. This template comprises three stages. It also presents valuable insights into the topics including Scatter Plot Grid, Diagram Icon, Product Poisting. This is a completely customizable PowerPoint theme that can be put to use immediately. So, download it and address the topic impactfully.
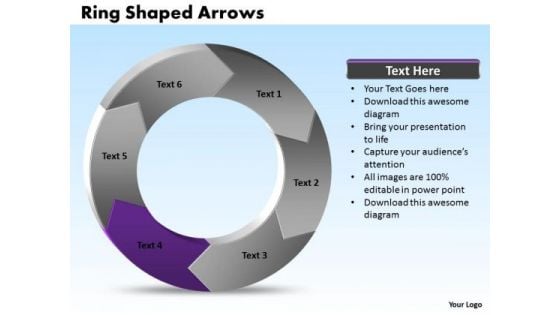
Ppt Plot Diagram PowerPoint Shaped Curved Arrows 2010 Multisteps Templates
PPT plot diagram powerpoint shaped curved arrows 2010 multisteps Templates-Use this digarm to have a general understanding of representing an information system process.This diagram will enhance the essence of your viable ideas-PPT plot diagram powerpoint shaped curved arrows 2010 multisteps Templates-Abstract, Around, Arrow, Arrow Circles, Chart, Circle, Circular, Circular Arrows, Circular Flow, Circulation, Cycle, Cyclic, Direction, Element, Flow, Icon, Illustration, Isolated, Motion, Movement, Refresh, Ring, Rotation, Round, Section, Set, Shape, Sign, Symbol With our Ppt Plot Diagram PowerPoint Shaped Curved Arrows 2010 Multisteps Templates there is no end. They will take you even further.
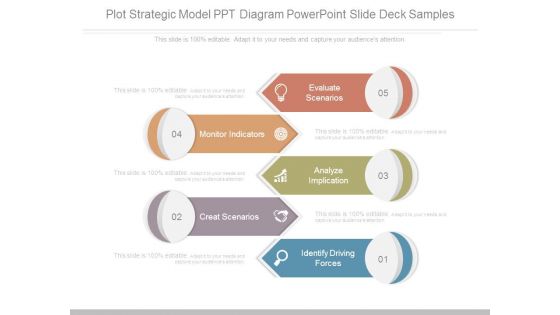
Plot Strategic Model Ppt Diagram Powerpoint Slide Deck Samples
This is a plot strategic model ppt diagram powerpoint slide deck samples. This is a five stage process. The stages in this process are evaluate scenarios, monitor indicators, analyze implication, create scenarios, identify driving forces.

Risk Return Plot Ppt PowerPoint Presentation Summary Graphics Download
This is a risk return plot ppt powerpoint presentation summary graphics download. This is a two stage process. The stages in this process are annualized standard deviation, annualized return.
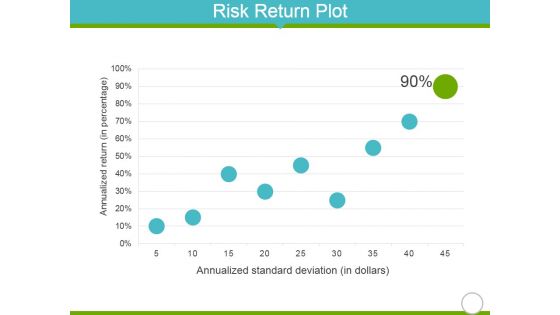
Risk Return Plot Ppt PowerPoint Presentation Infographics Background Designs
This is a risk return plot ppt powerpoint presentation infographics background designs. This is a nine stage process. The stages in this process are annualized return, annualized standard deviation, growth.
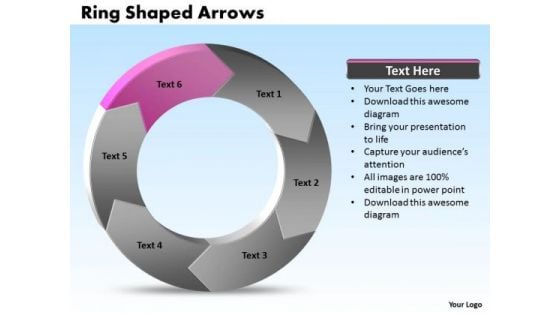
Ppt Plot Diagram PowerPoint Shaped Graphics Arrows 6 Divisions Templates
PPT plot diagram powerpoint shaped graphics arrows 6 divisions Templates-Like your thoughts arrows are inherently precise and true. Illustrate your plans to your listeners with the same accuracy. Show them how to persistently hit bulls eye.Create visually stunning and define your PPT Presentations in a unique and inspiring manner using our above template-PPT plot diagram powerpoint shaped graphics arrows 6 divisions Templates-Abstract, Around, Arrow, Arrow Circles, Chart, Circle, Circular, Circular Arrows, Circular Flow, Circulation, Cycle, Cyclic, Direction, Element, Flow, Icon, Illustration, Isolated, Motion, Movement, Refresh, Ring, Rotation, Round, Section, Set, Shape, Sign, Symbol Our Ppt Plot Diagram PowerPoint Shaped Graphics Arrows 6 Divisions Templates will ensure you make an impressive presentation You will be glad you tried us out.
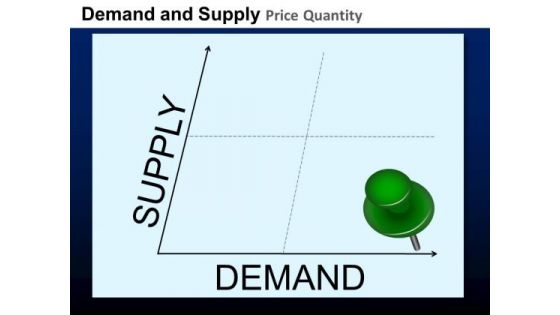
PowerPoint Template Business Supply Demand Curve Plot PowerPoint Slides
PowerPoint Template Business Supply Demand curve Plot PowerPoint Slides-These high quality powerpoint pre-designed slides and powerpoint templates have been carefully created by our professional team to help you impress your audience. All slides have been created and are 100% editable in powerpoint. Each and every property of any graphic - color, size, orientation, shading, outline etc. can be modified to help you build an effective powerpoint presentation. Any text can be entered at any point in the powerpoint template or slide. Simply DOWNLOAD, TYPE and PRESENT! Illustrate your plans for greater efficiency with our PowerPoint Template Business Supply Demand Curve Plot PowerPoint Slides. Work out how to get more for less.
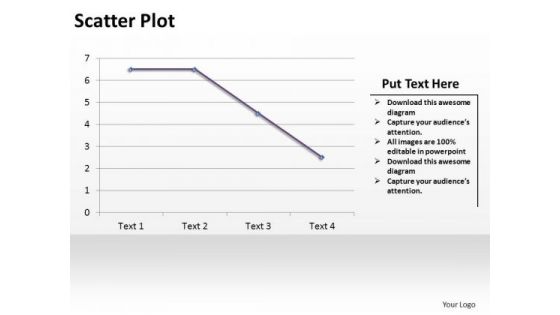
PowerPoint Design Slides Data Driven Scatter Plot Ppt Backgrounds
PowerPoint Design Slides Data Driven Scatter Plot PPT Backgrounds Business Power Points--These amazing PowerPoint pre-designed slides and PowerPoint templates have been carefully created by our team of experts to help you impress your audience. Our stunning collection of Powerpoint slides are 100% editable and can easily fit in any PowerPoint presentations. By using these animations and graphics in PowerPoint and you can easily make professional presentations. Any text can be entered at any point in the PowerPoint template or slide. Just DOWNLOAD our awesome PowerPoint templates and you are ready to go. With our PowerPoint Design Slides Data Driven Scatter Plot Ppt Backgrounds success is a fait accompli. Bet your bottom dollar that it will happen.
Mapping Of Plot Exposition To Resolution Ppt Powerpoint Presentation Icon Example
This is a mapping of plot exposition to resolution ppt powerpoint presentation icon example. This is a five stage process. The stages in this process are scatter plot, probability plots, plot diagram.
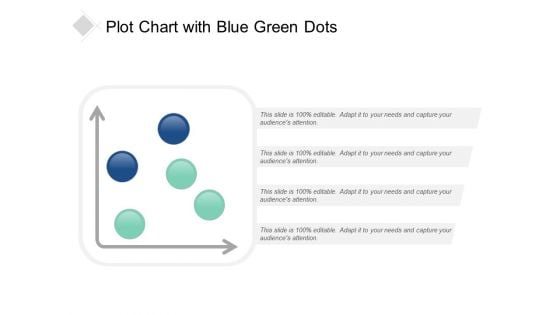
Plot Chart With Blue Green Dots Ppt Powerpoint Presentation Portfolio Graphic Tips
This is a plot chart with blue green dots ppt powerpoint presentation portfolio graphic tips. This is a four stage process. The stages in this process are scatter plot, probability plots, plot diagram.
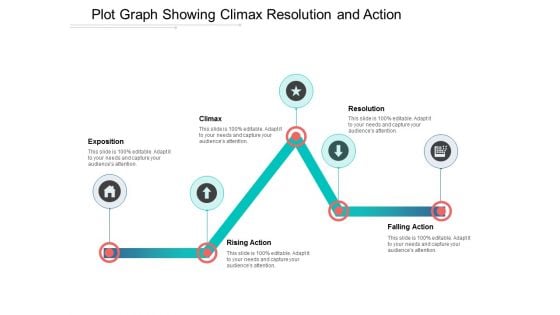
Plot Graph Showing Climax Resolution And Action Ppt Powerpoint Presentation Outline Themes
This is a plot graph showing climax resolution and action ppt powerpoint presentation outline themes. This is a five stage process. The stages in this process are scatter plot, probability plots, plot diagram.
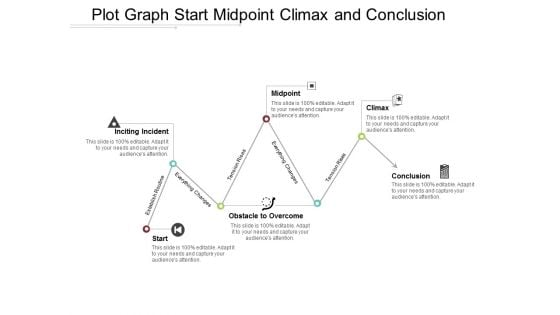
Plot Graph Start Midpoint Climax And Conclusion Ppt Powerpoint Presentation Portfolio Microsoft
This is a plot graph start midpoint climax and conclusion ppt powerpoint presentation portfolio microsoft. This is a six stage process. The stages in this process are scatter plot, probability plots, plot diagram.
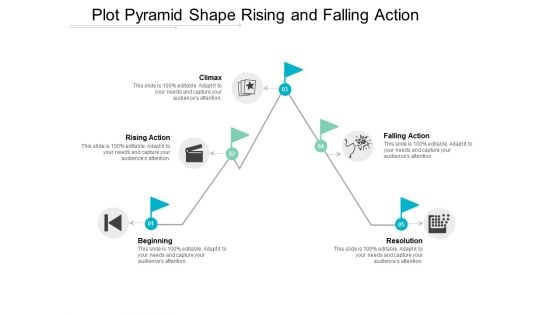
Plot Pyramid Shape Rising And Falling Action Ppt Powerpoint Presentation Slides Images
This is a plot pyramid shape rising and falling action ppt powerpoint presentation slides images. This is a five stage process. The stages in this process are scatter plot, probability plots, plot diagram.
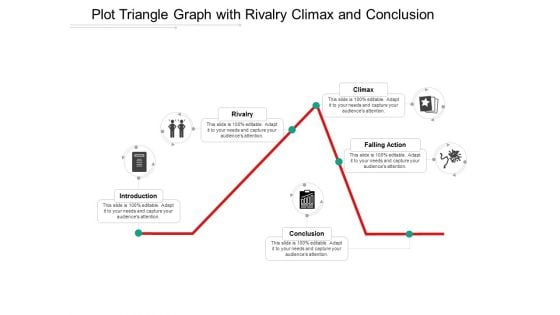
Plot Triangle Graph With Rivalry Climax And Conclusion Ppt Powerpoint Presentation Ideas Design Inspiration
This is a plot triangle graph with rivalry climax and conclusion ppt powerpoint presentation ideas design inspiration. This is a five stage process. The stages in this process are scatter plot, probability plots, plot diagram.
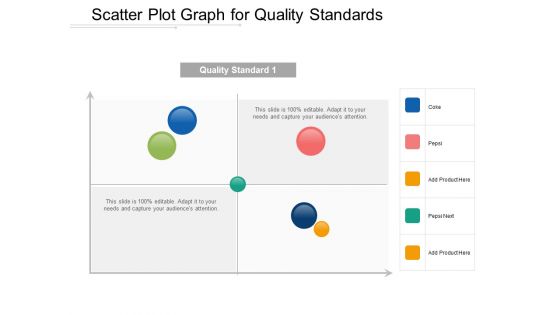
Scatter Plot Graph For Quality Standards Ppt Powerpoint Presentation Show Infographics
This is a scatter plot graph for quality standards ppt powerpoint presentation show infographics. This is a four stage process. The stages in this process are scatter plot, probability plots, plot diagram.
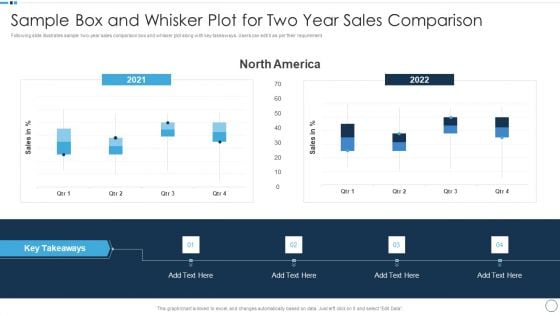
QA Plan Set 1 Sample Box And Whisker Plot For Two Year Sales Comparison Themes PDF
Following slide illustrates sample two year sales comparison box and whisker plot along with key takeaways. Users can edit it as per their requirement. Deliver and pitch your topic in the best possible manner with this QA Plan Set 1 Sample Box And Whisker Plot For Two Year Sales Comparison Themes PDF. Use them to share invaluable insights on Sales Comparison and impress your audience. This template can be altered and modified as per your expectations. So, grab it now.
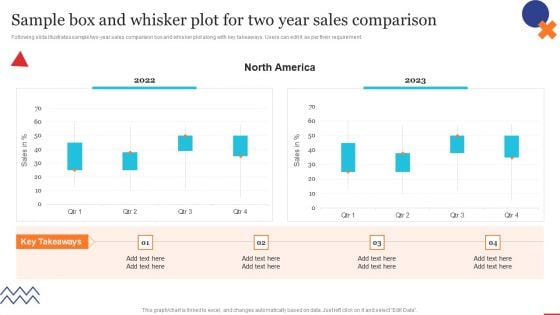
Sample Box And Whisker Plot For Two Year Quality Control Planning Templates Set 1 Download PDF
Following slide illustrates sample two-year sales comparison box and whisker plot along with key takeaways. Users can edit it as per their requirement.Find highly impressive Sample Box And Whisker Plot For Two Year Quality Control Planning Templates Set 1 Download PDF on Slidegeeks to deliver a meaningful presentation. You can save an ample amount of time using these presentation templates. No need to worry to prepare everything from scratch because Slidegeeks experts have already done a huge research and work for you. You need to download Sample Box And Whisker Plot For Two Year Quality Control Planning Templates Set 1 Download PDF for your upcoming presentation. All the presentation templates are 100precent editable and you can change the color and personalize the content accordingly. Download now,
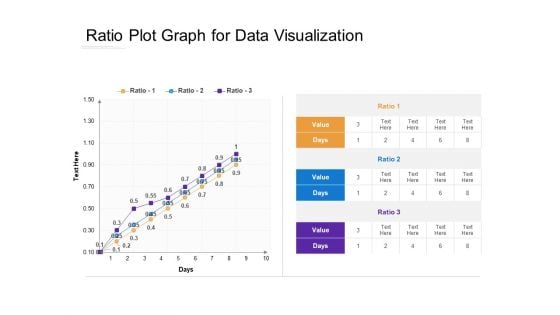
Ratio Plot Graph For Data Visualization Ppt PowerPoint Presentation Ideas Outfit PDF
Presenting this set of slides with name ratio plot graph for data visualization ppt powerpoint presentation ideas outfit pdf. The topics discussed in these slides are ratio, value, days. This is a completely editable PowerPoint presentation and is available for immediate download. Download now and impress your audience.
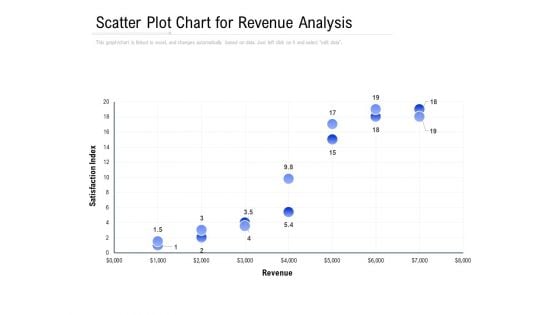
Scatter Plot Chart For Revenue Analysis Ppt PowerPoint Presentation Show Graphics Example PDF
Presenting this set of slides with name scatter plot chart for revenue analysis ppt powerpoint presentation show graphics example pdf. The topics discussed in these slides are satisfaction index, revenue. This is a completely editable PowerPoint presentation and is available for immediate download. Download now and impress your audience.

Map Plot Tag Symbol Location Globe Ppt PowerPoint Presentation Complete Deck
This map plot tag symbol location globe ppt powerpoint presentation complete deck acts as backup support for your ideas, vision, thoughts, etc. Use it to present a thorough understanding of the topic. This PPT slideshow can be utilized for both in-house and outside presentations depending upon your needs and business demands. Entailing twelve slides with a consistent design and theme, this template will make a solid use case. As it is intuitively designed, it suits every business vertical and industry. All you have to do is make a few tweaks in the content or any other component to design unique presentations. The biggest advantage of this complete deck is that it can be personalized multiple times once downloaded. The color, design, shapes, and other elements are free to modify to add personal touches. You can also insert your logo design in this PPT layout. Therefore a well-thought and crafted presentation can be delivered with ease and precision by downloading this map plot tag symbol location globe ppt powerpoint presentation complete deck PPT slideshow.
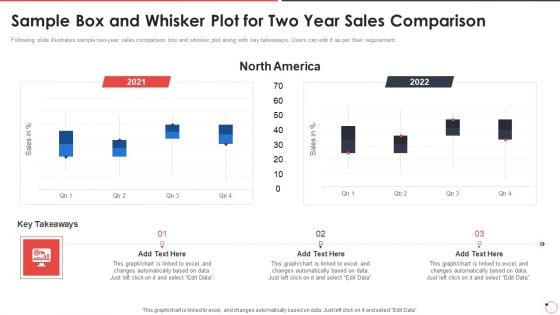
Quality Assurance Templates Set 1 Sample Box And Whisker Plot For Two Year Sales Comparison Ppt Slides Visual Aids PDF
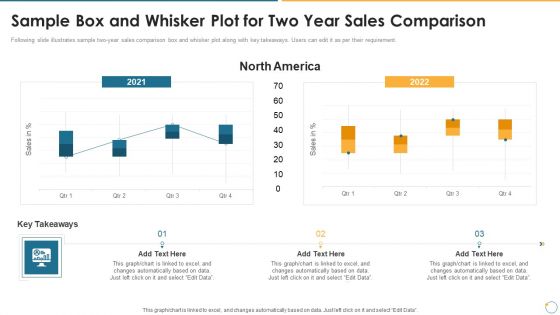
Collection Of Quality Assurance PPT Sample Box And Whisker Plot For Two Year Sales Comparison Elements PDF
Following slide illustrates sample two to year sales comparison box and whisker plot along with key takeaways. Users can edit it as per their requirement. Deliver an awe inspiring pitch with this creative collection of quality assurance ppt sample box and whisker plot for two year sales comparison elements pdf bundle. Topics like graph, data can be discussed with this completely editable template. It is available for immediate download depending on the needs and requirements of the user.
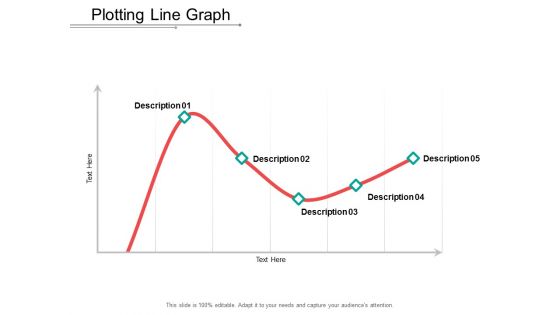
Plotting Line Graph Ppt Powerpoint Presentation Styles Maker
This is a plotting line graph ppt powerpoint presentation styles maker. This is a five stage process. The stages in this process are scatter plot, probability plots, plot diagram.
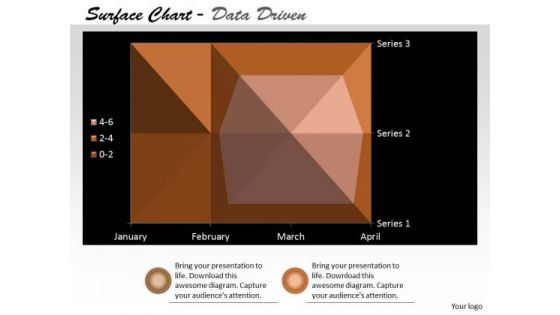
Multivariate Data Analysis Surface Chart Plots Trends PowerPoint Templates
Our multivariate data analysis surface chart plots trends Powerpoint Templates Heighten Concentration. Your Audience Will Be On The Edge.
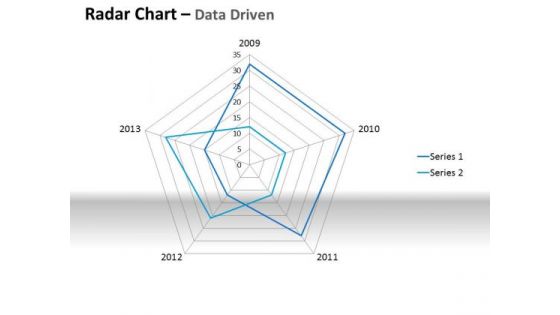
Examples Of Data Analysis Market Driven Plotting The Business Values PowerPoint Slides Templates
Ring The Duck With Our examples of data analysis market driven plotting the business values powerpoint slides Templates . Acquire The Points With Your Ideas.
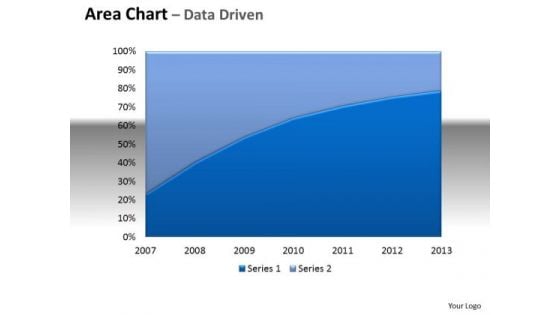
Financial Data Analysis Area Chart With Plotted Line Center PowerPoint Templates
Be The Doer With Our financial data analysis area chart with plotted line center Powerpoint Templates . Put Your Thoughts Into Practice.
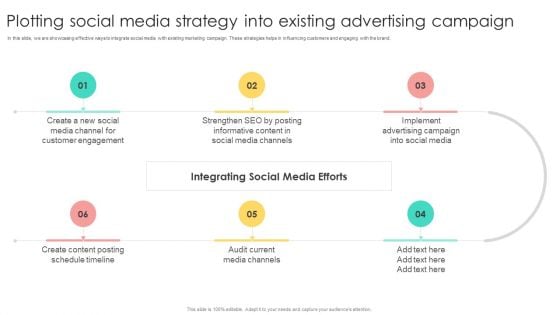
Media Advertising Plotting Social Media Strategy Into Existing Advertising Campaign Portrait PDF
In this slide, we are showcasing effective ways to integrate social media with existing marketing campaign. These strategies helps in influencing customers and engaging with the brand. Boost your pitch with our creative Media Advertising Plotting Social Media Strategy Into Existing Advertising Campaign Portrait PDF. Deliver an awe-inspiring pitch that will mesmerize everyone. Using these presentation templates you will surely catch everyones attention. You can browse the ppts collection on our website. We have researchers who are experts at creating the right content for the templates. So you do not have to invest time in any additional work. Just grab the template now and use them.
Distributed Network Graph Algorithm Ppt Powerpoint Presentation Outline Master Slide
This is a distributed network graph algorithm ppt powerpoint presentation outline master slide. This is a four stage process. The stages in this process are scatter plot, probability plots, plot diagram.
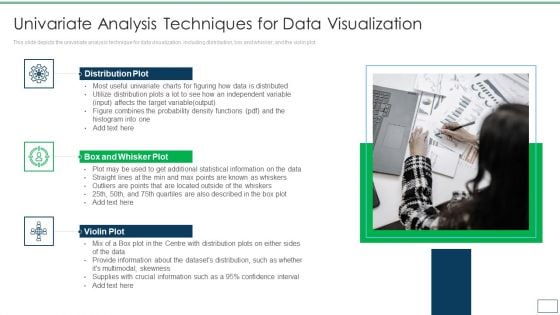
Departments Of Visualization Research Univariate Analysis Techniques For Data Visualization Microsoft PDF
This slide depicts the univariate analysis technique for data visualization, including distribution, box and whisker, and the violin plot.This is a Departments Of Visualization Research Univariate Analysis Techniques For Data Visualization Microsoft PDF template with various stages. Focus and dispense information on three stages using this creative set, that comes with editable features. It contains large content boxes to add your information on topics like Distribution Plot, Box And Whisker Plot, Violin Plot You can also showcase facts, figures, and other relevant content using this PPT layout. Grab it now.
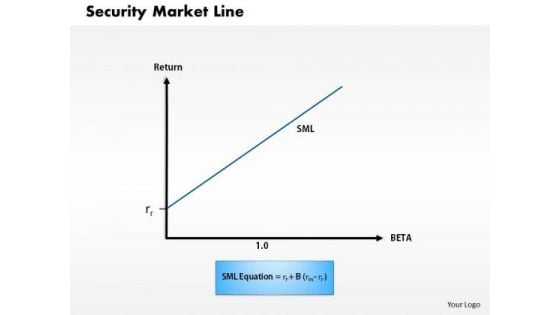
Business Framework Security Market Line 1 PowerPoint Presentation
This diagram displays graph of security market line. You can use line graph to plot changes in data over time, such as monthly revenue and earnings changes or daily changes in stock market prices.
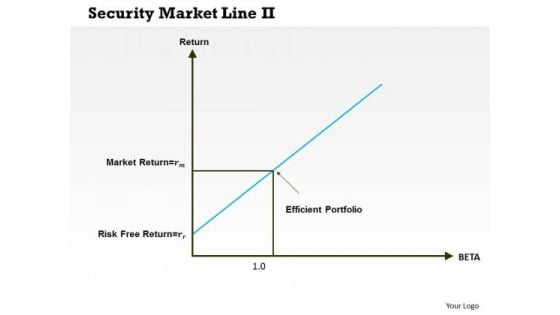
Business Framework Security Market Line 11 PowerPoint Presentation
This diagram displays graph of security market line. You can use line graph to plot changes in data over time, such as monthly revenue and earnings changes or daily changes in stock market prices.
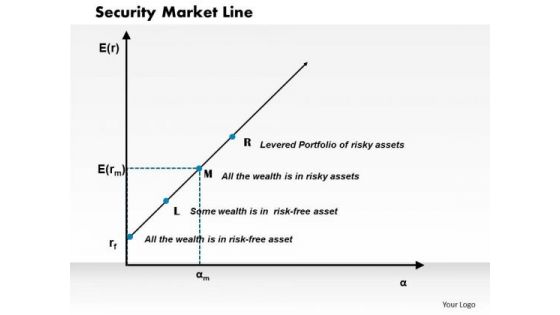
Business Framework Security Market Line PowerPoint Presentation
This diagram displays graph of security market line. You can use line graph to plot changes in data over time, such as monthly revenue and earnings changes or daily changes in stock market prices.
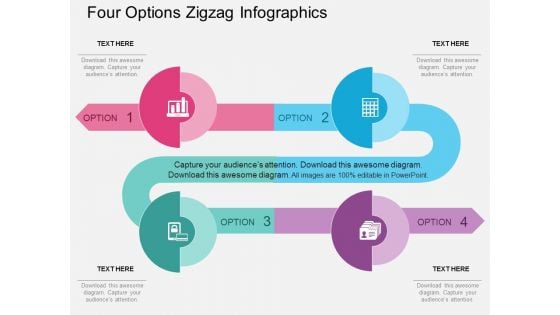
Four Options Zigzag Infographics Powerpoint Template
Emphatically define your message with our above template which contains four options zigzag infographic. This business diagram may be used to plot data series. Deliver amazing presentations to mesmerize your audience.
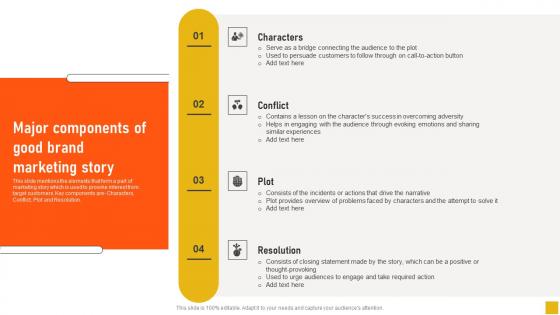
Major Components Of Good Brand Marketing Story Comprehensive Guide Introduction Pdf
This slide mentions the elements that form a part of marketing story which is used to provoke interest from target customers. Key components are- Characters, Conflict, Plot and Resolution. Do you have an important presentation coming up Are you looking for something that will make your presentation stand out from the rest Look no further than Major Components Of Good Brand Marketing Story Comprehensive Guide Introduction Pdf With our professional designs, you can trust that your presentation will pop and make delivering it a smooth process. And with Slidegeeks, you can trust that your presentation will be unique and memorable. So why wait Grab Major Components Of Good Brand Marketing Story Comprehensive Guide Introduction Pdf today and make your presentation stand out from the rest. This slide mentions the elements that form a part of marketing story which is used to provoke interest from target customers. Key components are- Characters, Conflict, Plot and Resolution.
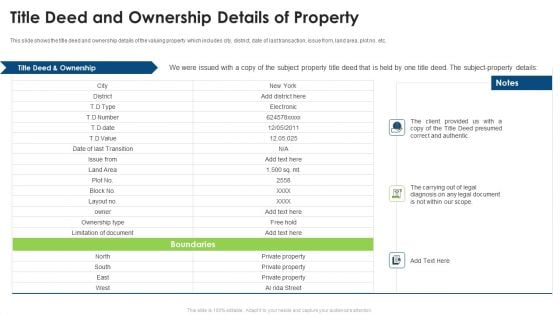
Commercial Property Evaluation Techniques Title Deed And Ownership Details Of Property Clipart PDF
This slide shows the title deed and ownership details of the valuing property which includes city, district, date of last transaction, issue from, land area, plot no. etc. Deliver an awe inspiring pitch with this creative commercial property evaluation techniques title deed and ownership details of property clipart pdf bundle. Topics like title deed and ownership details of property can be discussed with this completely editable template. It is available for immediate download depending on the needs and requirements of the user.
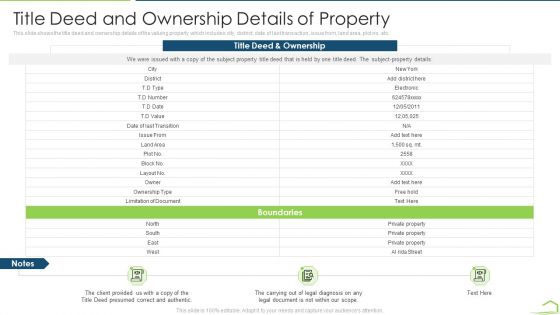
Procedure Land Estimation Examination Title Deed And Ownership Details Of Property Slides PDF
This slide shows the title deed and ownership details of the valuing property which includes city, district, date of last transaction, issue from, land area, plot no. etc. Deliver an awe-inspiring pitch with this creative procedure land estimation examination title deed and ownership details of property slides pdf bundle. Topics like title deed and ownership details of property can be discussed with this completely editable template. It is available for immediate download depending on the needs and requirements of the user.
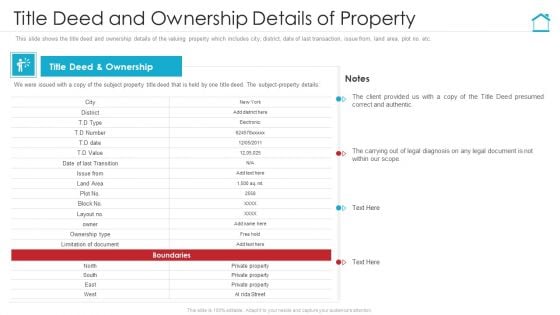
Title Deed And Ownership Details Of Property Designs PDF
This slide shows the title deed and ownership details of the valuing property which includes city, district, date of last transaction, issue from, land area, plot no. etc. Deliver an awe inspiring pitch with this creative title deed and ownership details of property designs pdf bundle. Topics like title deed and ownership details of property can be discussed with this completely editable template. It is available for immediate download depending on the needs and requirements of the user.
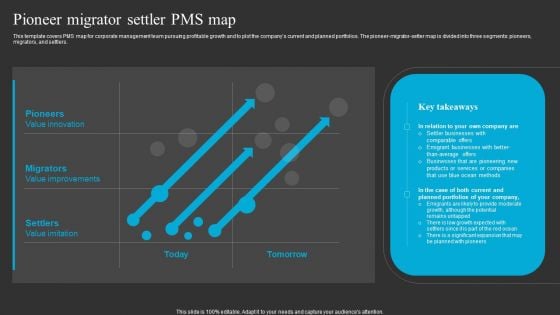
Pioneer Migrator Settler Pms Map Ppt Slides Layout Ideas PDF
This template covers PMS map for corporate management team pursuing profitable growth and to plot the companys current and planned portfolios. The pioneer-migrator-setter map is divided into three segments pioneers, migrators, and settlers. There are so many reasons you need a Pioneer Migrator Settler Pms Map Ppt Slides Layout Ideas PDF. The first reason is you can not spend time making everything from scratch, Thus, Slidegeeks has made presentation templates for you too. You can easily download these templates from our website easily.
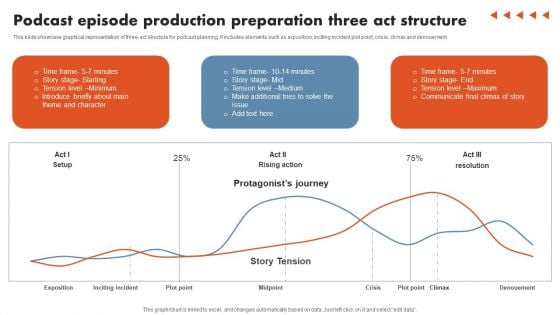
Podcast Episode Production Preparation Three Act Structure Elements PDF
This slide showcase graphical representation of three-act structure for podcast planning. It includes elements such as exposition, inciting incident plot point, crisis, climax and denouement. Pitch your topic with ease and precision using this Podcast Episode Production Preparation Three Act Structure Elements PDF. This layout presents information on Podcast Episode Production, Preparation Three Act Structure. It is also available for immediate download and adjustment. So, changes can be made in the color, design, graphics or any other component to create a unique layout.
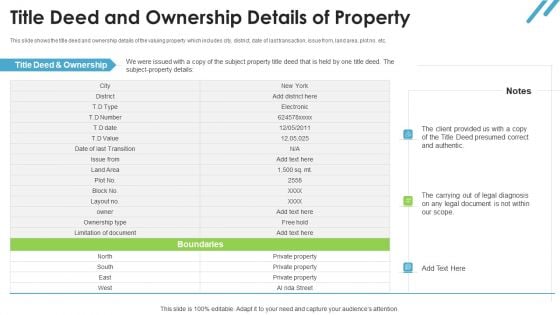
Real Estate Valuation Approaches For Property Shareholders Title Deed And Ownership Details Of Property Professional PDF
This slide shows the title deed and ownership details of the valuing property which includes city, district, date of last transaction, issue from, land area, plot no. etc. Deliver and pitch your topic in the best possible manner with this real estate valuation approaches for property shareholders title deed and ownership details of property professional pdf. Use them to share invaluable insights on title deed and ownership details of propert and impress your audience. This template can be altered and modified as per your expectations. So, grab it now.

Four Stages Of Strategic Framework For Data Management Strategy Ppt Outline Samples PDF
This slide showcases steps to control and organize business analytics which is increasingly driving decision-making in organizations. It includes information about identify, assess, propose and plot out. Presenting Four Stages Of Strategic Framework For Data Management Strategy Ppt Outline Samples PDF to dispense important information. This template comprises four stages. It also presents valuable insights into the topics including Management Team, Business Goals, Increase Customer. This is a completely customizable PowerPoint theme that can be put to use immediately. So, download it and address the topic impactfully.
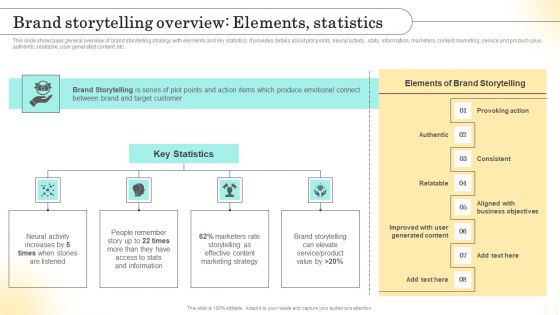
Emotional Marketing Strategy To Nurture Brand Storytelling Overview Elements Statistics Pictures PDF
This slide showcases general overview of brand storytelling strategy with elements and key statistics. It provides details about plot points, neural activity, stats, information, marketers, content marketing, service and product value, authentic, relatable, user generated content, etc. There are so many reasons you need a Emotional Marketing Strategy To Nurture Brand Storytelling Overview Elements Statistics Pictures PDF. The first reason is you cant spend time making everything from scratch, Thus, Slidegeeks has made presentation templates for you too. You can easily download these templates from our website easily.

 Home
Home