Presentation Kpi
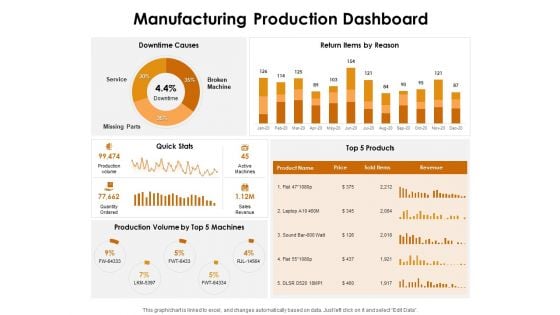
KPI Dashboards Per Industry Manufacturing Production Dashboard Ppt PowerPoint Presentation Portfolio Shapes PDF
Deliver an awe-inspiring pitch with this creative kpi dashboards per industry manufacturing production dashboard ppt powerpoint presentation portfolio shapes pdf bundle. Topics like downtime causes, return items reason, quick stats, top 5 products, production volume top 5 machines can be discussed with this completely editable template. It is available for immediate download depending on the needs and requirements of the user.
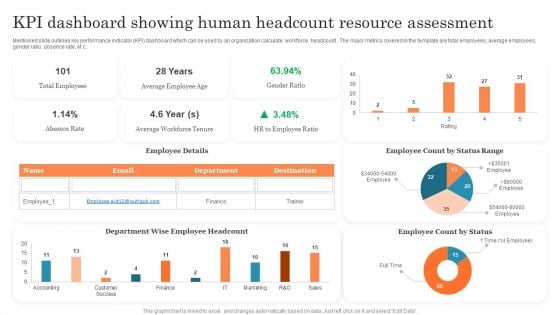
KPI Dashboard Showing Human Headcount Resource Assessment Ppt PowerPoint Presentation Outline PDF
Mentioned slide outlines key performance indicator KPI dashboard which can be used by an organization calculate workforce headcount . The major metrics covered in the template are total employees, average employees, gender ratio, absence rate, etc. Pitch your topic with ease and precision using this KPI Dashboard Showing Human Headcount Resource Assessment Ppt PowerPoint Presentation Outline PDF. This layout presents information on Total Employees, Average Employee, Employee Count. It is also available for immediate download and adjustment. So, changes can be made in the color, design, graphics or any other component to create a unique layout.
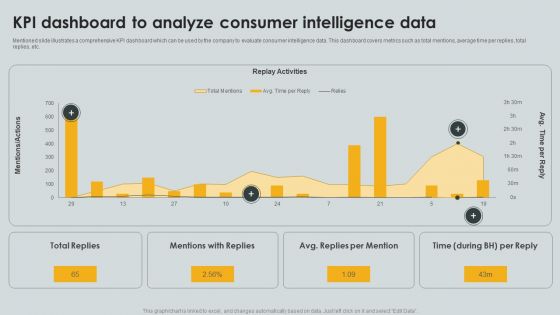
KPI Dashboard To Analyze Consumer Intelligence Data Ppt PowerPoint Presentation File Portfolio PDF
Mentioned slide illustrates a comprehensive KPI dashboard which can be used by the company to evaluate consumer intelligence data. This dashboard covers metrics such as total mentions, average time per replies, total replies, etc. Pitch your topic with ease and precision using this KPI Dashboard To Analyze Consumer Intelligence Data Ppt PowerPoint Presentation File Portfolio PDF. This layout presents information on Replay Activities, Total Replies, Mentions Replies. It is also available for immediate download and adjustment. So, changes can be made in the color, design, graphics or any other component to create a unique layout.
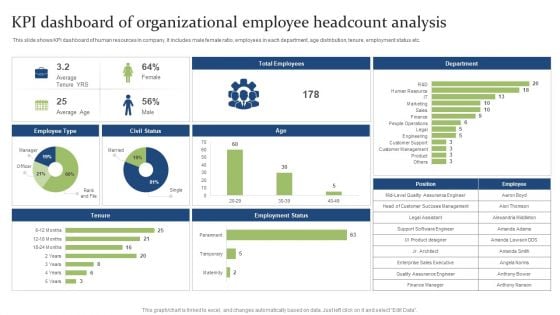
KPI Dashboard Of Organizational Employee Headcount Analysis Ppt PowerPoint Presentation Styles Show PDF
This slide shows KPI dashboard of human resources in company. It includes male female ratio, employees in each department, age distribution, tenure, employment status etc. Showcasing this set of slides titled KPI Dashboard Of Organizational Employee Headcount Analysis Ppt PowerPoint Presentation Styles Show PDF. The topics addressed in these templates are Support Software, Engineer Success, Sales Executive. All the content presented in this PPT design is completely editable. Download it and make adjustments in color, background, font etc. as per your unique business setting.
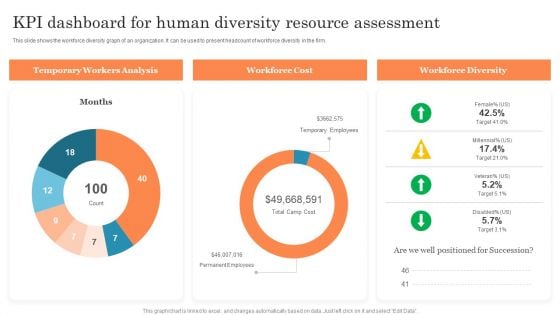
KPI Dashboard For Human Diversity Resource Assessment Ppt PowerPoint Presentation Model Vector PDF
This slide shows the workforce diversity graph of an organization. It can be used to present headcount of workforce diversity in the firm. Showcasing this set of slides titled KPI Dashboard For Human Diversity Resource Assessment Ppt PowerPoint Presentation Model Vector PDF. The topics addressed in these templates are Temporary Workers, Temporary Employees, Workforce Diversity. All the content presented in this PPT design is completely editable. Download it and make adjustments in color, background, font etc. as per your unique business setting.
KPI Dashboards Per Industry Retail Store Dashboard Ppt PowerPoint Presentation Icon Grid PDF
Deliver an awe-inspiring pitch with this creative kpi dashboards per industry retail store dashboard ppt powerpoint presentation icon grid pdf bundle. Topics like total customers and visitors, avg price and units per transaction, out stock items, sales city, top 5 articles by sold items, top 5 articles revenue can be discussed with this completely editable template. It is available for immediate download depending on the needs and requirements of the user.
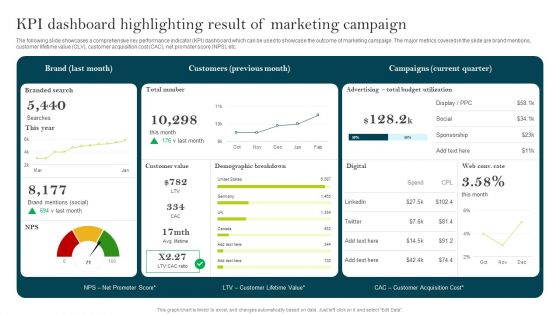
KPI Dashboard Highlighting Result Of Marketing Campaign Ppt PowerPoint Presentation Diagram Lists PDF
The following slide showcases a comprehensive key performance indicator KPI dashboard which can be used to showcase the outcome of marketing campaign. The major metrics covered in the slide are brand mentions, customer lifetime value CLV, customer acquisition cost CAC, net promoter score NPS, etc. Are you in need of a template that can accommodate all of your creative concepts This one is crafted professionally and can be altered to fit any style. Use it with Google Slides or PowerPoint. Include striking photographs, symbols, depictions, and other visuals. Fill, move around, or remove text boxes as desired. Test out color palettes and font mixtures. Edit and save your work, or work with colleagues. Download KPI Dashboard Highlighting Result Of Marketing Campaign Ppt PowerPoint Presentation Diagram Lists PDF and observe how to make your presentation outstanding. Give an impeccable presentation to your group and make your presentation unforgettable.
Kpi Dashboard For Tracking Shareholder Value Maximization Ppt PowerPoint Presentation File Icon PDF
This slide showcases the KPI dashboard that would help the business organization to track shareholder and companys valuation. It includes parameters such as total dividend growth rate, total capital return, share count reduced, etc. Retrieve professionally designed Kpi Dashboard For Tracking Shareholder Value Maximization Ppt PowerPoint Presentation File Icon PDF to effectively convey your message and captivate your listeners. Save time by selecting pre made slideshows that are appropriate for various topics, from business to educational purposes. These themes come in many different styles, from creative to corporate, and all of them are easily adjustable and can be edited quickly. Access them as PowerPoint templates or as Google Slides themes. You do not have to go on a hunt for the perfect presentation because Slidegeeks got you covered from everywhere.
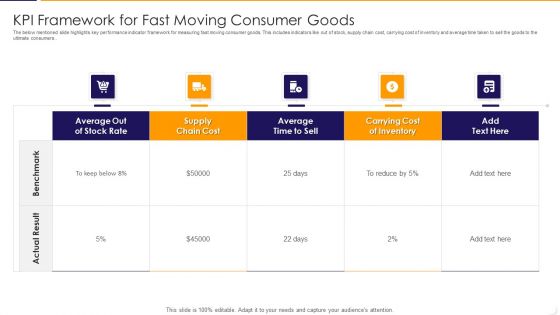
KPI Framework For Fast Moving Consumer Goods Ppt PowerPoint Presentation File Show PDF
The below mentioned slide highlights key performance indicator framework for measuring fast moving consumer goods. This includes indicators like out of stock, supply chain cost, carrying cost of inventory and average time taken to sell the goods to the ultimate consumers. Pitch your topic with ease and precision using this kpi framework for fast moving consumer goods ppt powerpoint presentation file show pdf This layout presents information on average, stock rate, cost It is also available for immediate download and adjustment. So, changes can be made in the color, design, graphics or any other component to create a unique layout.
KPI Framework For Customer Acquisition And Retention Ppt PowerPoint Presentation Icon Diagrams PDF
This slide illustrates key performance indicator framework for customer acquisition and retention such as customer churn rate, customer lifetime value, repeat purchase rate and customer acquisition cost. It also provides information about comparison of standard and actual performance of kips. Showcasing this set of slides titled kpi framework for customer acquisition and retention ppt powerpoint presentation icon diagrams pdf The topics addressed in these templates are customer, value, acquisition cost. All the content presented in this PPT design is completely editable. Download it and make adjustments in color, background, font etc. as per your unique business setting.
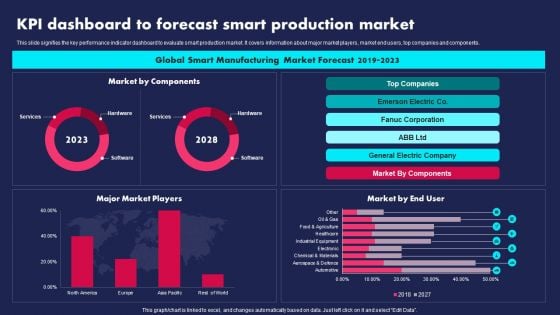
KPI Dashboard To Forecast Smart Production Market Ppt PowerPoint Presentation Gallery Visual Aids PDF
This slide signifies the key performance indicator dashboard to evaluate smart production market. It covers information about major market players, market end users, top companies and components. Pitch your topic with ease and precision using this KPI Dashboard To Forecast Smart Production Market Ppt PowerPoint Presentation Gallery Visual Aids PDF. This layout presents information on Global Smart Manufacturing, Market Forecast, 2019 To 2023. It is also available for immediate download and adjustment. So, changes can be made in the color, design, graphics or any other component to create a unique layout.
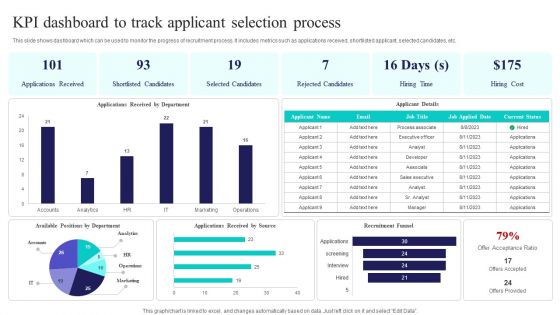
Kpi Dashboard To Track Applicant Selection Process Ppt PowerPoint Presentation File Graphics Template PDF
This slide shows dashboard which can be used to monitor the progress of recruitment process. It includes metrics such as applications received, shortlisted applicant, selected candidates, etc. Pitch your topic with ease and precision using this Kpi Dashboard To Track Applicant Selection Process Ppt PowerPoint Presentation File Graphics Template PDF. This layout presents information on Applications Received, Shortlisted Candidates, Selected Candidates. It is also available for immediate download and adjustment. So, changes can be made in the color, design, graphics or any other component to create a unique layout.
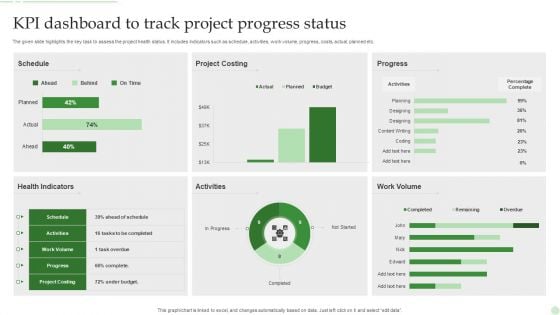
KPI Dashboard To Track Project Progress Status Ppt PowerPoint Presentation Gallery Maker PDF
The given slide highlights the key task to assess the project health status. It includes indicators such as schedule, activities, work volume, progress, costs, actual, planned etc. Showcasing this set of slides titled KPI Dashboard To Track Project Progress Status Ppt PowerPoint Presentation Gallery Maker PDF. The topics addressed in these templates are Schedule, Project Costing, Progress, Activities. All the content presented in this PPT design is completely editable. Download it and make adjustments in color, background, font etc. as per your unique business setting.

KPI Dashboard To Track First Time Leads Ppt PowerPoint Presentation File Pictures PDF
The following slide showcases dashboard which can help businesses assess information about newly generated leads. It provides information about leads, permissions gained by source, revenue, sales closed, MailChimp, email, ads, etc. Take your projects to the next level with our ultimate collection of KPI Dashboard To Track First Time Leads Ppt PowerPoint Presentation File Pictures PDF. Slidegeeks has designed a range of layouts that are perfect for representing task or activity duration, keeping track of all your deadlines at a glance. Tailor these designs to your exact needs and give them a truly corporate look with your own brand colors they will make your projects stand out from the rest.
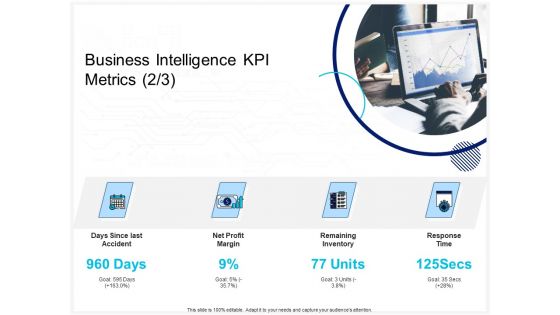
Enterprise Problem Solving And Intellect Business Intelligence KPI Metrics Profit Ppt PowerPoint Presentation Infographic Template Portrait PDF
Presenting this set of slides with name enterprise problem solving and intellect business intelligence kpi metrics profit ppt powerpoint presentation infographic template portrait pdf. This is a four stage process. The stages in this process are days since last accident, net profit margin, remaining inventory, response time. This is a completely editable PowerPoint presentation and is available for immediate download. Download now and impress your audience.
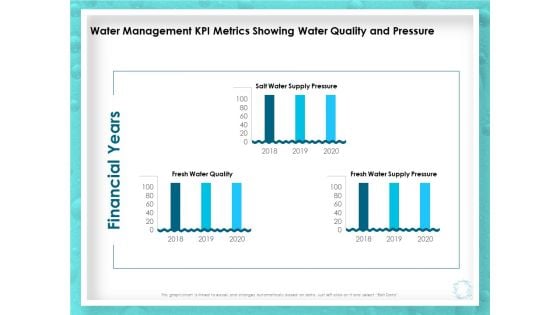
WQM System Water Management KPI Metrics Showing Water Quality And Pressure Ppt PowerPoint Presentation Model Example File PDF
Presenting this set of slides with name wqm system water management kpi metrics showing water quality and pressure ppt powerpoint presentation model example file pdf. The topics discussed in these slides are financial years, fresh water quality, fresh water supply pressure, salt water supply pressure, 2018 to 2020. This is a completely editable PowerPoint presentation and is available for immediate download. Download now and impress your audience.
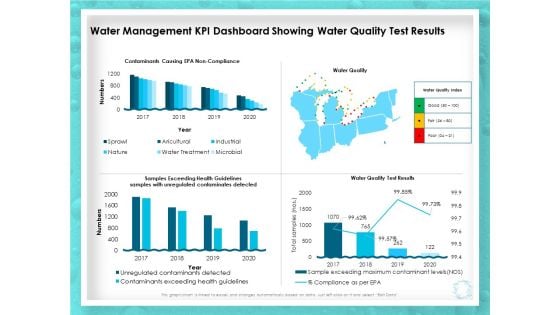
WQM System Water Management KPI Dashboard Showing Water Quality Test Results Ppt PowerPoint Presentation Outline Portfolio PDF
Presenting this set of slides with name wqm system water management kpi dashboard showing water quality test results ppt powerpoint presentation outline portfolio pdf. The topics discussed in these slides are contaminants causing epa non compliance, water quality, water quality test results, samples exceeding health guidelines. This is a completely editable PowerPoint presentation and is available for immediate download. Download now and impress your audience.

Communication KPI Dashboard With KPI Comparison Ideas PDF
Pitch your topic with ease and precision using this Communication KPI Dashboard With KPI Comparison Ideas PDF This layout presents information on Increase In Brand, Employees Knowledge, Vision Statement It is also available for immediate download and adjustment. So, changes can be made in the color, design, graphics or any other component to create a unique layout.
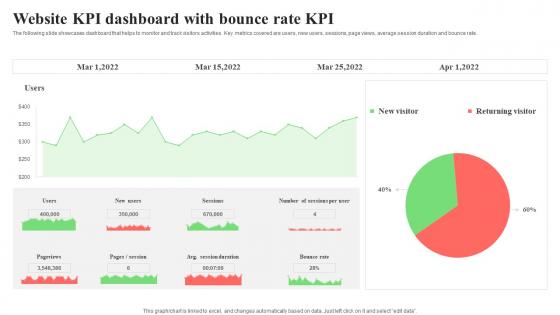
Website KPI Dashboard With Bounce Rate KPI Formats Pdf
The following slide showcases dashboard that helps to monitor and track visitors activities. Key metrics covered are users, new users, sessions, page views, average session duration and bounce rate. Pitch your topic with ease and precision using this Website KPI Dashboard With Bounce Rate KPI Formats Pdf. This layout presents information on Page Views, Average Session Duration, Bounce Rate. It is also available for immediate download and adjustment. So, changes can be made in the color, design, graphics or any other component to create a unique layout. The following slide showcases dashboard that helps to monitor and track visitors activities. Key metrics covered are users, new users, sessions, page views, average session duration and bounce rate.
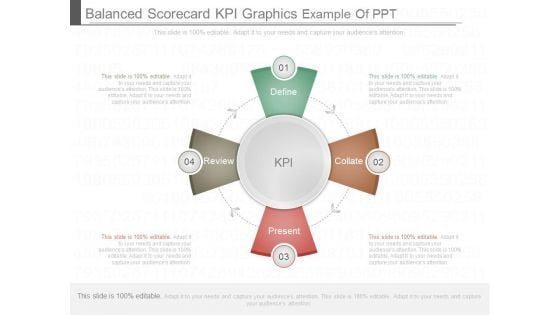
Balanced Scorecard Kpi Graphics Example Of Ppt
This is a balanced scorecard kpi graphics example of ppt. This is a four stage process. The stages in this process are define, review, present, collate. Kpi.
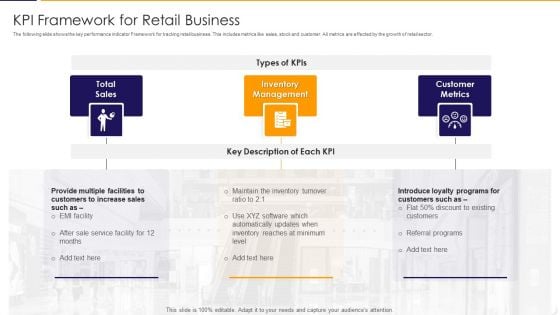
KPI Framework For Retail Business Elements PDF
The following slide shows the key performance indicator Framework for tracking retail business. This includes metrics like sales, stock and customer. All metrics are affected by the growth of retail sector. Presenting kpi framework for retail business elements pdf to dispense important information. This template comprises three stages. It also presents valuable insights into the topics including total sales, inventory management, customer metrics. This is a completely customizable PowerPoint theme that can be put to use immediately. So, download it and address the topic impactfully.
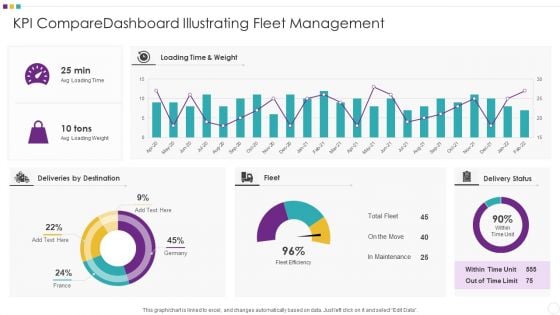
KPI Comparedashboard Illustrating Fleet Management Clipart PDF
Pitch your topic with ease and precision using this KPI Comparedashboard Illustrating Fleet Management Clipart PDF This layout presents information on KPI Comparedashboard Illustrating Fleet Management It is also available for immediate download and adjustment. So, changes can be made in the color, design, graphics or any other component to create a unique layout.
KPI Dashboard Of Client Support Icons PDF
This slide shows customer service delivery key performance indicators dashboard. It includes KPIs such as issues received, average time to close issues, first call resolution, top performers, etc. Pitch your topic with ease and precision using this KPI Dashboard Of Client Support Icons PDF. This layout presents information on KPI Dashboard, Client Support. It is also available for immediate download and adjustment. So, changes can be made in the color, design, graphics or any other component to create a unique layout.
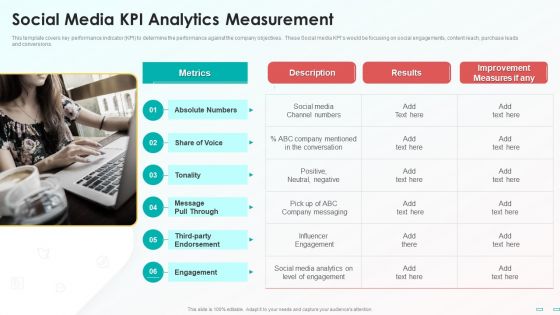
Social Media Kpi Analytics Measurement Demonstration PDF
This template covers key performance indicator KPI to determine the performance against the company objectives. These Social media KPIs would be focusing on social engagements, content reach, purchase leads and conversions. Presenting Social Media Kpi Analytics Measurement Demonstration PDF to provide visual cues and insights. Share and navigate important information on one stages that need your due attention. This template can be used to pitch topics like Metrics, Social Media, Improvement Measures. In addtion, this PPT design contains high resolution images, graphics, etc, that are easily editable and available for immediate download.
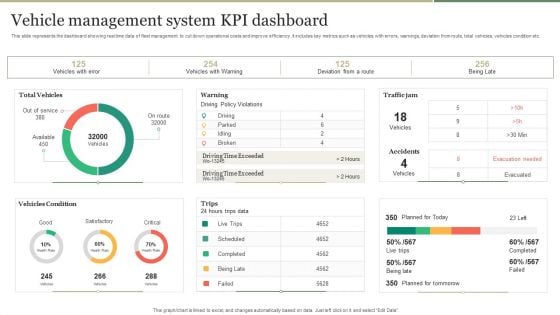
Vehicle Management System KPI Dashboard Introduction PDF
This slide represents the dashboard showing real time data of fleet management to cut down operational costs and improve efficiency. It includes key metrics such as vehicles with errors, warnings, deviation from route, total vehicles, vehicles condition etc. Pitch your topic with ease and precision using this Vehicle Management System KPI Dashboard Introduction PDF. This layout presents information on Vehicle Management System, KPI Dashboard. It is also available for immediate download and adjustment. So, changes can be made in the color, design, graphics or any other component to create a unique layout.
Consumer Demand Kpi Measurement Icon Clipart PDF
Showcasing this set of slides titled Consumer Demand Kpi Measurement Icon Clipart PDF. The topics addressed in these templates are Consumer Demand KPI Measurement Icon. All the content presented in this PPT design is completely editable. Download it and make adjustments in color, background, font etc. as per your unique business setting.
Manager Checking PMO KPI Dashboard Mockup PDF
Persuade your audience using this Manager Checking PMO KPI Dashboard Mockup PDF This PPT design covers three stages, thus making it a great tool to use. It also caters to a variety of topics including Manager Checking, Pmo Kpi Dashboard Download this PPT design now to present a convincing pitch that not only emphasizes the topic but also showcases your presentation skills.
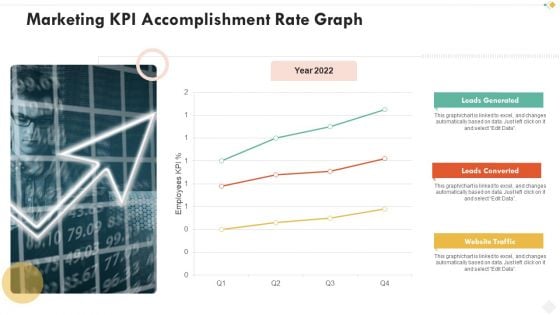
Marketing Kpi Accomplishment Rate Graph Mockup PDF
Showcasing this set of slides titled marketing kpi accomplishment rate graph mockup pdf. The topics addressed in these templates are marketing kpi accomplishment rate graph. All the content presented in this PPT design is completely editable. Download it and make adjustments in color, background, font etc. as per your unique business setting.
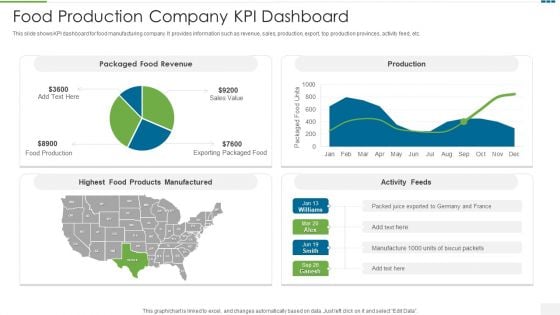
Food Production Company KPI Dashboard Formats PDF
This slide shows KPI dashboard for food manufacturing company. It provides information such as revenue, sales, production, export, top production provinces, activity feed, etc.Showcasing this set of slides titled food production company kpi dashboard formats pdf The topics addressed in these templates are food production company kpi dashboard All the content presented in this PPT design is completely editable. Download it and make adjustments in color, background, font etc. as per your unique business setting.
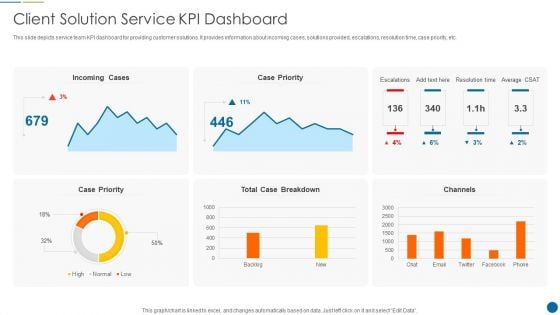
Client Solution Service Kpi Dashboard Sample PDF
This slide depicts service team KPI dashboard for providing customer solutions. It provides information about incoming cases, solutions provided, escalations, resolution time, case priority, etc. Showcasing this set of slides titled Client Solution Service Kpi Dashboard Sample PDF. The topics addressed in these templates are Client Solution Service KPI Dashboard. All the content presented in this PPT design is completely editable. Download it and make adjustments in color, background, font etc. as per your unique business setting

Customer Need Assessment Kpi Dashboard Infographics PDF
The following slide highlights the spas to assess customers changing needs and make strategies to improve. It consists of NPS, responses, weekly variations in needs, positive and negative feedback etc. Showcasing this set of slides titled customer need assessment kpi dashboard infographics pdf. The topics addressed in these templates are customer need assessment kpi dashboard. All the content presented in this PPT design is completely editable. Download it and make adjustments in color, background, font etc. as per your unique business setting.
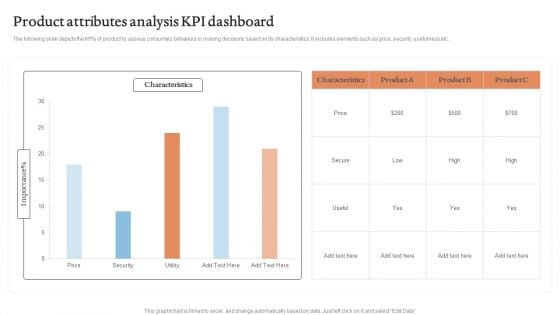
Product Attributes Analysis KPI Dashboard Graphics PDF
The following slide depicts the KPIs of product to assess consumers behaviour in making decisions based on its characteristics. It includes elements such as price, security, usefulness etc.Showcasing this set of slides titled Product Attributes Analysis KPI Dashboard Graphics PDF. The topics addressed in these templates are Characteristics, Product Attributes, Analysis KPI Dashboard. All the content presented in this PPT design is completely editable. Download it and make adjustments in color, background, font etc. as per your unique business setting.

ITIL Incident Regulation Kpi Dashboard Background PDF
This slide covers ITIL problem management KPI dashboard to track status of problems. It involves KPI such as total number of incidents, problems, requests, average time to solve incidents.Pitch your topic with ease and precision using this ITIL Incident Regulation Kpi Dashboard Background PDF. This layout presents information on Active Problems, Average Incidents, Opened Problems. It is also available for immediate download and adjustment. So, changes can be made in the color, design, graphics or any other component to create a unique layout.
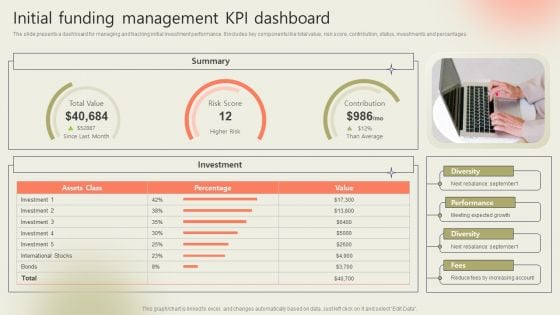
Initial Funding Management Kpi Dashboard Rules PDF
The slide presents a dashboard for managing and tracking initial investment performance. It includes key components like total value, risk score, contribution, status, investments and percentages. Pitch your topic with ease and precision using this Initial Funding Management Kpi Dashboard Rules PDF. This layout presents information on Performance, Diversity, Expected Growth. It is also available for immediate download and adjustment. So, changes can be made in the color, design, graphics or any other component to create a unique layout.
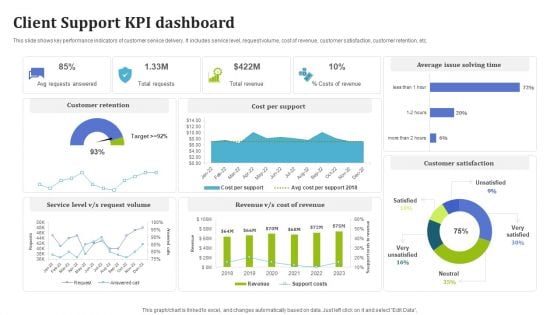
Client Support KPI Dashboard Rules PDF
This slide shows key performance indicators of customer service delivery. It includes service level, request volume, cost of revenue, customer satisfaction, customer retention, etc. Pitch your topic with ease and precision using this Client Support KPI Dashboard Rules PDF. This layout presents information on Customer Retention, Cost Per Support, Average Issue Solving Time. It is also available for immediate download and adjustment. So, changes can be made in the color, design, graphics or any other component to create a unique layout.

KPI Dashboard Showcasing Product Management Guidelines PDF
This slide showcases dashboard providing product development team performance status with determined KPIs. It provides details such as product development team score, average result scores and result KPIs. Pitch your topic with ease and precision using this KPI Dashboard Showcasing Product Management Guidelines PDF. This layout presents information on Average Rating, Innovation, Design. It is also available for immediate download and adjustment. So, changes can be made in the color, design, graphics or any other component to create a unique layout.
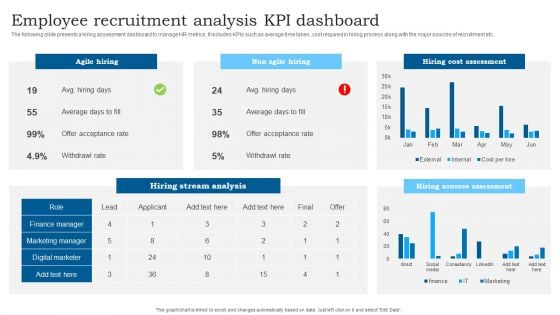
Employee Recruitment Analysis KPI Dashboard Slides PDF
The following slide presents a hiring assessment dashboard to manage HR metrics. It includes KPIs such as average time taken, cost required in hiring process along with the major sources of recruitment etc. Pitch your topic with ease and precision using this Employee Recruitment Analysis KPI Dashboard Slides PDF. This layout presents information on Agile Hiring, Non Agile Hiring, Hiring Cost Assessment. It is also available for immediate download and adjustment. So, changes can be made in the color, design, graphics or any other component to create a unique layout.
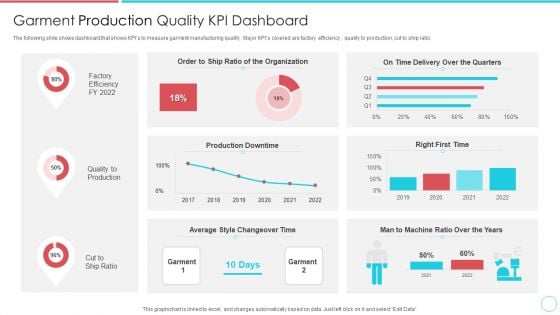
Garment Production Quality KPI Dashboard Portrait PDF
The following slide shows dashboard that shows KPIs to measure garment manufacturing quality . Major KPIs covered are factory efficiency , quality to production, cut to ship ratio.Pitch your topic with ease and precision using this Garment Production Quality KPI Dashboard Portrait PDF This layout presents information on Production Downtime, Time Delivery Over The Quarters, Average Style Changeover Time It is also available for immediate download and adjustment. So, changes can be made in the color, design, graphics or any other component to create a unique layout.
Tracking Goals Alignment KPI Dashboard Guidelines PDF
This slide showcases a tracking dashboard for determining the alignment and progress percentage of the assigned objectives. It also includes the objective evaluation KPIs such as active objectives, overall progress, total employees, objective as per employees, aligned, organizational and departmental objectives. Pitch your topic with ease and precision using this Tracking Goals Alignment KPI Dashboard Guidelines PDF. This layout presents information on Employee, Organizational Objectives, Departmental Objectives. It is also available for immediate download and adjustment. So, changes can be made in the color, design, graphics or any other component to create a unique layout.
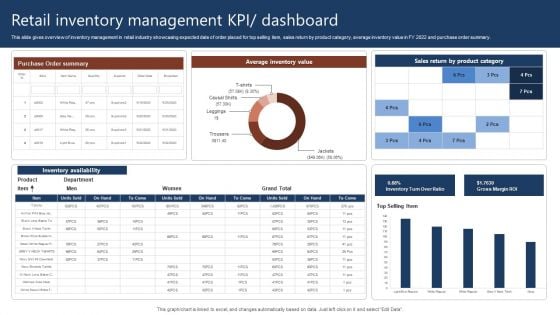
Retail Inventory Management Kpi Dashboard Rules PDF
This slide gives overview of inventory management in retail industry showcasing expected date of order placed for top selling item, sales return by product category, average inventory value in FY 2022 and purchase order summary. Pitch your topic with ease and precision using this Retail Inventory Management Kpi Dashboard Rules PDF. This layout presents information on Retail Inventory Management, Dashboard. It is also available for immediate download and adjustment. So, changes can be made in the color, design, graphics or any other component to create a unique layout.
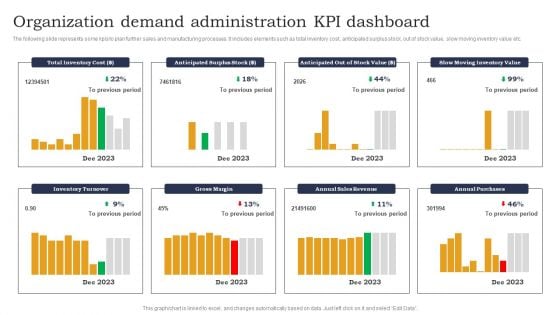
Organization Demand Administration KPI Dashboard Designs PDF
The following slide represents some kpis to plan further sales and manufacturing processes. It includes elements such as total inventory cost, anticipated surplus stock, out of stock value, slow moving inventory value etc. Pitch your topic with ease and precision using this Organization Demand Administration KPI Dashboard Designs PDF. This layout presents information on Anticipated Surplus Stock, Out Of Stock, Slow Moving Inventory. It is also available for immediate download and adjustment. So, changes can be made in the color, design, graphics or any other component to create a unique layout.
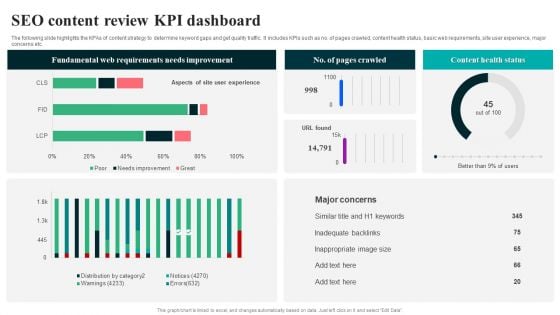
SEO Content Review KPI Dashboard Summary PDF
The following slide highlights the KPAs of content strategy to determine keyword gaps and get quality traffic. It includes KPIs such as no. of pages crawled, content health status, basic web requirements, site user experience, major concerns etc. Pitch your topic with ease and precision using this SEO Content Review KPI Dashboard Summary PDF. This layout presents information on Fundamental Web Requirements, Needs Improvement. It is also available for immediate download and adjustment. So, changes can be made in the color, design, graphics or any other component to create a unique layout.
Project Error Tracking KPI Dashboard Themes PDF
This slide illustrates the dashboard for the project issue tracking and management. It includes the column chart for issues assignee, incomplete issues by priority and project, monthly percentage increase in issues created and closed, etc. Pitch your topic with ease and precision using this Project Error Tracking KPI Dashboard Themes PDF. This layout presents information on Issues Assignee, Issue Status, Incomplete Issues. It is also available for immediate download and adjustment. So, changes can be made in the color, design, graphics or any other component to create a unique layout.
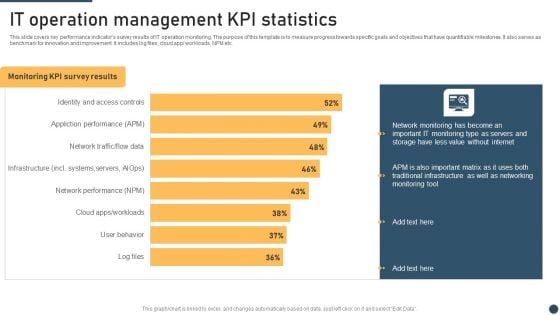
It Operation Management Kpi Statistics Graphics PDF
This slide covers key performance indicators survey results of IT operation monitoring. The purpose of this template is to measure progress towards specific goals and objectives that have quantifiable milestones. It also serves as benchmark for innovation and improvement. It includes log files, cloud app workloads, NPM etc. Showcasing this set of slides titled It Operation Management Kpi Statistics Graphics PDF. The topics addressed in these templates are KPI Statistics, Management, Network Monitoring. All the content presented in this PPT design is completely editable. Download it and make adjustments in color, background, font etc. as per your unique business setting.

Sales Employee Kpi Progress Evaluation Ideas Pdf
This slide showcase performance indicators for progress review which helps in improving employee engagement and achieving results faster. It include indicators such as number of sales, conversion rate, lead generation and client acquisition rate. Pitch your topic with ease and precision using this Sales Employee Kpi Progress Evaluation Ideas Pdf This layout presents information on Meeting Conversion Rate, Conversion Rate, Lead Generation It is also available for immediate download and adjustment. So, changes can be made in the color, design, graphics or any other component to create a unique layout. This slide showcase performance indicators for progress review which helps in improving employee engagement and achieving results faster. It include indicators such as number of sales, conversion rate, lead generation and client acquisition rate.
KPI Dashboard Metrics Security Icon Download PDF
Persuade your audience using this KPI Dashboard Metrics Security Icon Download PDF. This PPT design covers two stages, thus making it a great tool to use. It also caters to a variety of topics including Kpi Dashboard, Metrics Security Icon. Download this PPT design now to present a convincing pitch that not only emphasizes the topic but also showcases your presentation skills.
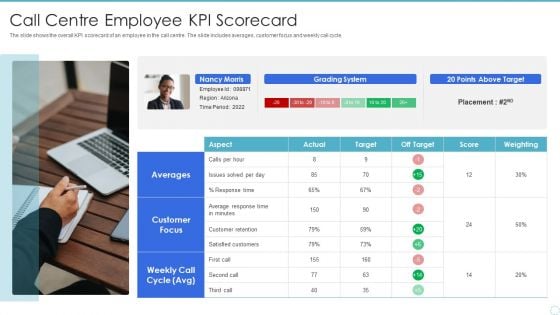
Call Centre Employee KPI Scorecard Information PDF
The slide shows the overall KPI scorecard of an employee in the call centre. The slide includes averages, customer focus and weekly call cycle. Persuade your audience using this Call Centre Employee KPI Scorecard Information PDF. This PPT design covers one stages, thus making it a great tool to use. It also caters to a variety of topics including Customer Focus, Customer Retention, Satisfied Customers. Download this PPT design now to present a convincing pitch that not only emphasizes the topic but also showcases your presentation skills.
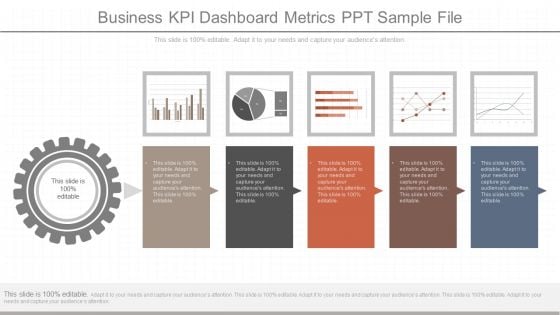
Business Kpi Dashboard Metrics Ppt Sample File
This is a business kpi dashboard metrics ppt sample file. This is a five stage process. The stages in this process are business, finance, management, success, marketing, presentation.
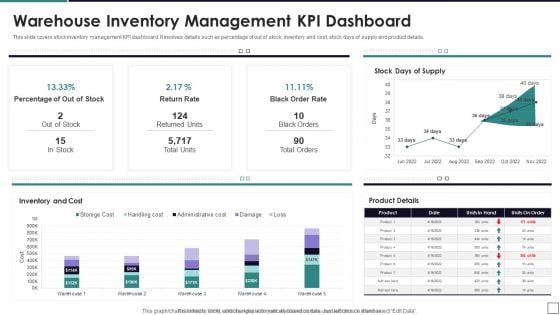
Warehouse Inventory Management KPI Dashboard Information PDF
This slide covers stock inventory management KPI dashboard. It involves details such as percentage of out of stock, inventory and cost, stock days of supply and product details. Showcasing this set of slides titled Warehouse Inventory Management KPI Dashboard Information PDF. The topics addressed in these templates are Inventory And Cost, Return Rate, Out Of Stock. All the content presented in this PPT design is completely editable. Download it and make adjustments in color, background, font etc. as per your unique business setting.
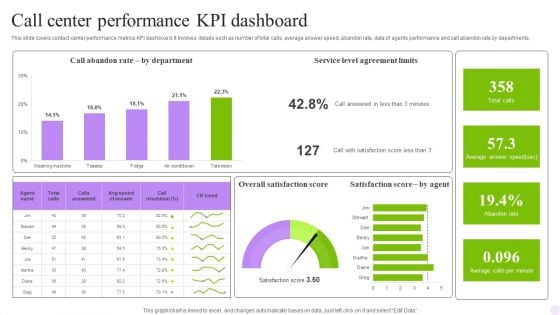
Call Center Performance KPI Dashboard Formats PDF
This slide covers contact center performance metrics KPI dashboard. It involves details such as number of total calls, average answer speed, abandon rate, data of agents performance and call abandon rate by departments. Showcasing this set of slides titled Call Center Performance KPI Dashboard Formats PDF. The topics addressed in these templates are Department, Dashboard, Agreement Limits. All the content presented in this PPT design is completely editable. Download it and make adjustments in color, background, font etc. as per your unique business setting.
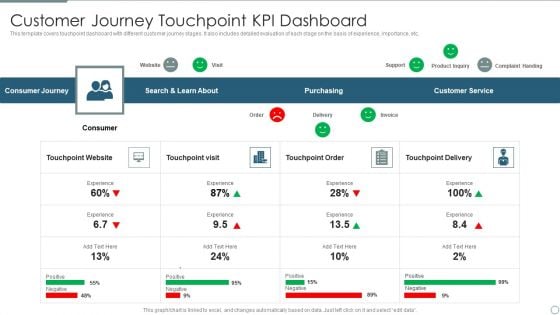
Customer Journey Touchpoint Kpi Dashboard Slides PDF
This template covers touchpoint dashboard with different customer journey stages. It also includes detailed evaluation of each stage on the basis of experience, importance, etc. Showcasing this set of slides titled Customer Journey Touchpoint Kpi Dashboard Slides PDF. The topics addressed in these templates are Purchasing, Customer Service, Consumer Journey. All the content presented in this PPT design is completely editable. Download it and make adjustments in color, background, font etc. as per your unique business setting.
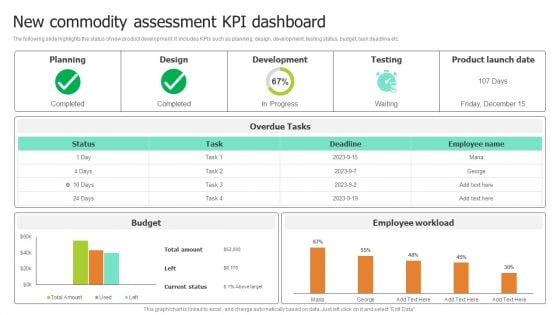
New Commodity Assessment Kpi Dashboard Pictures PDF
The following slide highlights the status of new product development. It includes KPIs such as planning, design, development, testing status, budget, task deadline etc.Showcasing this set of slides titled New Commodity Assessment Kpi Dashboard Pictures PDF. The topics addressed in these templates are Development, Product Launch Date, Overdue Tasks. All the content presented in this PPT design is completely editable. Download it and make adjustments in color, background, font etc. as per your unique business setting.

KPI Dashboard Highlighting Business Problems Microsoft PDF
This slide depicts a dashboard which highlights the problems faced by organizations to easily track the issues and offer solutions for the same. The various key performance indicators in this dashboard are pain points by status, unresolved pain points for march 2023 etc. Showcasing this set of slides titled KPI Dashboard Highlighting Business Problems Microsoft PDF. The topics addressed in these templates are Unresolved Pain Points, Resolved Pain Points, Project Components. All the content presented in this PPT design is completely editable. Download it and make adjustments in color, background, font etc. as per your unique business setting.
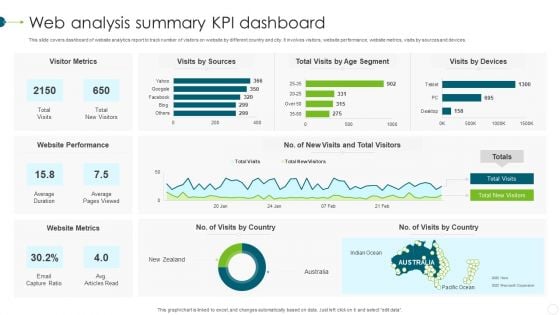
Web Analysis Summary KPI Dashboard Template PDF
This slide covers dashboard of website analytics report to track number of visitors on website by different country and city. It involves visitors, website performance, website metrics, visits by sources and devices. Showcasing this set of slides titled Web Analysis Summary KPI Dashboard Template PDF. The topics addressed in these templates are Website Metrics, Website Performance, Visitor Metrics. All the content presented in this PPT design is completely editable. Download it and make adjustments in color, background, font etc. as per your unique business setting.
Investment Project Prioritization KPI Dashboard Icons PDF
This slide covers project management dashboard for ranking and filtering capital projects. It also include KPIs such as top projects by NPV, top projects by IRR, investor amount, return amount, etc. Showcasing this set of slides titled Investment Project Prioritization KPI Dashboard Icons PDF. The topics addressed in these templates are Project Performance, Top Project NPV, Top Project IRR. All the content presented in this PPT design is completely editable. Download it and make adjustments in color, background, font etc. as per your unique business setting.

Logistics KPI Status Dashboard With Monthly KPI Ppt Infographic Template Layout PDF
The following slide highlights the transportation status dashboard with monthly KPI illustrating order status with customer, order date and delivery date. It shows financial performance for four quarters as well as todays order, inventory and monthly KPI with Inventory, shipping cost for past 30 days. Pitch your topic with ease and precision using this Logistics KPI Status Dashboard With Monthly KPI Ppt Infographic Template Layout PDF. This layout presents information on Order Status, Today Order, Inventory, Monthly KPI. It is also available for immediate download and adjustment. So, changes can be made in the color, design, graphics or any other component to create a unique layout.
KPI Dashboard Showcasing Product Management Progress Status Themes PDF
Presenting KPI Dashboard Showcasing Product Management Progress Status Themes PDF to dispense important information. This template comprises three stages. It also presents valuable insights into the topics including Product Management, KPI Dashboard Showcasing. This is a completely customizable PowerPoint theme that can be put to use immediately. So, download it and address the topic impactfully.
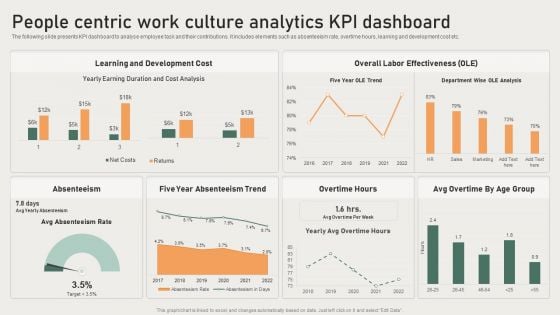
People Centric Work Cuture Analytics Kpi Dashboard Brochure PDF
The following slide presents KPI dashboard to analyse employee task and their contributions. It includes elements such as absenteeism rate, overtime hours, learning and development cost etc. Showcasing this set of slides titled People Centric Work Cuture Analytics Kpi Dashboard Brochure PDF. The topics addressed in these templates are Development Cost, Overall Labor Effectiveness, Absenteeism. All the content presented in this PPT design is completely editable. Download it and make adjustments in color, background, font etc. as per your unique business setting.
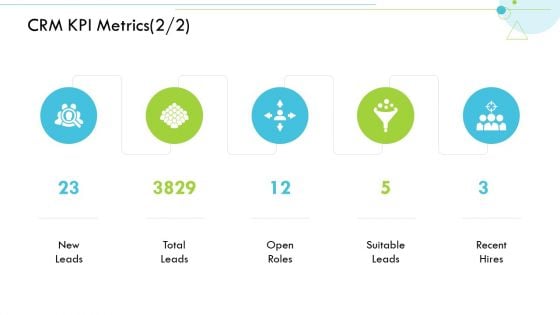
CRM KPI Metrics Suitable Customer Relationship Management CRM Mockup PDF
Presenting crm kpi metrics suitable customer relationship management crm mockup pdf to provide visual cues and insights. Share and navigate important information on five stages that need your due attention. This template can be used to pitch topics like crm kpi metrics. In addtion, this PPT design contains high resolution images, graphics, etc, that are easily editable and available for immediate download.
International Logistics KPI Carrier Dashboard Icon Ppt Icon Gallery PDF
Presenting International Logistics KPI Carrier Dashboard Icon Ppt Icon Gallery PDF to dispense important information. This template comprises four stages. It also presents valuable insights into the topics including International Logistics, KPI Carrier, Dashboard Icon. This is a completely customizable PowerPoint theme that can be put to use immediately. So, download it and address the topic impactfully.

 Home
Home