Procurement Dashboard
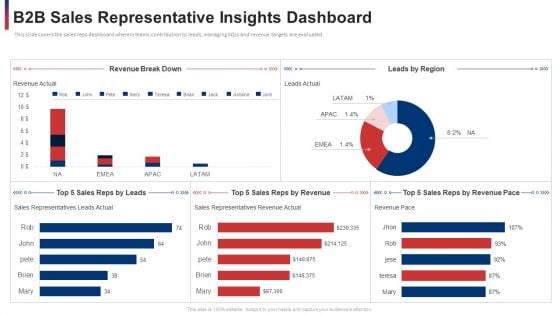
B2b Sales Representative Insights Dashboard Sample PDF
Deliver and pitch your topic in the best possible manner with this b2b sales representative insights dashboard sample pdf. Use them to share invaluable insights on sales representative insights dashboardThis slide covers the sales reps dashboard wherein teams contribution to leads, managing SQLs and revenue targets are evaluated. and impress your audience. This template can be altered and modified as per your expectations. So, grab it now.
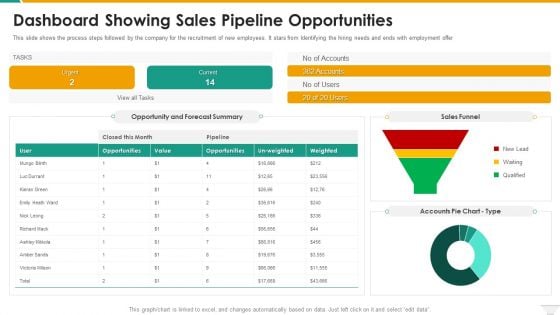
Dashboard Showing Sales Pipeline Opportunities Microsoft PDF
This slide shows the process steps followed by the company for the recruitment of new employees. It stars from Identifying the hiring needs and ends with employment offer. Deliver and pitch your topic in the best possible manner with this Dashboard Showing Sales Pipeline Opportunities Microsoft PDF. Use them to share invaluable insights on Dashboard Showing Sales Pipeline Opportunities and impress your audience. This template can be altered and modified as per your expectations. So, grab it now.
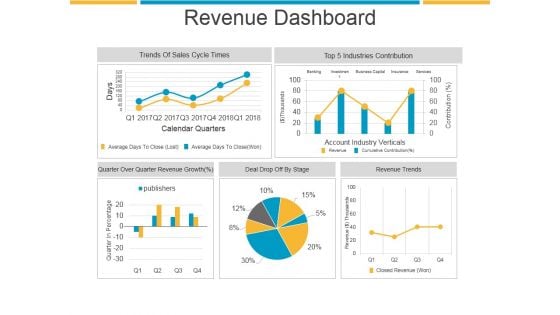
Revenue Dashboard Ppt PowerPoint Presentation Sample
This is a revenue dashboard ppt powerpoint presentation sample. This is a five stage process. The stages in this process are trends of sales cycle times, industries contribution, revenue trends, deal drop off by stage.
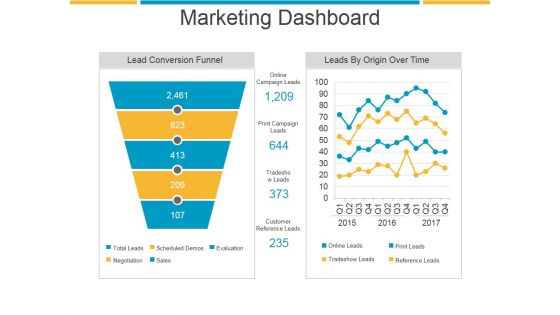
Marketing Dashboard Ppt PowerPoint Presentation Show
This is a marketing dashboard ppt powerpoint presentation show. This is a five stage process. The stages in this process are lead conversion funnel, leads by origin over time.
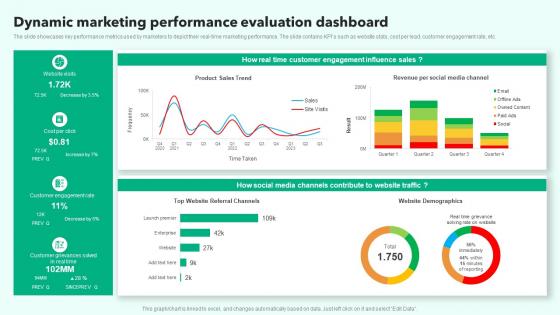
Dynamic Marketing Performance Evaluation Dashboard Microsoft Pdf
The slide showcases key performance metrics used by marketers to depict their real time marketing performance. The slide contains KPIs such as website stats, cost per lead, customer engagement rate, etc. Pitch your topic with ease and precision using this Dynamic Marketing Performance Evaluation Dashboard Microsoft Pdf. This layout presents information on Influence Sales, Customer Engagement, Customer Engagement Rate. It is also available for immediate download and adjustment. So, changes can be made in the color, design, graphics or any other component to create a unique layout. The slide showcases key performance metrics used by marketers to depict their real time marketing performance. The slide contains KPIs such as website stats, cost per lead, customer engagement rate, etc.
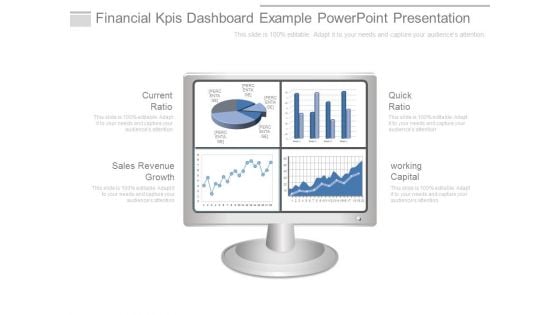
Financial Kpis Dashboard Example Powerpoint Presentation
This is a financial kpis dashboard example powerpoint presentation. This is a four stage process. The stages in this process are current ratio, sales revenue growth, quick ratio, working capital.
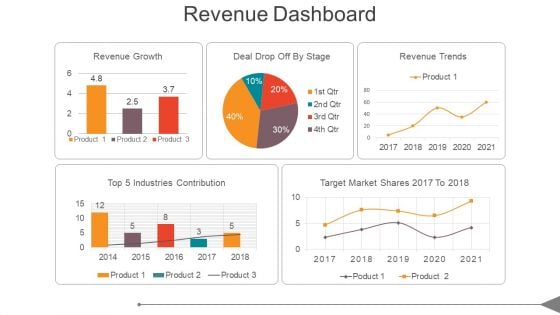
Revenue Dashboard Ppt PowerPoint Presentation Show
This is a revenue dashboard ppt powerpoint presentation show. This is a five stage process. The stages in this process are top 5 industries contribution, revenue growth, deal drop off by stage, revenue trends, target market shares 2017 to 2018.
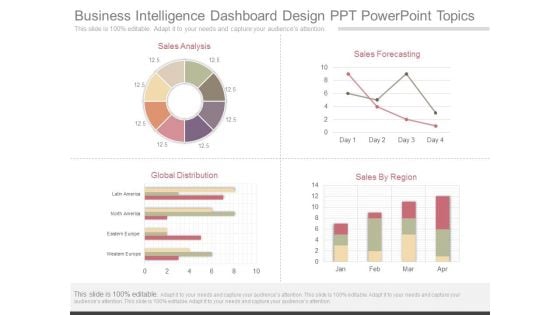
Business Intelligence Dashboard Design Ppt Powerpoint Topics
This is a business intelligence dashboard design ppt powerpoint topics. This is a four stage process. The stages in this process are sales analysis, sales forecasting, global distribution, sales by region, latin america, north america, eastern europe, western europe.
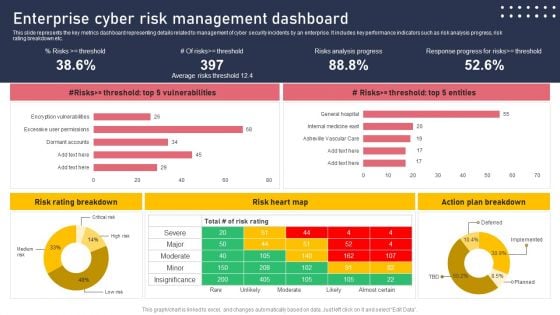
Enterprise Cyber Risk Management Dashboard Sample PDF
This slide represents the key metrics dashboard representing details related to management of cyber security incidents by an enterprise. It includes key performance indicators such as risk analysis progress, risk rating breakdown etc. There are so many reasons you need a Enterprise Cyber Risk Management Dashboard Sample PDF. The first reason is you cannot spend time making everything from scratch, Thus, Slidegeeks has made presentation templates for you too. You can easily download these templates from our website easily.
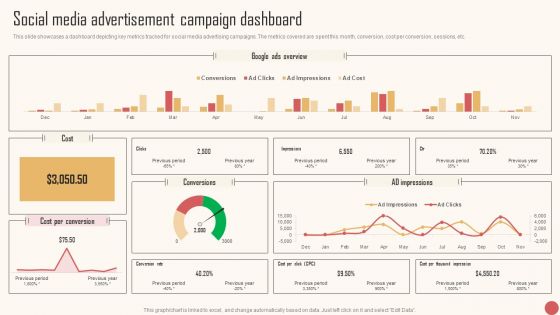
Social Media Advertisement Campaign Dashboard Themes PDF
This slide showcases a dashboard depicting key metrics tracked for social media advertising campaigns. The metrics covered are spent this month, conversion, cost per conversion, sessions, etc. There are so many reasons you need a Social Media Advertisement Campaign Dashboard Themes PDF. The first reason is you can not spend time making everything from scratch, Thus, Slidegeeks has made presentation templates for you too. You can easily download these templates from our website easily.

B2B Prospects Performance Measurement Dashboard Ideas PDF
This slide provides information regarding B2B performance tracking dashboard to measure leads, MQL, SQL, customers, revenue goals, total media spend. Deliver an awe inspiring pitch with this creative b2b prospects performance measurement dashboard ideas pdf bundle. Topics like ineffective in managing requirements, essential points are catered, understanding of company can be discussed with this completely editable template. It is available for immediate download depending on the needs and requirements of the user.
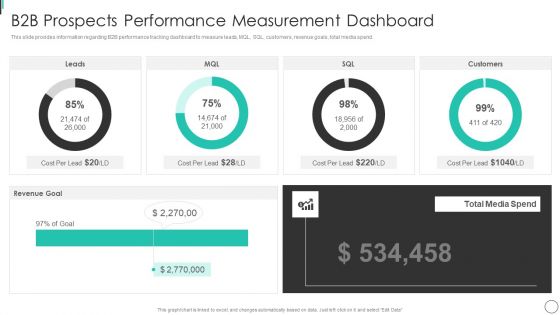
B2B Prospects Performance Measurement Dashboard Guidelines PDF
This slide provides information regarding B2B performance tracking dashboard to measure leads, MQL, SQL, customers, revenue goals, total media spend. Deliver an awe inspiring pitch with this creative B2B Prospects Performance Measurement Dashboard Guidelines PDF bundle. Topics like Customers, Leads, Revenue Goal can be discussed with this completely editable template. It is available for immediate download depending on the needs and requirements of the user.
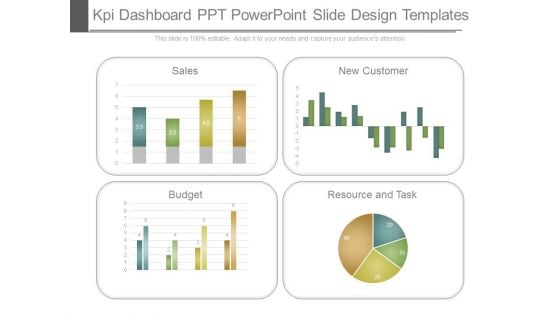
Kpi Dashboard Ppt Powerpoint Slide Design Templates
This is a kpi dashboard ppt powerpoint slide design templates. This is a four stage process. The stages in this process are sales, new customer, budget, resource and task.

Constructive Destructive Customer Feedback Dashboard Designs PDF
This slide shows statistics about weekly number of favorable and unfavorable customer responses with overall email sentiment score. It further includes details about daily deals, special discounts, newsletter and renewal reminders. Showcasing this set of slides titled Constructive Destructive Customer Feedback Dashboard Designs PDF. The topics addressed in these templates are Previous Week, Current Week, Dashboard. All the content presented in this PPT design is completely editable. Download it and make adjustments in color, background, font etc. as per your unique business setting.
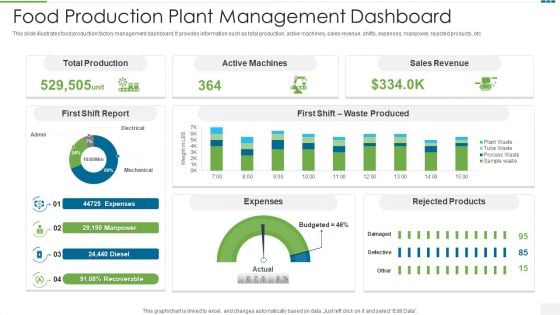
Food Production Plant Management Dashboard Clipart PDF
This slide illustrates food production factory management dashboard. It provides information such as total production, active machines, sales revenue, shifts, expenses, manpower, rejected products, etc.Pitch your topic with ease and precision using this food production plant management dashboard clipart pdf This layout presents information on total production, active machines, sales revenue It is also available for immediate download and adjustment. So, changes can be made in the color, design, graphics or any other component to create a unique layout.
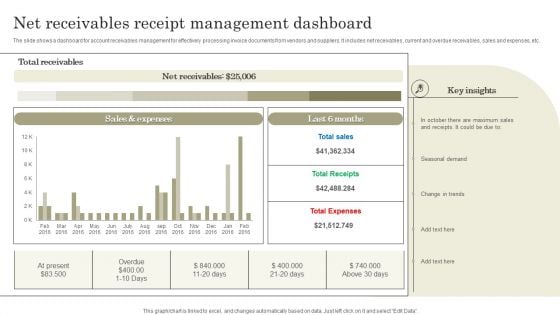
Net Receivables Receipt Management Dashboard Information PDF
The slide shows a dashboard for account receivables management for effectively processing invoice documents from vendors and suppliers. It includes net receivables, current and overdue receivables, sales and expenses, etc. Showcasing this set of slides titled Net Receivables Receipt Management Dashboard Information PDF. The topics addressed in these templates are Total sales, Total Receipts, Total Expenses. All the content presented in this PPT design is completely editable. Download it and make adjustments in color, background, font etc. as per your unique business setting.
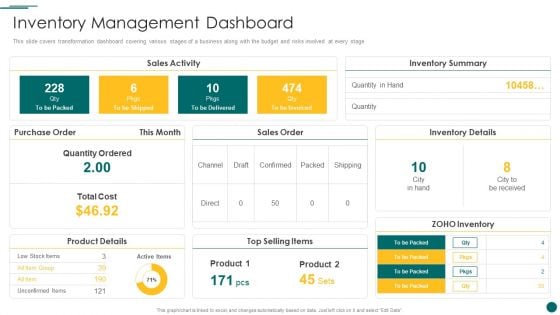
Organization Reinvention Inventory Management Dashboard Microsoft PDF
This slide covers transformation dashboard covering various stages of a business along with the budget and risks involved at every stage Deliver an awe inspiring pitch with this creative Organization Reinvention Inventory Management Dashboard Microsoft PDF bundle. Topics like Sales Activity, Inventory Summary, Inventory Details can be discussed with this completely editable template. It is available for immediate download depending on the needs and requirements of the user.
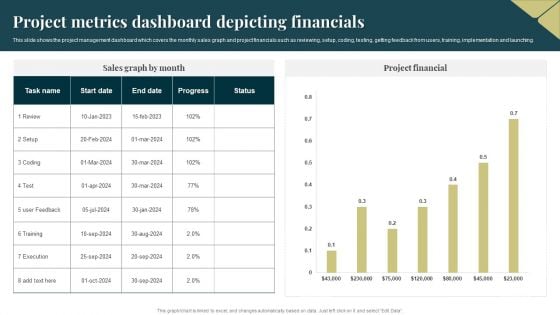
Project Metrics Dashboard Depicting Financials Pictures PDF
This slide shows the project management dashboard which covers the monthly sales graph and project financials such as reviewing, setup, coding, testing, getting feedback from users, training, implementation and launching. Pitch your topic with ease and precision using this Project Metrics Dashboard Depicting Financials Pictures PDF. This layout presents information on Execution, Project Financial. It is also available for immediate download and adjustment. So, changes can be made in the color, design, graphics or any other component to create a unique layout.
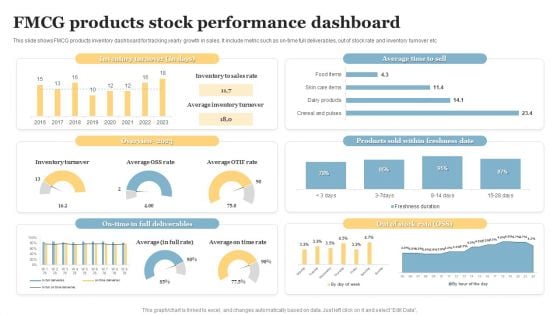
FMCG Products Stock Performance Dashboard Pictures PDF
This slide shows FMCG products inventory dashboard for tracking yearly growth in sales. It include metric such as on-time full deliverables, out of stock rate and inventory turnover etc. Showcasing this set of slides titled FMCG Products Stock Performance Dashboard Pictures PDF. The topics addressed in these templates are Inventory Turnover, Products Sold, Freshness Date. All the content presented in this PPT design is completely editable. Download it and make adjustments in color, background, font etc. as per your unique business setting.
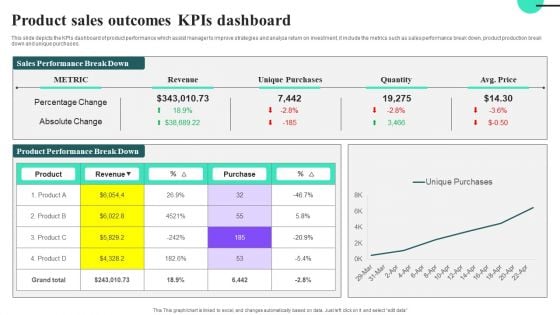
Product Sales Outcomes Kpis Dashboard Ideas PDF
This slide depicts the KPIs dashboard of product performance which assist manager to improve strategies and analyze return on investment, it include the metrics such as sales performance break down, product production break down and unique purchases.Showcasing this set of slides titled Product Sales Outcomes Kpis Dashboard Ideas PDF. The topics addressed in these templates are Percentage Change, Absolute Change. All the content presented in this PPT design is completely editable. Download it and make adjustments in color, background, font etc. as per your unique business setting.
Overall Brand Performance Tracking Dashboard Microsoft PDF
This slide provides information regarding brand performance tracking dashboard capturing KPIs such as brand metric, brand commitment, advertising metrics, and purchase metrics. Slidegeeks is here to make your presentations a breeze with Overall Brand Performance Tracking Dashboard Microsoft PDF With our easy to use and customizable templates, you can focus on delivering your ideas rather than worrying about formatting. With a variety of designs to choose from, you are sure to find one that suits your needs. And with animations and unique photos, illustrations, and fonts, you can make your presentation pop. So whether you are giving a sales pitch or presenting to the board, make sure to check out Slidegeeks first.
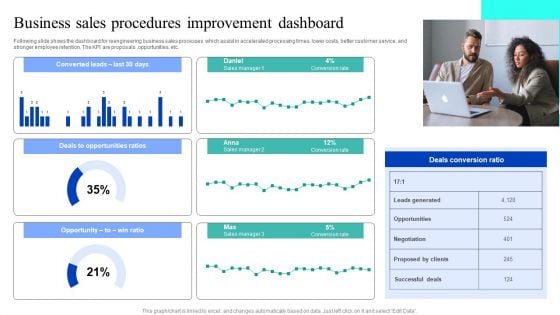
Business Sales Procedures Improvement Dashboard Designs PDF
Following slide shows the dashboard for reengineering business sales processes which assist in accelerated processing times, lower costs, better customer service, and stronger employee retention. The KPI are proposals ,opportunities, etc. Pitch your topic with ease and precision using this Business Sales Procedures Improvement Dashboard Designs PDF. This layout presents information on Deals Opportunities Ratios, Opportunity, Deals Conversion Ratio. It is also available for immediate download and adjustment. So, changes can be made in the color, design, graphics or any other component to create a unique layout.
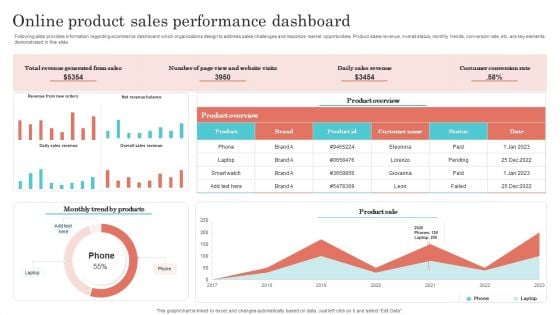
Online Product Sales Performance Dashboard Designs PDF
Following slide provides information regarding ecommerce dashboard which organizations design to address sales challenges and maximize market opportunities. Product sales revenue, overall status, monthly trends, conversion rate, etc. are key elements demonstrated in this slide. Showcasing this set of slides titled Online Product Sales Performance Dashboard Designs PDF. The topics addressed in these templates are Revenue Generated From Sales, Daily Sales Revenue, Costumer Conversion Rate. All the content presented in this PPT design is completely editable. Download it and make adjustments in color, background, font etc. as per your unique business setting.
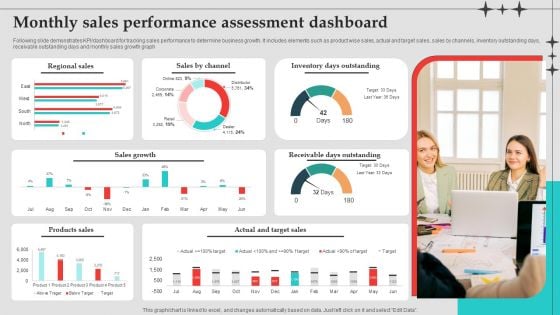
Monthly Sales Performance Assessment Dashboard Download PDF
Following slide demonstrates KPI or dashboard for tracking sales performance to determine business growth. It includes elements such as product wise sales, actual and target sales, sales by channels, inventory outstanding days, receivable outstanding days and monthly sales growth graph. Showcasing this set of slides titled Monthly Sales Performance Assessment Dashboard Download PDF. The topics addressed in these templates are Sales Growth, Inventory Days Outstanding, Target Sales. All the content presented in this PPT design is completely editable. Download it and make adjustments in color, background, font etc. as per your unique business setting.
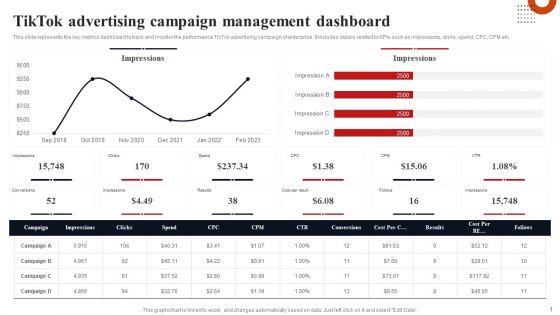
Tiktok Advertising Campaign Management Dashboard Pictures PDF
This slide represents the key metrics dashboard to track and monitor the performance TikTok advertising campaign of enterprise. It includes details related to KPIs such as impressions, clicks, spend, CPC, CPM etc. Crafting an eye catching presentation has never been more straightforward. Let your presentation shine with this tasteful yet straightforward Tiktok Advertising Campaign Management Dashboard Pictures PDF template. It offers a minimalistic and classy look that is great for making a statement. The colors have been employed intelligently to add a bit of playfulness while still remaining professional. Construct the ideal Tiktok Advertising Campaign Management Dashboard Pictures PDF that effortlessly grabs the attention of your audience Begin now and be certain to wow your customers.
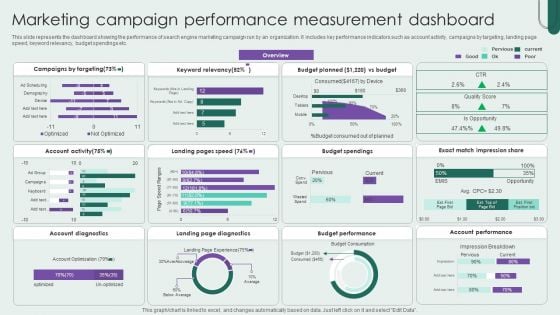
Marketing Campaign Performance Measurement Dashboard Download PDF
This slide represents the dashboard showing the performance of search engine marketing campaign run by an organization. It includes key performance indicators such as account activity, campaigns by targeting, landing page speed, keyword relevancy, budget spendings etc. Showcasing this set of slides titled Marketing Campaign Performance Measurement Dashboard Download PDF. The topics addressed in these templates are Keyword Relevancy, Campaigns By Targeting, Budget. All the content presented in this PPT design is completely editable. Download it and make adjustments in color, background, font etc. as per your unique business setting.
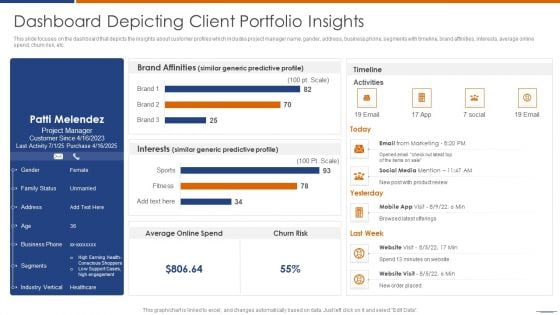
Dashboard Depicting Client Portfolio Insights Template PDF
This slide focuses on the dashboard that depicts the insights about customer profiles which includes project manager name, gander, address, business phone, segments with timeline, brand affinities, interests, average online spend, churn risk, etc.Showcasing this set of slides titled Dashboard Depicting Client Portfolio Insights Template PDF The topics addressed in these templates are Brand Affinities, Interests Similar, Average Spend All the content presented in this PPT design is completely editable. Download it and make adjustments in color, background, font etc. as per your unique business setting.
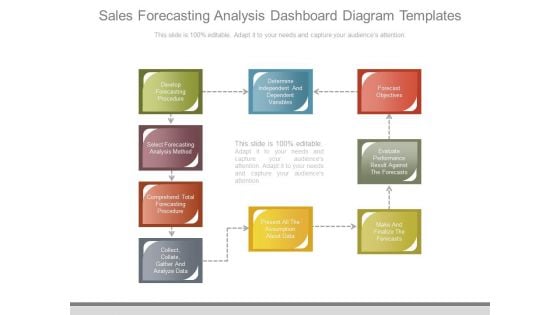
Sales Forecasting Analysis Dashboard Diagram Templates
This is a sales forecasting analysis dashboard diagram templates. This is a nine stage process. The stages in this process are develop forecasting procedure, select forecasting analysis method, comprehend total forecasting procedure, collect collate gather and analyze data, determine independent and dependent variables, present all the assumption about data, forecast objectives, evaluate performance result against the forecasts, make and finalize the forecasts.
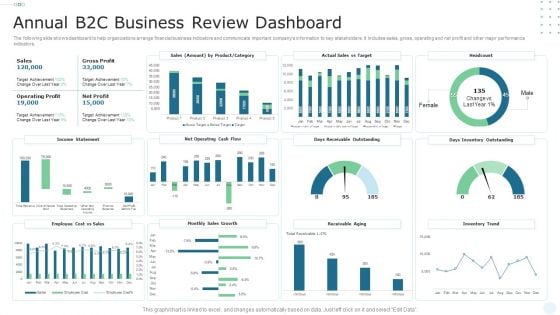
Annual B2C Business Review Dashboard Microsoft PDF
The following slide shows dashboard to help organizations arrange financial business indicators and communicate important companys information to key stakeholders. It includes sales, gross, operating and net profit and other major performance indicators. Showcasing this set of slides titled Annual B2C Business Review Dashboard Microsoft PDF. The topics addressed in these templates are Gross Profit, Sales, Operating Profit. All the content presented in this PPT design is completely editable. Download it and make adjustments in color, background, font etc. as per your unique business setting.
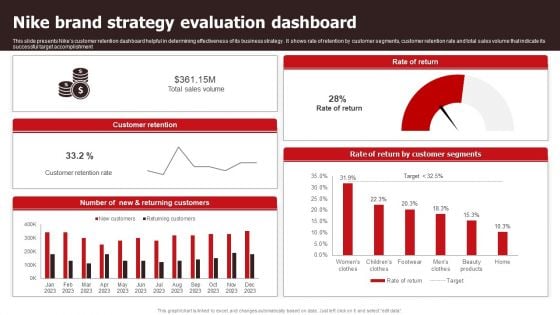
Nike Brand Strategy Evaluation Dashboard Sample PDF
This slide presents Nikes customer retention dashboard helpful in determining effectiveness of its business strategy . It shows rate of retention by customer segments, customer retention rate and total sales volume that indicate its successful target accomplishment. Showcasing this set of slides titled Nike Brand Strategy Evaluation Dashboard Sample PDF. The topics addressed in these templates are Sales Volume, Customer Retention Rate . All the content presented in this PPT design is completely editable. Download it and make adjustments in color, background, font etc. as per your unique business setting.
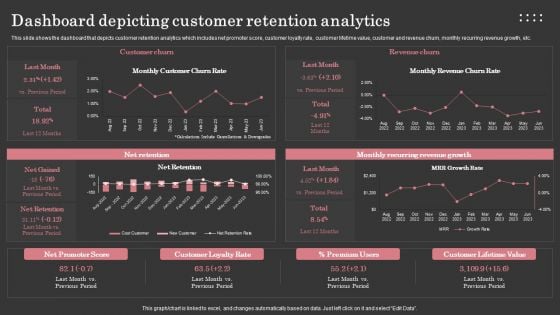
Dashboard Depicting Customer Retention Analytics Background PDF
This slide shows the dashboard that depicts customer retention analytics which includes net promoter score, customer loyalty rate, customer lifetime value, customer and revenue churn, monthly recurring revenue growth, etc. Make sure to capture your audiences attention in your business displays with our gratis customizable Dashboard Depicting Customer Retention Analytics Background PDF. These are great for business strategies, office conferences, capital raising or task suggestions. If you desire to acquire more customers for your tech business and ensure they stay satisfied, create your own sales presentation with these plain slides.
Tracking Customer Sales Funnel Dashboard Professional PDF
This slide covers information regarding the customer sales funnel tracking with sales volume and total market. Deliver an awe inspiring pitch with this creative Tracking Customer Sales Funnel Dashboard Professional PDF bundle. Topics like Total Market, Sales Volume, Product can be discussed with this completely editable template. It is available for immediate download depending on the needs and requirements of the user.
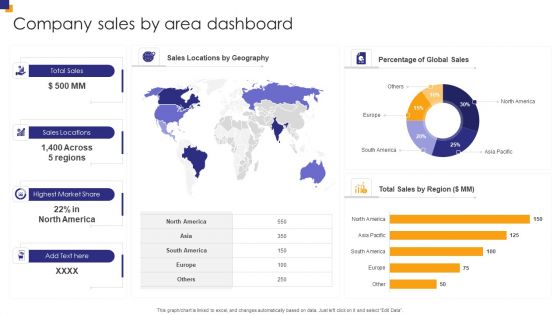
Company Sales By Area Dashboard Infographics PDF
Pitch your topic with ease and precision using this Company Sales By Area Dashboard Infographics PDF. This layout presents information on Total Sales, Sales Locations, Highest Market. It is also available for immediate download and adjustment. So, changes can be made in the color, design, graphics or any other component to create a unique layout.
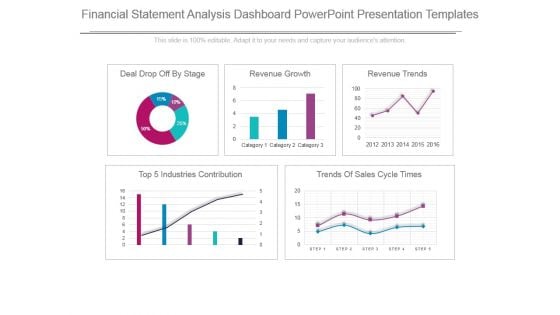
Financial Statement Analysis Dashboard Powerpoint Presentation Templates
This is a financial statement analysis dashboard powerpoint presentation templates. This is a five stage process. The stages in this process are deal drop off by stage, revenue growth, revenue trends, top 5 industries contribution, trends of sales cycle times, category.
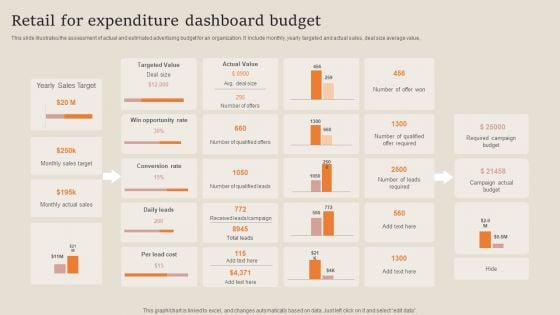
Retail For Expenditure Dashboard Budget Designs PDF
This slide illustrates the assessment of actual and estimated advertising budget for an organization. It include monthly, yearly targeted and actual sales, deal size average value, Showcasing this set of slides titled Retail For Expenditure Dashboard Budget Designs PDF. The topics addressed in these templates are Sales Target, Opportunity Rate, Required Campaign Budget. All the content presented in this PPT design is completely editable. Download it and make adjustments in color, background, font etc. as per your unique business setting.

Dashboard Ppt PowerPoint Presentation Ideas Graphics Pictures
Presenting this set of slides with name dashboard ppt powerpoint presentation ideas graphics pictures. The topics discussed in these slides are ytd sales vs yr sm, net sales vs last yr sm, net sales vs last yr sm. This is a completely editable PowerPoint presentation and is available for immediate download. Download now and impress your audience.
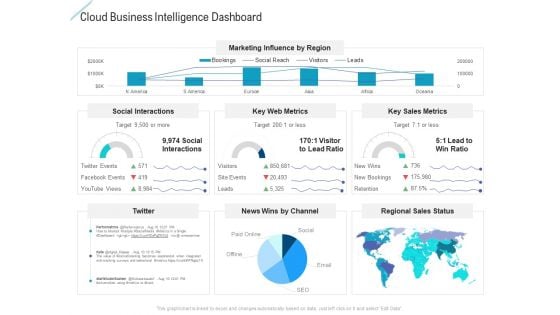
Cloud Business Intelligence Dashboard Graphics PDF
Deliver and pitch your topic in the best possible manner with this cloud business intelligence dashboard graphics pdf. Use them to share invaluable insights on social interactions, key web metrics, key sales metrics and impress your audience. This template can be altered and modified as per your expectations. So, grab it now.
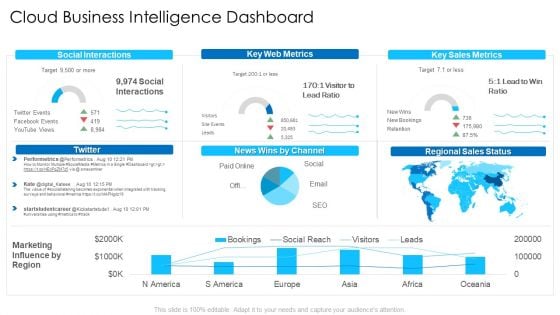
Cloud Business Intelligence Dashboard Microsoft PDF
Deliver an awe inspiring pitch with this creative cloud business intelligence dashboard microsoft pdf bundle. Topics like social interactions, key web metrics, regional sales status can be discussed with this completely editable template. It is available for immediate download depending on the needs and requirements of the user.
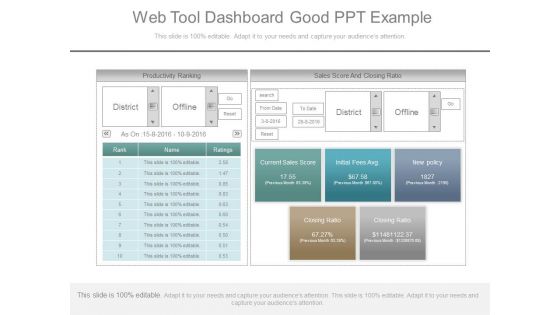
Web Tool Dashboard Good Ppt Example
This is a web tool dashboard good ppt example. This is a two stage process. The stages in this process are productivity ranking, district, offline, go, reset, rank, name, ratings, sales score and closing ratio, search, from date, to date, current sales score, initial fees avg, new policy, previous month, closing ratio, as on.

Balance Scorecard Index Dashboard Ppt Slides
This is a balance scorecard index dashboard ppt slides. This is a one stage process. The stages in this process are sales by month, gross revenue, customer retention, executive scorecard, measures, status, trend, financial, option, customer, internal processes, learning and growth.
Product Sales Performance Tracking Dashboard Introduction PDF
This slide provides information regarding dashboard utilized by firm to monitor sales performance of products offered. The performance is tracked through revenues generated, online vs offline purchases, cost of goods sold, etc. Are you in need of a template that can accommodate all of your creative concepts This one is crafted professionally and can be altered to fit any style. Use it with Google Slides or PowerPoint. Include striking photographs, symbols, depictions, and other visuals. Fill, move around, or remove text boxes as desired. Test out color palettes and font mixtures. Edit and save your work, or work with colleagues. Download Product Sales Performance Tracking Dashboard Introduction PDF and observe how to make your presentation outstanding. Give an impeccable presentation to your group and make your presentation unforgettable.
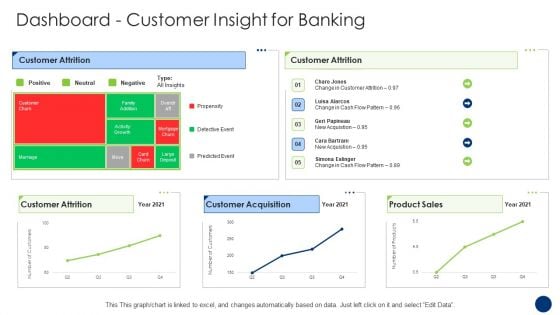
Dashboard Customer Insight For Banking Brochure PDF
Deliver and pitch your topic in the best possible manner with this dashboard customer insight for banking brochure pdf. Use them to share invaluable insights on customer attrition, customer acquisition, product sales and impress your audience. This template can be altered and modified as per your expectations. So, grab it now.
Compensation Management Operations Dashboard Icons PDF
Deliver and pitch your topic in the best possible manner with this compensation management operations dashboard icons pdf. Use them to share invaluable insights on compensation per sale, compensation per plan, compensation per plan, top 10, compensation per component with rank and impress your audience. This template can be altered and modified as per your expectations. So, grab it now.

Compensation Management Operations Dashboard Guidelines PDF
Deliver and pitch your topic in the best possible manner with this compensation management operations dashboard guidelines pdf. Use them to share invaluable insights on sale, plan and impress your audience. This template can be altered and modified as per your expectations. So, grab it now.
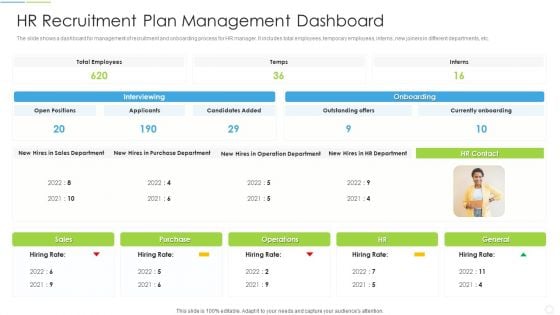
HR Recruitment Plan Management Dashboard Graphics PDF
Showcasing this set of slides titled HR Recruitment Plan Management Dashboard Graphics PDF The topics addressed in these templates are Interviewing, Currently Onboarding, Sales Department All the content presented in this PPT design is completely editable. Download it and make adjustments in color, background, font etc. as per your unique business setting.
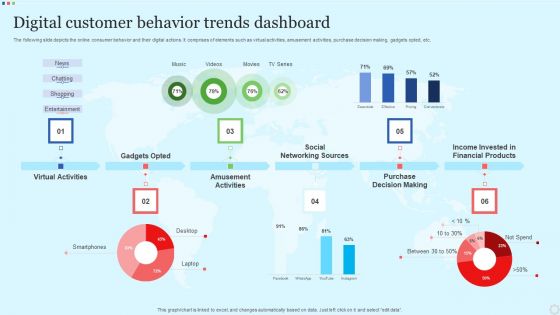
Digital Customer Behavior Trends Dashboard Slides PDF
The following slide depicts the online consumer behavior and their digital actions. It comprises of elements such as virtual activities, amusement activities, purchase decision making, gadgets opted, etc. Showcasing this set of slides titled Digital Customer Behavior Trends Dashboard Slides PDF. The topics addressed in these templates are Virtual Activities, Gadgets Opted, Amusement Activities. All the content presented in this PPT design is completely editable. Download it and make adjustments in color, background, font etc. as per your unique business setting.
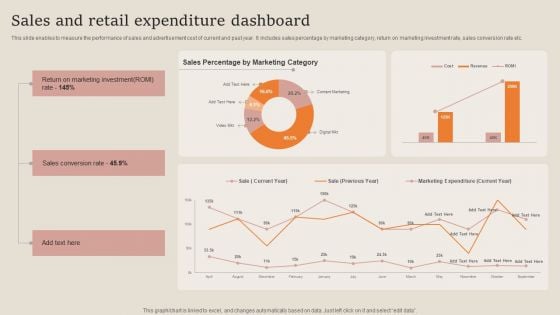
Sales And Retail Expenditure Dashboard Guidelines PDF
This slide enables to measure the performance of sales and advertisement cost of current and past year. It includes sales percentage by marketing category, return on marketing investment rate, sales conversion rate etc. Pitch your topic with ease and precision using this Sales And Retail Expenditure Dashboard Guidelines PDF. This layout presents information on Sales Conversion Rate, Marketing Investment. It is also available for immediate download and adjustment. So, changes can be made in the color, design, graphics or any other component to create a unique layout.
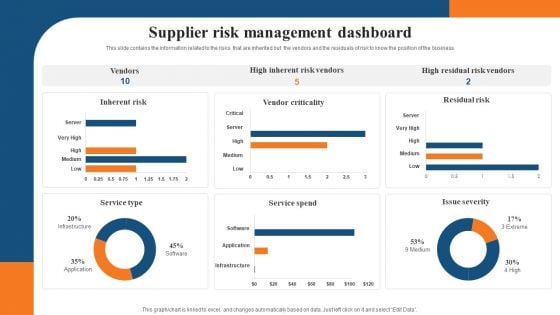
Supplier Risk Management Dashboard Introduction PDF
This slide contains the information related to the risks that are inherited but the vendors and the residuals of risk to know the position of the business. Showcasing this set of slides titled Supplier Risk Management Dashboard Introduction PDF. The topics addressed in these templates are Service Spend, Inherent Risk, Risk Vendors. All the content presented in this PPT design is completely editable. Download it and make adjustments in color, background, font etc. as per your unique business setting.
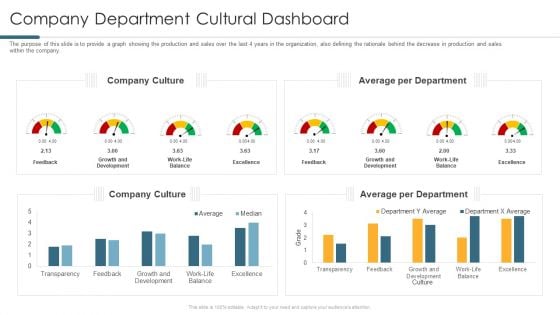
Company Department Cultural Dashboard Formats PDF
The purpose of this slide is to provide a graph showing the production and sales over the last 4 years in the organization, also defining the rationale behind the decrease in production and sales within the company. Deliver an awe inspiring pitch with this creative company department cultural dashboard formats pdf bundle. Topics like average per department, company culture can be discussed with this completely editable template. It is available for immediate download depending on the needs and requirements of the user.
Monthly Retail Stock Performance Dashboard Icons PDF
This slide shows monthly inventory performance of retail products for analyzing monthly in stock an out-stock with their values. It include metrics like current inventory available, current inventory value and closing monthly stock etc. Showcasing this set of slides titled Monthly Retail Stock Performance Dashboard Icons PDF. The topics addressed in these templates are Current Inventory Available, Current Inventory Value. All the content presented in this PPT design is completely editable. Download it and make adjustments in color, background, font etc. as per your unique business setting.
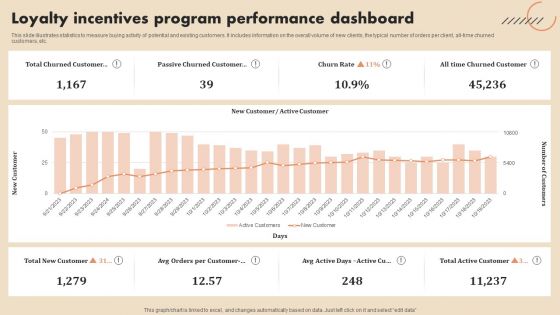
Loyalty Incentives Program Performance Dashboard Microsoft PDF
This slide illustrates statistics to measure buying activity of potential and existing customers. It includes information on the overall volume of new clients, the typical number of orders per client, all time churned customers, etc.Showcasing this set of slides titled Loyalty Incentives Program Performance Dashboard Microsoft PDF. The topics addressed in these templates are Total Churned Customer, Passive Churned Customer. All the content presented in this PPT design is completely editable. Download it and make adjustments in color, background, font etc. as per your unique business setting.
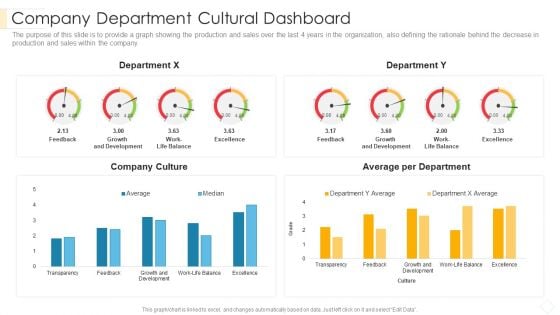
Company Department Cultural Dashboard Pictures PDF
The purpose of this slide is to provide a graph showing the production and sales over the last 4 years in the organization, also defining the rationale behind the decrease in production and sales within the company.Deliver an awe inspiring pitch with this creative company department cultural dashboard pictures pdf bundle. Topics like company culture, average per department, growth and development can be discussed with this completely editable template. It is available for immediate download depending on the needs and requirements of the user.
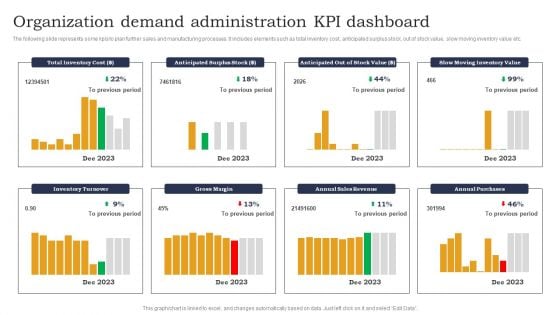
Organization Demand Administration KPI Dashboard Designs PDF
The following slide represents some kpis to plan further sales and manufacturing processes. It includes elements such as total inventory cost, anticipated surplus stock, out of stock value, slow moving inventory value etc. Pitch your topic with ease and precision using this Organization Demand Administration KPI Dashboard Designs PDF. This layout presents information on Anticipated Surplus Stock, Out Of Stock, Slow Moving Inventory. It is also available for immediate download and adjustment. So, changes can be made in the color, design, graphics or any other component to create a unique layout.
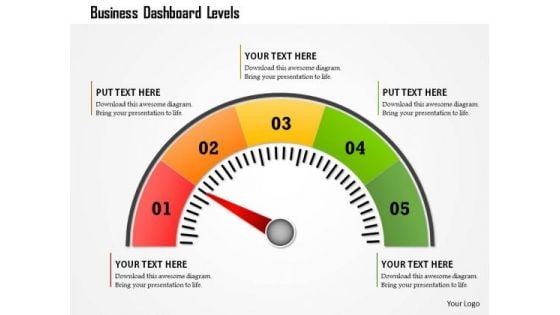
Business Framework Business Dashboard Levels PowerPoint Presentation
This business diagram displays colored meter with multiple levels. Use this diagram to display business process. This diagram can be used to indicate performance measures. This is an excellent diagram to impress your audiences.
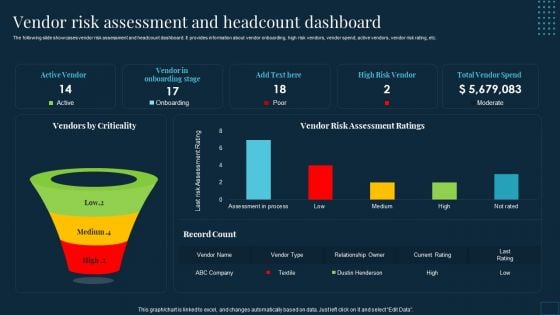
Vendor Management To Handle Purchase Vendor Risk Assessment And Headcount Dashboard Themes PDF
The following slide illustrates supplier procurement cycle and expenses management dashboard. It provides information about conracted, unlisted, top suppliers, spending, savings, procurement cycle time, etc.Deliver an awe inspiring pitch with this creative Vendor Management To Handle Purchase Vendor Risk Assessment And Headcount Dashboard Themes PDF bundle. Topics like Vendor Onboarding, Assessment Ratings, Vendor Spend can be discussed with this completely editable template. It is available for immediate download depending on the needs and requirements of the user.
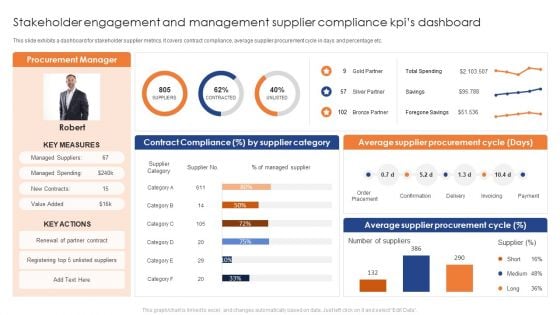
Stakeholder Engagement And Management Supplier Compliance Kpis Dashboard Pictures PDF
This slide exhibits a dashboard for stakeholder supplier metrics. It covers contract compliance, average supplier procurement cycle in days and percentage etc. Showcasing this set of slides titled Stakeholder Engagement And Management Supplier Compliance Kpis Dashboard Pictures PDF. The topics addressed in these templates are Average Supplier Procurement Cycle, Average Supplier Procurement Cycle . All the content presented in this PPT design is completely editable. Download it and make adjustments in color, background, font etc. as per your unique business setting.
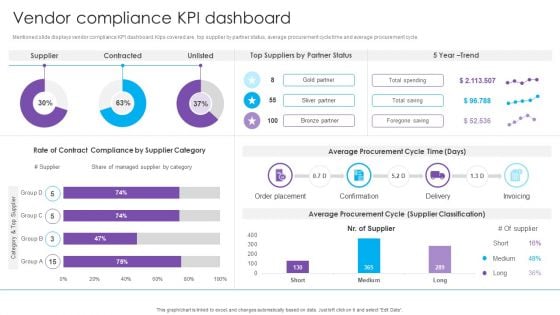
Vendor Compliance KPI Dashboard Real Estate Project Funding Inspiration PDF
Mentioned slide displays vendor compliance KPI dashboard. Kips covered are top supplier by partner status, average procurement cycle time and average procurement cycle.Deliver and pitch your topic in the best possible manner with this Vendor Compliance KPI Dashboard Real Estate Project Funding Inspiration PDF. Use them to share invaluable insights on Contract Compliance, Average Procurement, Order Placement and impress your audience. This template can be altered and modified as per your expectations. So, grab it now.
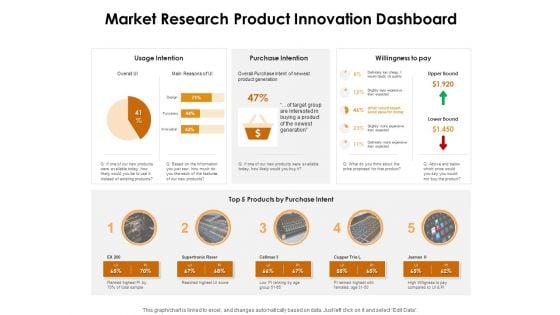
KPI Dashboards Per Industry Market Research Product Innovation Dashboard Ppt PowerPoint Presentation Portfolio Infographic Template PDF
Deliver an awe-inspiring pitch with this creative kpi dashboards per industry market research product innovation dashboard ppt powerpoint presentation portfolio infographic template pdf bundle. Topics like usage intention, purchase intention, willingness to pay, top 5 products purchase intent can be discussed with this completely editable template. It is available for immediate download depending on the needs and requirements of the user.
KPI Dashboards Per Industry Retail Store Dashboard Ppt PowerPoint Presentation Icon Grid PDF
Deliver an awe-inspiring pitch with this creative kpi dashboards per industry retail store dashboard ppt powerpoint presentation icon grid pdf bundle. Topics like total customers and visitors, avg price and units per transaction, out stock items, sales city, top 5 articles by sold items, top 5 articles revenue can be discussed with this completely editable template. It is available for immediate download depending on the needs and requirements of the user.
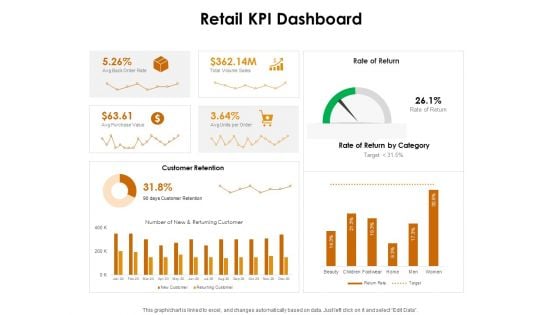
KPI Dashboards Per Industry Retail KPI Dashboard Ppt PowerPoint Presentation Slides Clipart PDF
Deliver an awe-inspiring pitch with this creative kpi dashboards per industry retail kpi dashboard ppt powerpoint presentation slides clipart pdf bundle. Topics like return reasons, top seller orders, perfect order rate, total orders can be discussed with this completely editable template. It is available for immediate download depending on the needs and requirements of the user.

 Home
Home