Procurement Dashboard
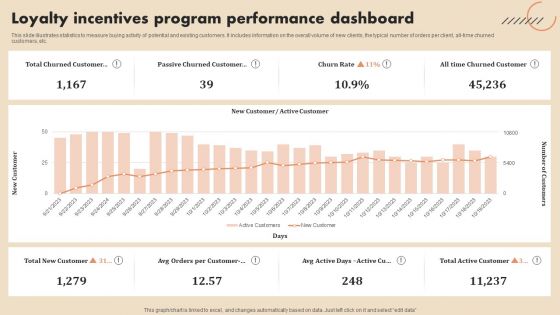
Loyalty Incentives Program Performance Dashboard Microsoft PDF
This slide illustrates statistics to measure buying activity of potential and existing customers. It includes information on the overall volume of new clients, the typical number of orders per client, all time churned customers, etc.Showcasing this set of slides titled Loyalty Incentives Program Performance Dashboard Microsoft PDF. The topics addressed in these templates are Total Churned Customer, Passive Churned Customer. All the content presented in this PPT design is completely editable. Download it and make adjustments in color, background, font etc. as per your unique business setting.
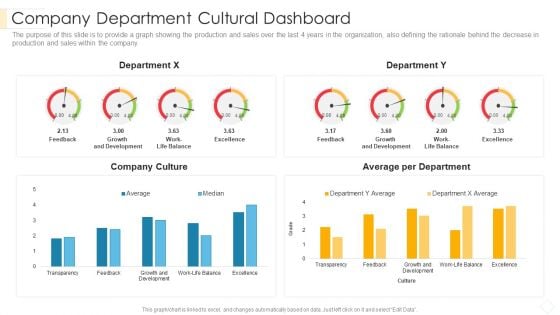
Company Department Cultural Dashboard Pictures PDF
The purpose of this slide is to provide a graph showing the production and sales over the last 4 years in the organization, also defining the rationale behind the decrease in production and sales within the company.Deliver an awe inspiring pitch with this creative company department cultural dashboard pictures pdf bundle. Topics like company culture, average per department, growth and development can be discussed with this completely editable template. It is available for immediate download depending on the needs and requirements of the user.
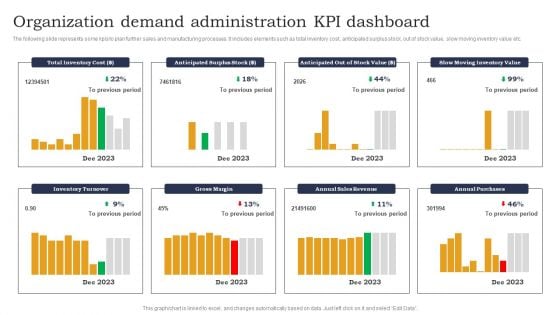
Organization Demand Administration KPI Dashboard Designs PDF
The following slide represents some kpis to plan further sales and manufacturing processes. It includes elements such as total inventory cost, anticipated surplus stock, out of stock value, slow moving inventory value etc. Pitch your topic with ease and precision using this Organization Demand Administration KPI Dashboard Designs PDF. This layout presents information on Anticipated Surplus Stock, Out Of Stock, Slow Moving Inventory. It is also available for immediate download and adjustment. So, changes can be made in the color, design, graphics or any other component to create a unique layout.
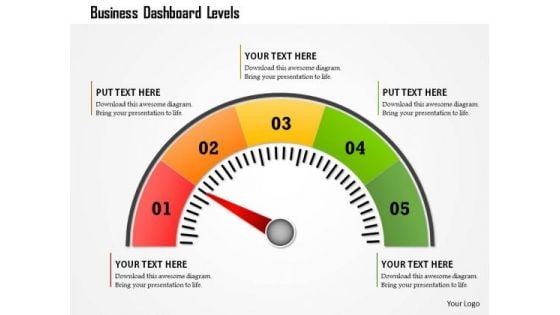
Business Framework Business Dashboard Levels PowerPoint Presentation
This business diagram displays colored meter with multiple levels. Use this diagram to display business process. This diagram can be used to indicate performance measures. This is an excellent diagram to impress your audiences.
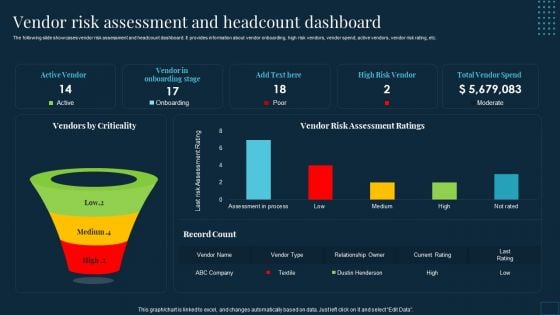
Vendor Management To Handle Purchase Vendor Risk Assessment And Headcount Dashboard Themes PDF
The following slide illustrates supplier procurement cycle and expenses management dashboard. It provides information about conracted, unlisted, top suppliers, spending, savings, procurement cycle time, etc.Deliver an awe inspiring pitch with this creative Vendor Management To Handle Purchase Vendor Risk Assessment And Headcount Dashboard Themes PDF bundle. Topics like Vendor Onboarding, Assessment Ratings, Vendor Spend can be discussed with this completely editable template. It is available for immediate download depending on the needs and requirements of the user.
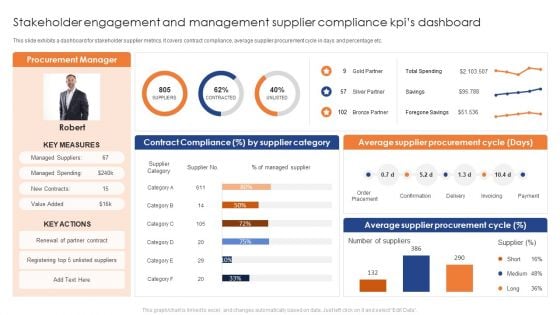
Stakeholder Engagement And Management Supplier Compliance Kpis Dashboard Pictures PDF
This slide exhibits a dashboard for stakeholder supplier metrics. It covers contract compliance, average supplier procurement cycle in days and percentage etc. Showcasing this set of slides titled Stakeholder Engagement And Management Supplier Compliance Kpis Dashboard Pictures PDF. The topics addressed in these templates are Average Supplier Procurement Cycle, Average Supplier Procurement Cycle . All the content presented in this PPT design is completely editable. Download it and make adjustments in color, background, font etc. as per your unique business setting.
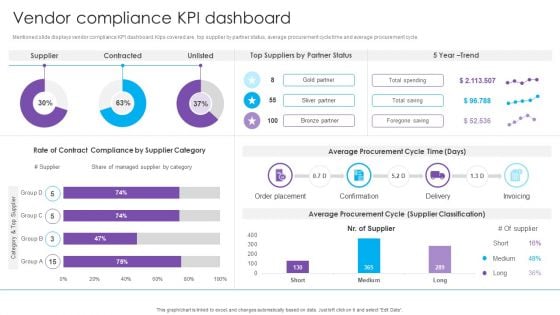
Vendor Compliance KPI Dashboard Real Estate Project Funding Inspiration PDF
Mentioned slide displays vendor compliance KPI dashboard. Kips covered are top supplier by partner status, average procurement cycle time and average procurement cycle.Deliver and pitch your topic in the best possible manner with this Vendor Compliance KPI Dashboard Real Estate Project Funding Inspiration PDF. Use them to share invaluable insights on Contract Compliance, Average Procurement, Order Placement and impress your audience. This template can be altered and modified as per your expectations. So, grab it now.
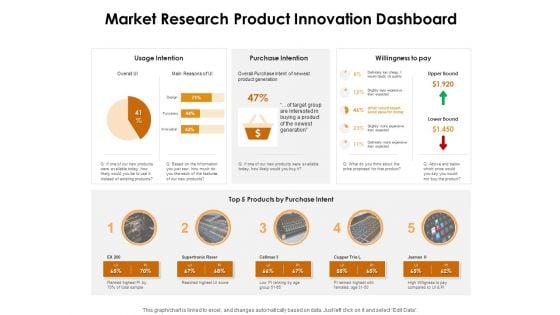
KPI Dashboards Per Industry Market Research Product Innovation Dashboard Ppt PowerPoint Presentation Portfolio Infographic Template PDF
Deliver an awe-inspiring pitch with this creative kpi dashboards per industry market research product innovation dashboard ppt powerpoint presentation portfolio infographic template pdf bundle. Topics like usage intention, purchase intention, willingness to pay, top 5 products purchase intent can be discussed with this completely editable template. It is available for immediate download depending on the needs and requirements of the user.
KPI Dashboards Per Industry Retail Store Dashboard Ppt PowerPoint Presentation Icon Grid PDF
Deliver an awe-inspiring pitch with this creative kpi dashboards per industry retail store dashboard ppt powerpoint presentation icon grid pdf bundle. Topics like total customers and visitors, avg price and units per transaction, out stock items, sales city, top 5 articles by sold items, top 5 articles revenue can be discussed with this completely editable template. It is available for immediate download depending on the needs and requirements of the user.
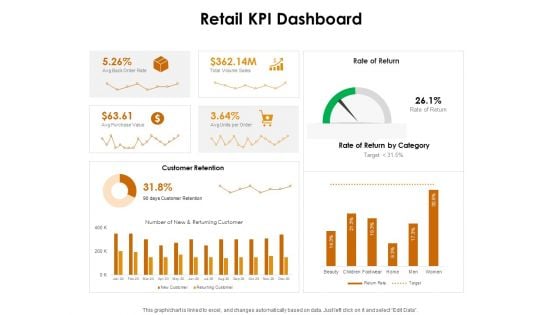
KPI Dashboards Per Industry Retail KPI Dashboard Ppt PowerPoint Presentation Slides Clipart PDF
Deliver an awe-inspiring pitch with this creative kpi dashboards per industry retail kpi dashboard ppt powerpoint presentation slides clipart pdf bundle. Topics like return reasons, top seller orders, perfect order rate, total orders can be discussed with this completely editable template. It is available for immediate download depending on the needs and requirements of the user.
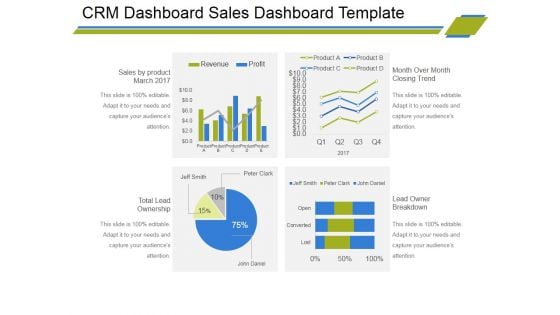
Crm Dashboard Sales Dashboard Template Ppt PowerPoint Presentation Portfolio Master Slide
This is a crm dashboard sales dashboard template ppt powerpoint presentation portfolio master slide. This is a four stage process. The stages in this process are sales by product march, total lead ownership, month over month closing trend, lead owner breakdown.
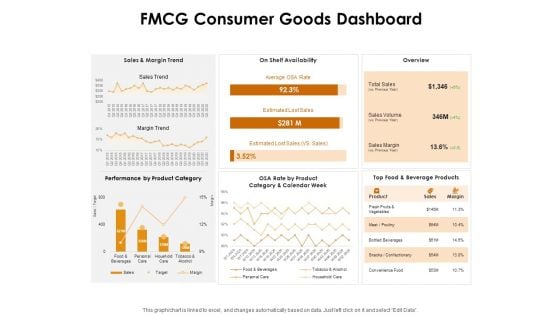
KPI Dashboards Per Industry FMCG Consumer Goods Dashboard Ppt PowerPoint Presentation Infographics Graphics Tutorials PDF
Deliver and pitch your topic in the best possible manner with this kpi dashboards per industry fmcg consumer goods dashboard ppt powerpoint presentation infographics graphics tutorials pdf. Use them to share invaluable insights on sales and margin trend, on shelf availability, overview, performance product category and impress your audience. This template can be altered and modified as per your expectations. So, grab it now.
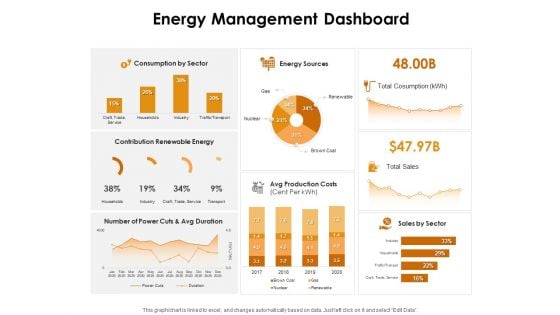
KPI Dashboards Per Industry Energy Management Dashboard Ppt PowerPoint Presentation Infographics Background PDF
Deliver an awe-inspiring pitch with this creative kpi dashboards per industry energy management dashboard ppt powerpoint presentation infographics background pdf bundle. Topics like consumption sector, energy sources, contribution renewable energy, avg production costs, sales sector can be discussed with this completely editable template. It is available for immediate download depending on the needs and requirements of the user.
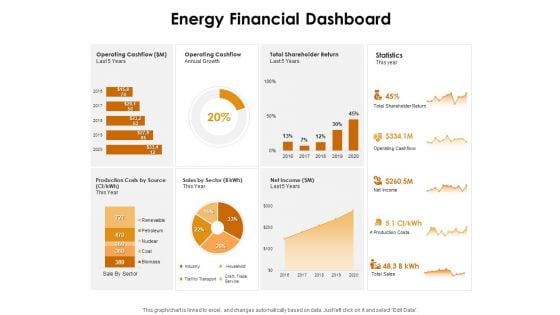
KPI Dashboards Per Industry Energy Financial Dashboard Ppt PowerPoint Presentation Professional Example File PDF
Deliver and pitch your topic in the best possible manner with this kpi dashboards per industry energy financial dashboard ppt powerpoint presentation professional example file pdf. Use them to share invaluable insights on operating cashflow, total shareholder return, production costs source, sales sector, net income and impress your audience. This template can be altered and modified as per your expectations. So, grab it now.
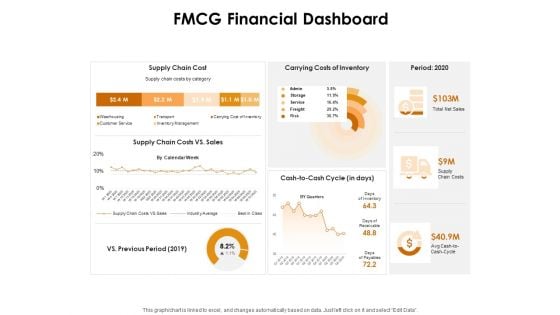
KPI Dashboards Per Industry FMCG Financial Dashboard Ppt PowerPoint Presentation Outline Information PDF
Deliver an awe-inspiring pitch with this creative kpi dashboards per industry fmcg financial dashboard ppt powerpoint presentation outline information pdf bundle. Topics like supply chain cost, carrying costs of inventory, period 2020, supply chain costs vs sales can be discussed with this completely editable template. It is available for immediate download depending on the needs and requirements of the user.

KPI Dashboards Per Industry Logistics Supply Chain Dashboard Ppt PowerPoint Presentation Slides Templates PDF
Deliver and pitch your topic in the best possible manner with this kpi dashboards per industry logistics supply chain dashboard ppt powerpoint presentation slides templates pdf. Use them to share invaluable insights on carrying costs inventory, inventory accuracy, out stock items, inventory sales year and impress your audience. This template can be altered and modified as per your expectations. So, grab it now.
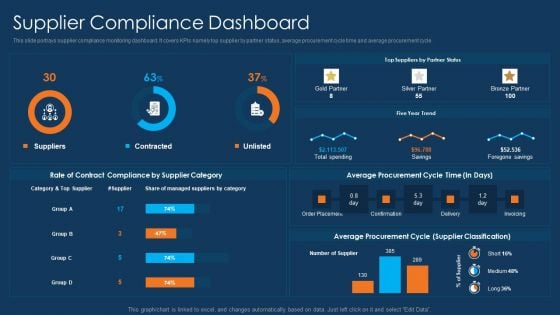
Information Technology Project Initiation Supplier Compliance Dashboard Professional PDF
This slide portrays supplier compliance monitoring dashboard. It covers KPIs namely top supplier by partner status, average procurement cycle time and average procurement cycle. Deliver and pitch your topic in the best possible manner with this information technology project initiation supplier compliance dashboard professional pdf. Use them to share invaluable insights on supplier compliance dashboard and impress your audience. This template can be altered and modified as per your expectations. So, grab it now.
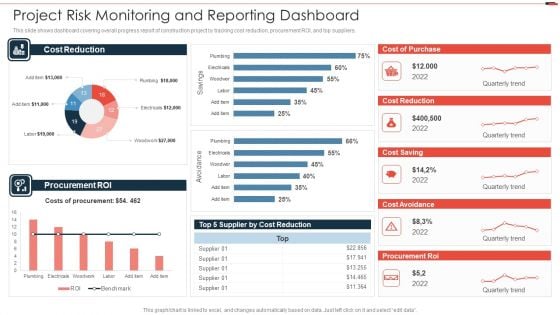
Commercial Property Development Project Risk Monitoring And Reporting Dashboard Slides PDF
This slide shows dashboard covering overall progress report of construction project by tracking cost reduction, procurement ROI, and top suppliers. Deliver an awe inspiring pitch with this creative commercial property development project risk monitoring and reporting dashboard slides pdf bundle. Topics like cost reduction, procurement roi, cost purchase, cost saving can be discussed with this completely editable template. It is available for immediate download depending on the needs and requirements of the user.
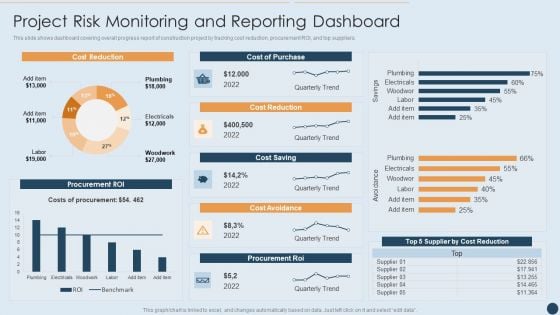
Commercial Real Estate Project Risk Management Project Risk Monitoring And Reporting Dashboard Formats PDF
This slide shows dashboard covering overall progress report of construction project by tracking cost reduction, procurement ROI, and top suppliers. Deliver an awe inspiring pitch with this creative Commercial Real Estate Project Risk Management Project Risk Monitoring And Reporting Dashboard Formats PDF bundle. Topics like Cost Reduction, Procurement Roi, Cost Avoidance can be discussed with this completely editable template. It is available for immediate download depending on the needs and requirements of the user.
Inventory Control Techniques System Performance Tracking Dashboard Demonstration PDF
This slide represents dashboard showcasing supplier performance which helps in improving material control system processes. It provides information regarding supplier statistics, material compliance rate, top raw material suppliers, average material procurement cycle. Showcasing this set of slides titled Inventory Control Techniques System Performance Tracking Dashboard Demonstration PDF. The topics addressed in these templates are Supplier Statistics, Material Compliance Rate, Average Material Procurement. All the content presented in this PPT design is completely editable. Download it and make adjustments in color, background, font etc. as per your unique business setting.
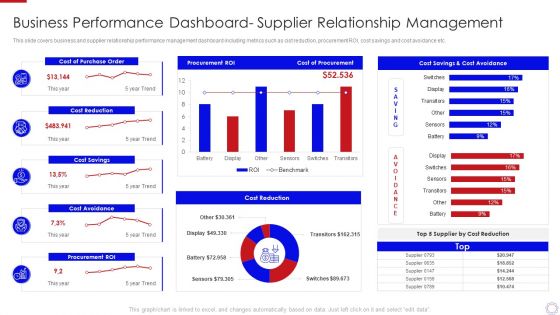
Major Strategies To Nurture Effective Vendor Association Business Performance Dashboard Guidelines PDF
This slide covers business and supplier relationship performance management dashboard including metrics such as cist reduction, procurement ROI, cost savings and cost avoidance etc. Deliver an awe inspiring pitch with this creative major strategies to nurture effective vendor association business performance dashboard guidelines pdf bundle. Topics like business performance dashboard supplier relationship management can be discussed with this completely editable template. It is available for immediate download depending on the needs and requirements of the user.
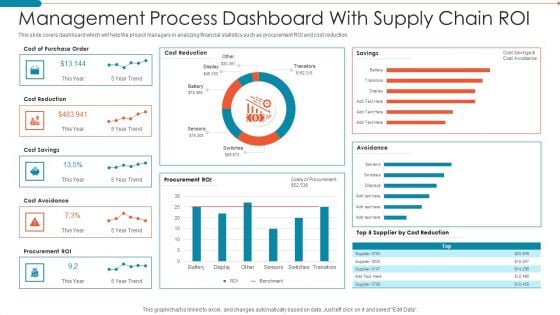
Management Process Dashboard With Supply Chain Roi Professional PDF
This slide covers dashboard which will help the project managers in analyzing financial statistics such as procurement ROI and cost reduction.Pitch your topic with ease and precision using this Management Process Dashboard With Supply Chain Roi Professional PDF. This layout presents information on Management Process Dashboard With Supply Chain Roi. It is also available for immediate download and adjustment. So, changes can be made in the color, design, graphics or any other component to create a unique layout.
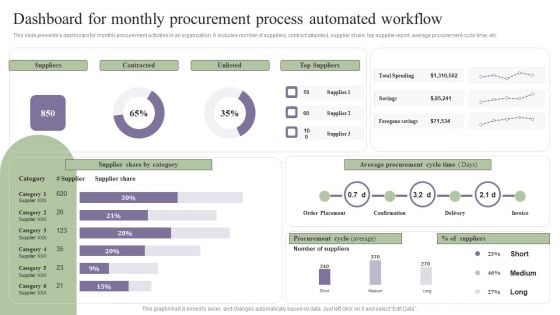
Deployment Of Process Automation To Increase Organisational Performance Dashboard For Monthly Graphics PDF
This slide presents a dashboard for monthly procurement activities in an organization. It includes number of suppliers, contract attainted, supplier share, top supplier report, average procurement cycle time, etc. Here you can discover an assortment of the finest PowerPoint and Google Slides templates. With these templates, you can create presentations for a variety of purposes while simultaneously providing your audience with an eye catching visual experience. Download Deployment Of Process Automation To Increase Organisational Performance Dashboard For Monthly Graphics PDF to deliver an impeccable presentation. These templates will make your job of preparing presentations much quicker, yet still, maintain a high level of quality. Slidegeeks has experienced researchers who prepare these templates and write high quality content for you. Later on, you can personalize the content by editing the Deployment Of Process Automation To Increase Organisational Performance Dashboard For Monthly Graphics PDF.
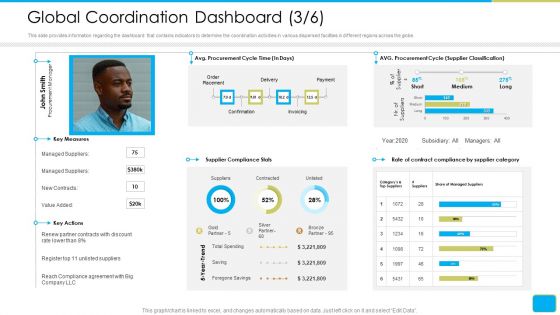
Cross Border Integration In Multinational Corporation Global Coordination Dashboard Time Rules PDF
This slide provides information regarding the dashboard that contains indicators to determine the coordination activities in various dispersed facilities in different regions across the globe. Deliver an awe-inspiring pitch with this creative cross border integration in multinational corporation global coordination dashboard time rules pdf bundle. Topics like avg procurement cycle time, supplier classification, supplier compliance stats can be discussed with this completely editable template. It is available for immediate download depending on the needs and requirements of the user.
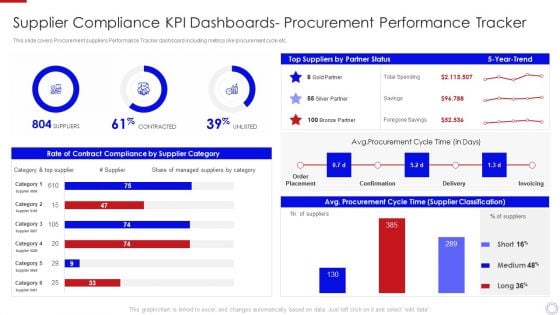
Major Strategies To Nurture Effective Vendor Association Supplier Compliance Kpi Dashboards Rules PDF
This slide covers Procurement suppliers Performance Tracker dashboard including metrics like procurement cycle etc. Deliver an awe inspiring pitch with this creative major strategies to nurture effective vendor association supplier compliance kpi dashboards rules pdf bundle. Topics like supplier compliance kpi dashboards procurement performance tracker can be discussed with this completely editable template. It is available for immediate download depending on the needs and requirements of the user.

KPI Analytics Dashboard With Sourcing Raw Material Cycle Time Inspiration PDF
Following slide shows the key performance indicator KPI dashboard which will assist corporates to effectively monitor procurement process. The metrics are number of suppliers, contract compliance, average procurement cycle time, etc. Showcasing this set of slides titled KPI Analytics Dashboard With Sourcing Raw Material Cycle Time Inspiration PDF. The topics addressed in these templates are Kpi Analytics Dashboard, Sourcing Raw Material, Cycle Time. All the content presented in this PPT design is completely editable. Download it and make adjustments in color, background, font etc. as per your unique business setting.
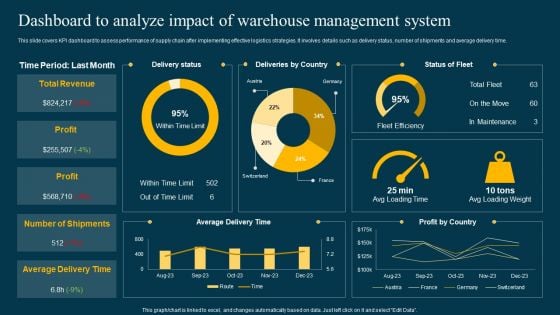
Dashboard To Analyze Impact Of Warehouse Management System Infographics PDF
This slide covers cost analysis for implementing automation procurement tools in logistics and supply chain management. It involves optimization tools, cost involved on monthly basis and its impact on operations. Get a simple yet stunning designed Dashboard To Analyze Impact Of Warehouse Management System Infographics PDF. It is the best one to establish the tone in your meetings. It is an excellent way to make your presentations highly effective. So, download this PPT today from Slidegeeks and see the positive impacts. Our easy-to-edit Dashboard To Analyze Impact Of Warehouse Management System Infographics PDF can be your go-to option for all upcoming conferences and meetings. So, what are you waiting for. Grab this template today.
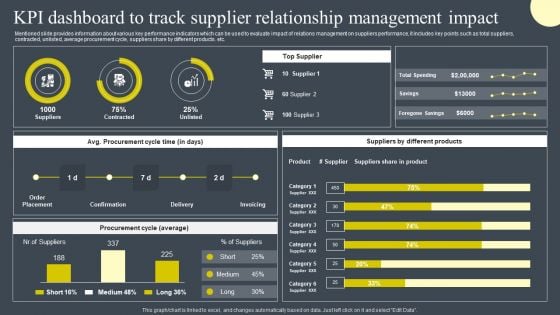
KPI Dashboard To Track Supplier Relationship Management Impact Inspiration PDF
Mentioned slide provides information about various key performance indicators which can be used to evaluate impact of relations management on suppliers performance, it includes key points such as total suppliers, contracted, unlisted, average procurement cycle, suppliers share by different products. etc. Slidegeeks has constructed KPI Dashboard To Track Supplier Relationship Management Impact Inspiration PDF after conducting extensive research and examination. These presentation templates are constantly being generated and modified based on user preferences and critiques from editors. Here, you will find the most attractive templates for a range of purposes while taking into account ratings and remarks from users regarding the content. This is an excellent jumping-off point to explore our content and will give new users an insight into our top-notch PowerPoint Templates.
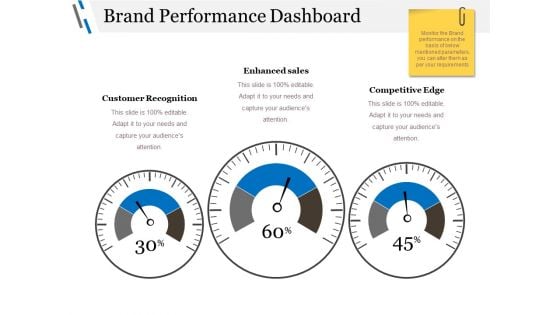
Brand Performance Dashboard Ppt PowerPoint Presentation Professional Grid
This is a brand performance dashboard ppt powerpoint presentation professional grid. This is a three stage process. The stages in this process are customer recognition, enhanced sales, competitive edge, dashboard, business.
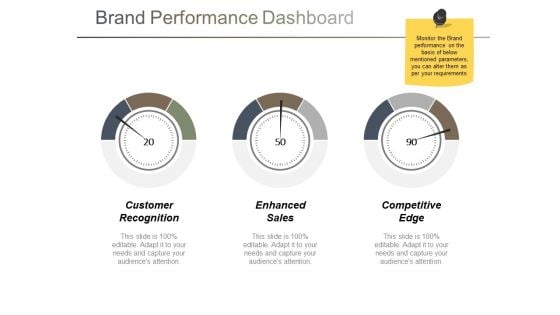
Brand Performance Dashboard Ppt PowerPoint Presentation Layouts Summary
This is a brand performance dashboard ppt powerpoint presentation layouts summary. This is a three stage process. The stages in this process are customer recognition, enhanced sales, competitive edge, dashboard, business.
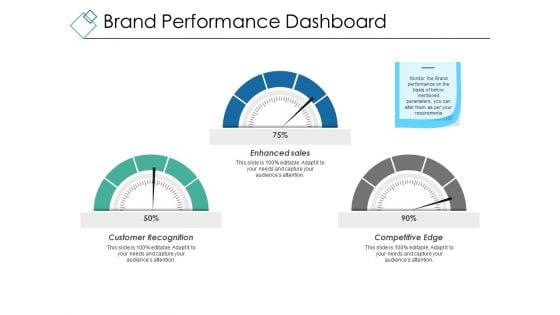
Brand Performance Dashboard Ppt PowerPoint Presentation Show Graphic Tips
This is a brand performance dashboard ppt powerpoint presentation show graphic tips. This is a three stage process. The stages in this process are customer recognition, enhanced sales, competitive edge, dashboard, business, percentage.
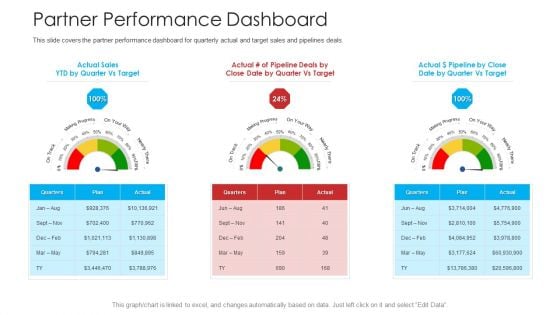
Retailer Channel Partner Boot Camp Partner Performance Dashboard Sample PDF
This slide covers the partner performance dashboard for quarterly actual and target sales and pipelines deals. Presenting retailer channel partner boot camp partner performance dashboard sample pdf to provide visual cues and insights. Share and navigate important information on three stages that need your due attention. This template can be used to pitch topics like performance dashboard, target sales, marketing progress. In addition, this PPT design contains high-resolution images, graphics, etc, that are easily editable and available for immediate download.
Sales Diagram Dashboard Visual Iinformation Design Business Cycle Diagram
Establish The Dominance Of Your Ideas. Our Sales Diagram Dashboard Visual Information Design Business Cycle Diagram Powerpoint Templates Will Put Them On Top.
Business Framework Model Dashboard Business Meter Design Sales Diagram
Our Business Framework Model Dashboard Business Meter Design Sales Diagram Powerpoint Templates Team Are A Dogged Lot. They Keep At It Till They Get It Right.
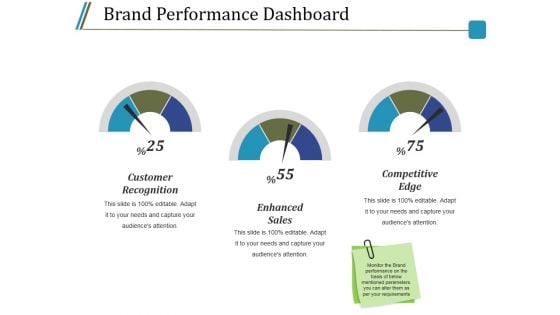
Brand Performance Dashboard Ppt PowerPoint Presentation Infographics Shapes
This is a brand performance dashboard ppt powerpoint presentation infographics shapes. This is a three stage process. The stages in this process are customer recognition, enhanced sales, competitive edge.
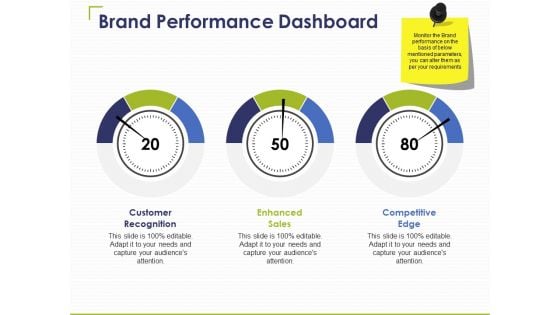
Brand Performance Dashboard Ppt PowerPoint Presentation Infographic Template Designs
This is a brand performance dashboard ppt powerpoint presentation infographic template designs. This is a three stage process. The stages in this process are customer recognition, enhanced sales, competitive edge.
Brand Performance Dashboard Ppt PowerPoint Presentation Icon Microsoft
This is a brand performance dashboard ppt powerpoint presentation icon microsoft. This is a three stage process. The stages in this process are customer recognition, enhanced sales, competitive edge.
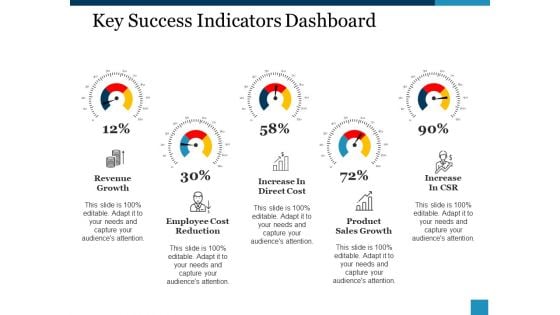
Key Success Indicators Dashboard Ppt PowerPoint Presentation Inspiration Guide
This is a key success indicators dashboard ppt powerpoint presentation inspiration guide. This is a five stage process. The stages in this process are revenue growth, increase in direct cost, increase in csr, employee cost reduction, product, sales growth.
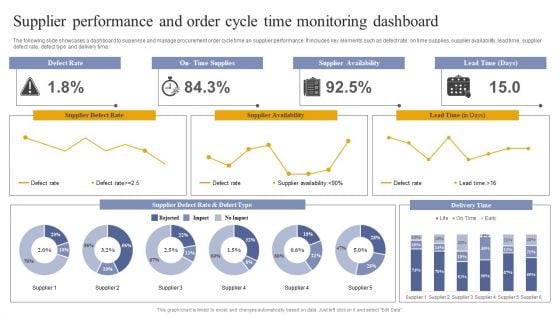
Vendor Performance Analysis And Administration Supplier Performance And Order Cycle Time Monitoring Dashboard Themes PDF
The following slide showcases a dashboard to supervise and manage procurement order cycle time an supplier performance. It includes key elements such as defect rate, on time supplies, supplier availability, lead time, supplier defect rate, defect type and delivery time. If you are looking for a format to display your unique thoughts, then the professionally designed Vendor Performance Analysis And Administration Supplier Performance And Order Cycle Time Monitoring Dashboard Themes PDF is the one for you. You can use it as a Google Slides template or a PowerPoint template. Incorporate impressive visuals, symbols, images, and other charts. Modify or reorganize the text boxes as you desire. Experiment with shade schemes and font pairings. Alter, share or cooperate with other people on your work. Download Vendor Performance Analysis And Administration Supplier Performance And Order Cycle Time Monitoring Dashboard Themes PDF and find out how to give a successful presentation. Present a perfect display to your team and make your presentation unforgettable.
Brand Building Brand Performance Dashboard Ppt Icon Diagrams PDF
Presenting this set of slides with name brand building brand performance dashboard ppt icon diagrams pdf. This is a three stage process. The stages in this process are customer recognition, enhanced sales, competitive edge. This is a completely editable PowerPoint presentation and is available for immediate download. Download now and impress your audience.
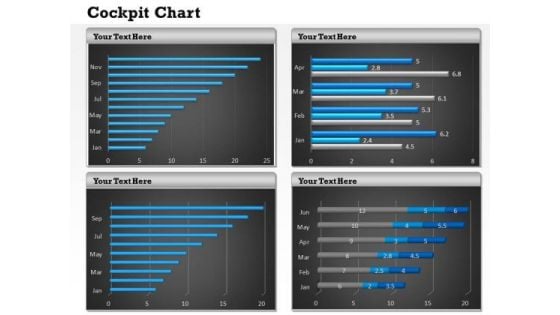
Sales Diagram Visual Design Of Dashboard Strategy Diagram
Dominate Proceedings With Your Ideas. Our Sales Diagram Visual Design Of Dashboard Strategy Diagram Powerpoint Templates Will Empower Your Thoughts.
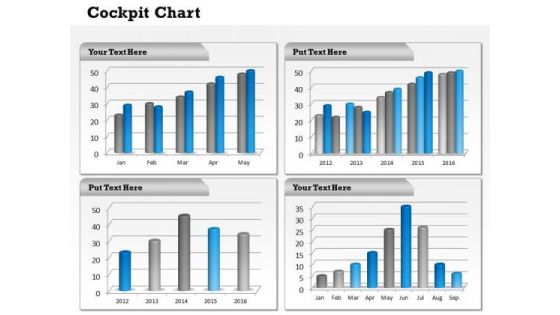
Marketing Diagram Dashboard Design For Business Sales Diagram
Your Listeners Will Never Doodle. Our Marketing Diagram Dashboard Design For Business Sales Diagram Powerpoint Templates Will Hold Their Concentration.
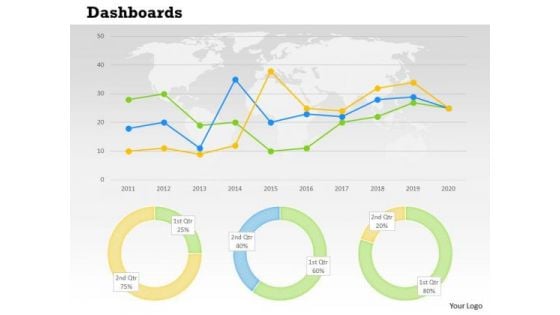
Sales Diagram Dashboard For Quantitative Business Data Consulting Diagram
Deliver The Right Dose With Our Sales Diagram Dashboard For Quantitative Business Data Consulting Diagram Powerpoint Templates. Your Ideas Will Get The Correct Illumination.
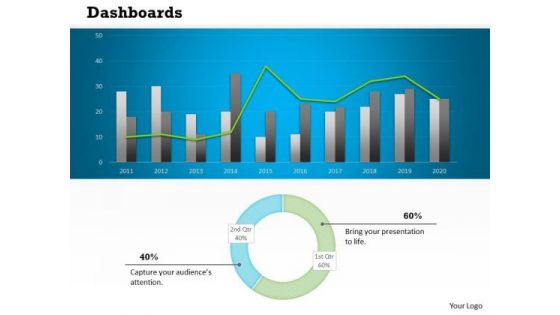
Sales Diagram Business Charts Dashboard Design Strategic Management
Put In A Dollop Of Our Sales Diagram Business Charts Dashboard Design Strategic Management Powerpoint Templates. Give Your Thoughts A Distinctive Flavor.
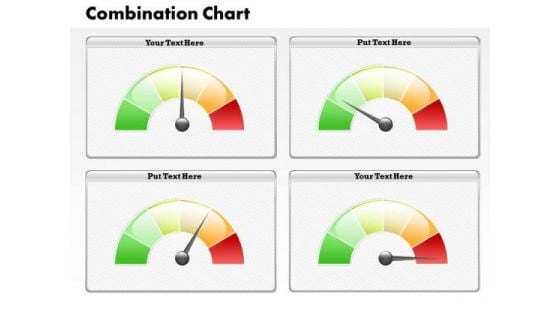
Sales Diagram Dashboard Meter For Business Information Business Diagram
Our Sales Diagram Dashboard Meter For Business Information Business Diagram Powerpoint Templates Deliver At Your Doorstep. Let Them In For A Wonderful Experience.
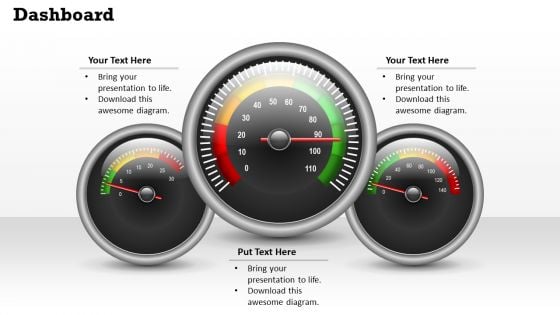
Marketing Diagram Dashboard To Compare Data Sales Diagram
Be A Donor Of Great Ideas. Display Your Charity On Our Marketing Diagram Dashboard To Compare Data Sales Diagram Powerpoint Templates.
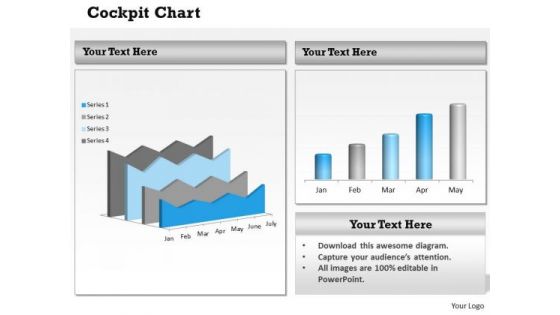
Consulting Diagram Business Dashboard Design Chart Sales Diagram
Document The Process On Our Consulting Diagram Business Dashboard Design Chart Sales Diagram Powerpoint Templates. Make A Record Of Every Detail.
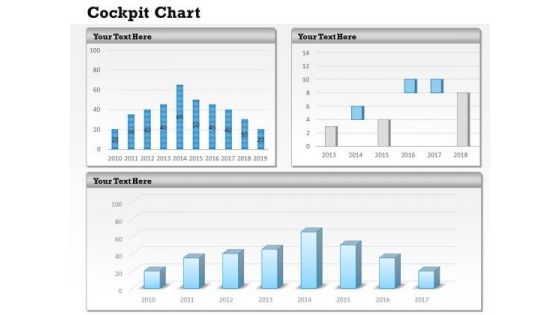
Marketing Diagram Business Intelligence Dashboard Design Sales Diagram
Our Marketing Diagram Business Intelligence Dashboard Design Sales Diagram Powerpoint Templates Team Are A Dogged Lot. They Keep At It Till They Get It Right.
Sales Diagram Business Reports In Dashboard Style Strategic Management
Get The Domestics Right With Our Sales Diagram Business Reports In Dashboard Style Strategic Management Powerpoint Templates. Create The Base For Thoughts To Grow.
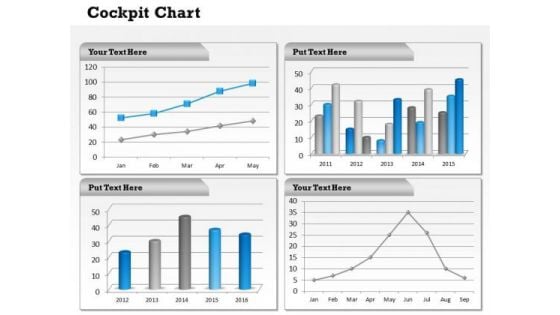
Consulting Diagram Dashboard Layout For Business Reporting Sales Diagram
Dominate Proceedings With Your Ideas. Our Consulting Diagram Dashboard Layout For Business Reporting Sales Diagram Powerpoint Templates Will Empower Your Thoughts.
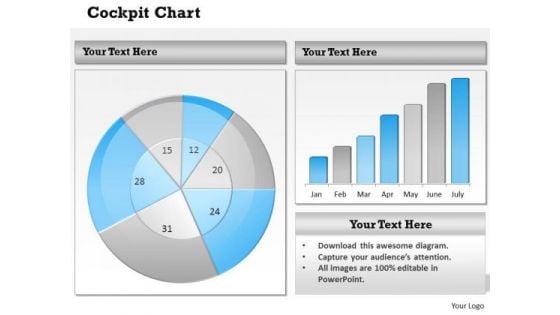
Mba Models And Frameworks Dashboard Layout Business Design Sales Diagram
Open Up Doors That Lead To Success. Our MBA Models And Frameworks Dashboard Layout Business Design Sales Diagram Powerpoint Templates Provide The Handles.
Performance Dashboard Template 1 Ppt PowerPoint Presentation Icon Guidelines
This is a performance dashboard template 1 ppt powerpoint presentation icon guidelines. This is a one stage process. The stages in this process are performance dashboard, business, marketing, management.
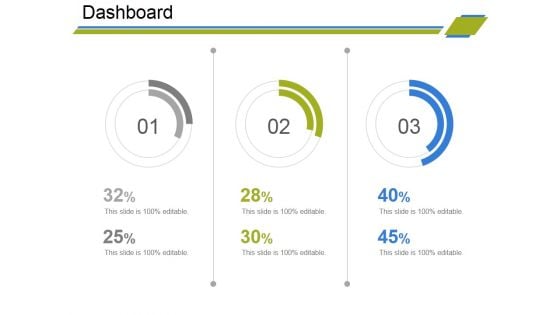
Dashboard Ppt PowerPoint Presentation Infographic Template Graphics Template
This is a dashboard ppt powerpoint presentation infographic template graphics template. This is a three stage process. The stages in this process are dashboard, measurement, marketing, analysis, business, strategy.
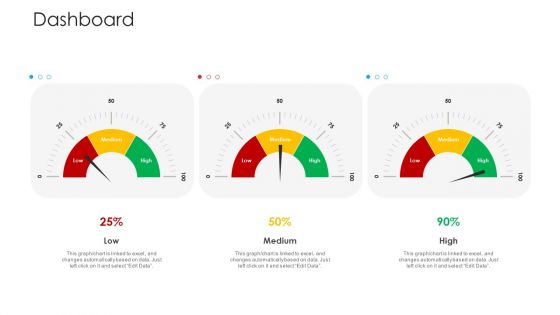
Retailer Channel Partner Boot Camp Dashboard Ppt File Clipart PDF
This is a retailer channel partner boot camp dashboard ppt file clipart pdf template with various stages. Focus and dispense information on three stages using this creative set, that comes with editable features. It contains large content boxes to add your information on topic like dashboard. You can also showcase facts, figures, and other relevant content using this PPT layout. Grab it now.
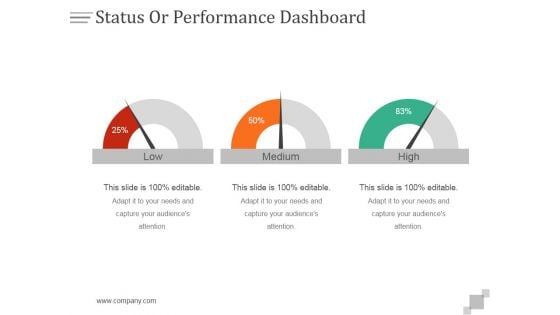
Status Or Performance Dashboard Ppt PowerPoint Presentation Designs Download
This is a status or performance dashboard ppt powerpoint presentation designs download. This is a three stage process. The stages in this process are low, medium, high.
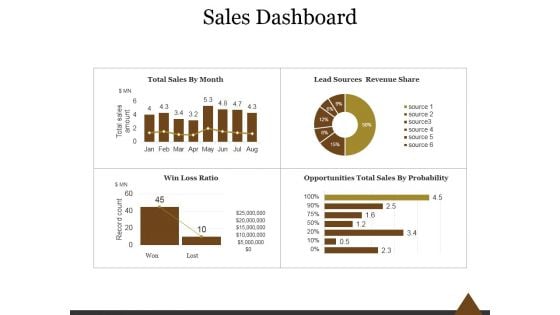
Sales Dashboard Template 2 Ppt PowerPoint Presentation Introduction
This is a sales dashboard template 2 ppt powerpoint presentation introduction. This is a four stage process. The stages in this process are total sales by month, lead sources revenue share, win loss ratio, opportunities total sales by probability.
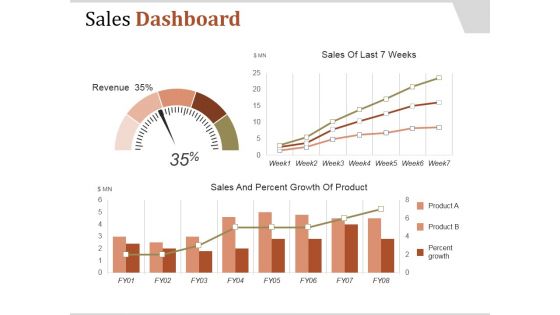
Sales Dashboard Template 1 Ppt PowerPoint Presentation Samples
This is a sales dashboard template 1 ppt powerpoint presentation samples. This is a one stage process. The stages in this process are sales and percent growth of product, revenue, product, percent growth.
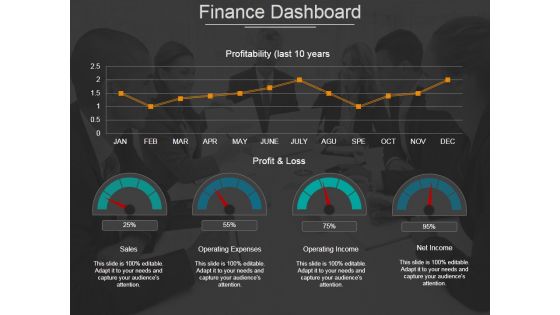
Finance Dashboard Ppt PowerPoint Presentation Model Graphics Example
This is a finance dashboard ppt powerpoint presentation model graphics example. This is a two stage process. The stages in this process are sales, operating expenses, operating income, net income.
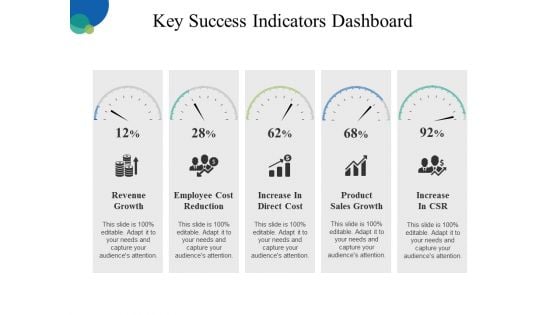
Key Success Indicators Dashboard Ppt PowerPoint Presentation Outline Slideshow
This is a key success indicators dashboard ppt powerpoint presentation outline slideshow. This is a five stage process. The stages in this process are revenue growth, employee cost reduction, increase in direct cost, product sales growth, increase in csr.
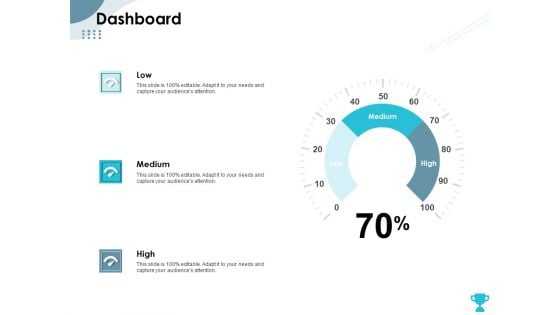
Strategies Take Your Retail Business Ahead Competition Dashboard Background PDF
Presenting this set of slides with name strategies take your retail business ahead competition dashboard background pdf. This is a three stage process. The stages in this process are low, medium, high. This is a completely editable PowerPoint presentation and is available for immediate download. Download now and impress your audience.

 Home
Home