Progress Meter
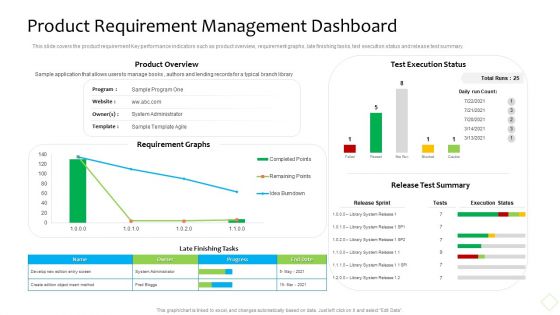
Product Demand Administration Product Requirement Management Dashboard Themes PDF
This slide covers the product requirement Key performance indicators such as product overview, requirement graphs, late finishing tasks, text execution status and release test summary. Deliver and pitch your topic in the best possible manner with this product demand administration product requirement management dashboard themes pdf. Use them to share invaluable insights on develop, progress, system and impress your audience. This template can be altered and modified as per your expectations. So, grab it now.
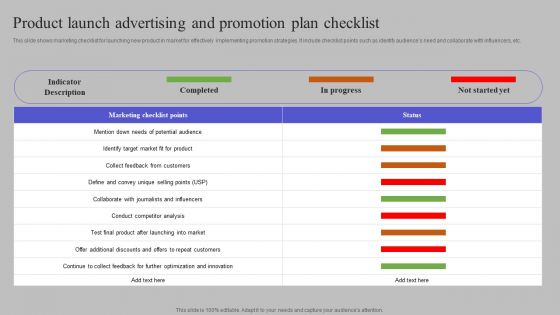
Product Launch Advertising And Promotion Plan Checklist Slides PDF
This slide shows marketing checklist for launching new product in market for effectively implementing promotion strategies. It include checklist points such as identify audiences need and collaborate with influencers, etc. Showcasing this set of slides titled Product Launch Advertising And Promotion Plan Checklist Slides PDF. The topics addressed in these templates are Indicator, Completed, In Progress. All the content presented in this PPT design is completely editable. Download it and make adjustments in color, background, font etc. as per your unique business setting.
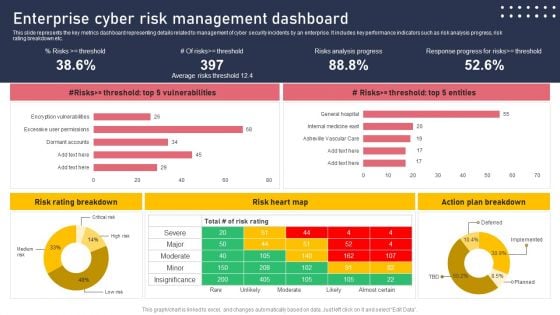
Enterprise Cyber Risk Management Dashboard Sample PDF
This slide represents the key metrics dashboard representing details related to management of cyber security incidents by an enterprise. It includes key performance indicators such as risk analysis progress, risk rating breakdown etc. There are so many reasons you need a Enterprise Cyber Risk Management Dashboard Sample PDF. The first reason is you cannot spend time making everything from scratch, Thus, Slidegeeks has made presentation templates for you too. You can easily download these templates from our website easily.
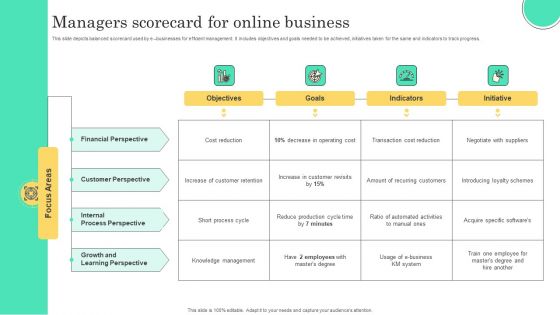
Managers Scorecard For Online Business Structure PDF
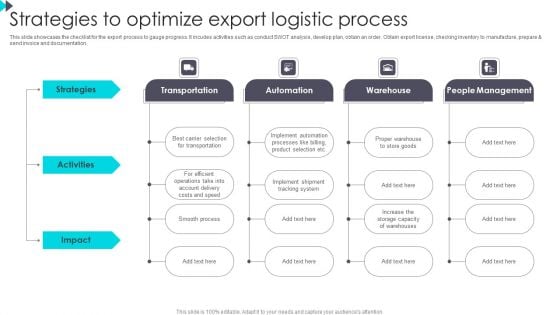
Strategies To Optimize Export Logistic Process Graphics PDF
This slide showcases the checklist for the export process to gauge progress. It incudes activities such as conduct SWOT analysis, develop plan, obtain an order. Obtain export license, checking inventory to manufacture, prepare and send invoice and documentation. Persuade your audience using this Strategies To Optimize Export Logistic Process Graphics PDF. This PPT design covers Three stages, thus making it a great tool to use. It also caters to a variety of topics including Transportation, Automation, People Management. Download this PPT design now to present a convincing pitch that not only emphasizes the topic but also showcases your presentation skills.
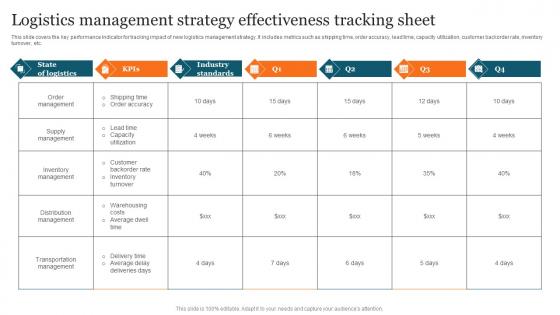
Logistics Management Strategy Advanced Supply Chain Improvement Strategies Ideas Pdf
This slide covers the key performance indicator for tracking impact of new logistics management strategy. It includes metrics such as shipping time, order accuracy, lead time, capacity utilization, customer backorder rate, inventory turnover, etc. Formulating a presentation can take up a lot of effort and time, so the content and message should always be the primary focus. The visuals of the PowerPoint can enhance the presenters message, so our Logistics Management Strategy Advanced Supply Chain Improvement Strategies Ideas Pdf was created to help save time. Instead of worrying about the design, the presenter can concentrate on the message while our designers work on creating the ideal templates for whatever situation is needed. Slidegeeks has experts for everything from amazing designs to valuable content, we have put everything into Logistics Management Strategy Advanced Supply Chain Improvement Strategies Ideas Pdf This slide covers the key performance indicator for tracking impact of new logistics management strategy. It includes metrics such as shipping time, order accuracy, lead time, capacity utilization, customer backorder rate, inventory turnover, etc.
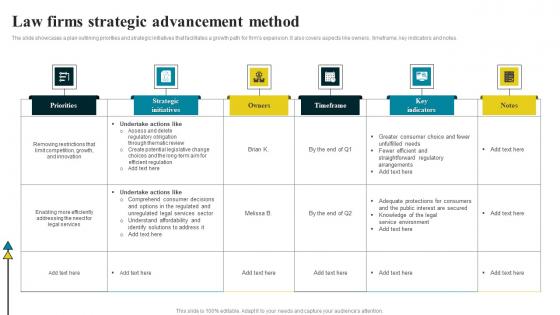
Law Firms Strategic Advancement Method Professional Pdf
The slide showcases a plan outlining priorities and strategic initiatives that facilitates a growth path for firms expansion. It also covers aspects like owners, timeframe, key indicators and notes. Showcasing this set of slides titled Law Firms Strategic Advancement Method Professional Pdf The topics addressed in these templates are Strategic Initiatives, Timeframe, Key Indicators All the content presented in this PPT design is completely editable. Download it and make adjustments in color, background, font etc. as per your unique business setting. The slide showcases a plan outlining priorities and strategic initiatives that facilitates a growth path for firms expansion. It also covers aspects like owners, timeframe, key indicators and notes.
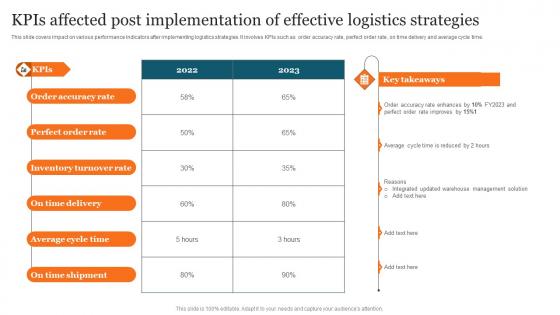
KPIs Affected Post Implementation Advanced Supply Chain Improvement Strategies Rules Pdf
This slide covers impact on various performance indicators after implementing logistics strategies. It involves KPIs such as order accuracy rate, perfect order rate, on time delivery and average cycle time. Are you in need of a template that can accommodate all of your creative concepts This one is crafted professionally and can be altered to fit any style. Use it with Google Slides or PowerPoint. Include striking photographs, symbols, depictions, and other visuals. Fill, move around, or remove text boxes as desired. Test out color palettes and font mixtures. Edit and save your work, or work with colleagues. Download KPIs Affected Post Implementation Advanced Supply Chain Improvement Strategies Rules Pdf and observe how to make your presentation outstanding. Give an impeccable presentation to your group and make your presentation unforgettable. This slide covers impact on various performance indicators after implementing logistics strategies. It involves KPIs such as order accuracy rate, perfect order rate, on time delivery and average cycle time.
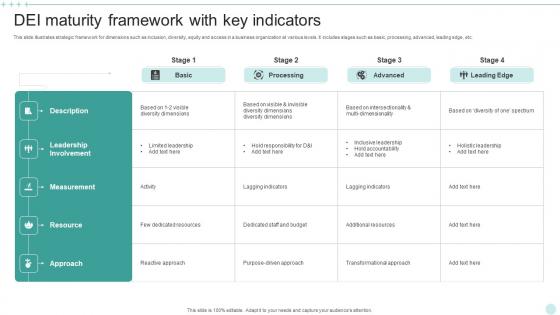
DEI Maturity Framework With Key Indicators Ideas Pdf
This slide illustrates strategic framework for dimensions such as inclusion, diversity, equity and access in a business organization at various levels. It includes stages such as basic, processing, advanced, leading edge, etc. Showcasing this set of slides titled DEI Maturity Framework With Key Indicators Ideas Pdf. The topics addressed in these templates are Leadership Involvement, Measurement, Holistic Leadership, Maturity Framework. All the content presented in this PPT design is completely editable. Download it and make adjustments in color, background, font etc. as per your unique business setting. This slide illustrates strategic framework for dimensions such as inclusion, diversity, equity and access in a business organization at various levels. It includes stages such as basic, processing, advanced, leading edge, etc.
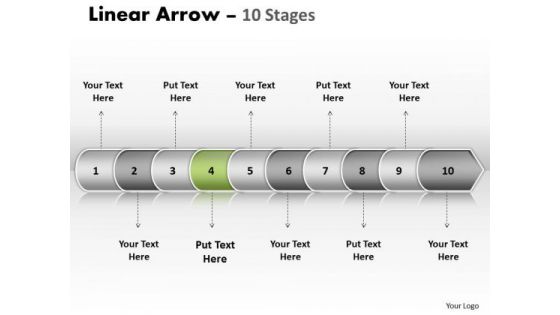
Usa Ppt Background Linear Arrow 10 State PowerPoint Project Diagram 5 Image
USA PPT Background linear arrow 10 state powerpoint project diagram 5 Image-Use this diagram to emphasize the process of your corporate growth. Highlight your ideas broad- based on strong fundamentals and illustrate how they step by step achieve the set growth factor.-USA PPT Background linear arrow 10 state powerpoint project diagram 5 Image-Arrow, Background, Collection, Completed, Concept, Confirmation, Design, Flow, Graph, Graphic, Illustration, Indication, Indicator, Information, Instruction, Interface, Internet, Layout, Measurement, Order, Phase, Pointer, Process, Progress, Reflection, Scale, Shape, Sign When in doubt fall back on our Usa Ppt Background Linear Arrow 10 State PowerPoint Project Diagram 5 Image. All your apprehensions will fall away.
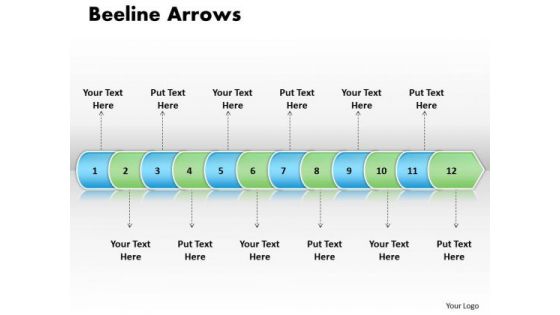
Ppt Linear Arrow 12 Stages PowerPoint Templates
PPT linear arrow 12 stages PowerPoint Templates-This PPT is made of Linear arrows. This graphics is of superlative quality that makes an attractive presentation. This template is quite a remedy to present any process-PPT linear arrow 12 stages PowerPoint Templates-Arrow, Background, Collection, Completed, Concept, Confirmation, Design, Flow, Graph, Graphic, Illustration, Indication, Indicator, Information, Instruction, Interface, Internet, Layout, Measurement, Order, Phase, Pointer, Process, Progress, Reflection, Scale, Shape, Sign Make the event with our Ppt Linear Arrow 12 Stages PowerPoint Templates. Your thoughts will be really happening.
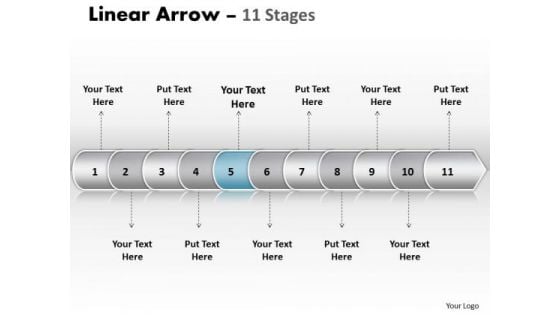
Usa Ppt Template Linear Arrow 11 Phase Diagram Time Management PowerPoint 6 Design
USA PPT template linear arrow 11 phase diagram time management powerpoint 6 design-This linear arrow chart makes information accessible throughout the organization with a collective, visible view of critical data from different perspectives and providing the tools to upcoming business scenarios and plan for change.-USA PPT template linear arrow 11 phase diagram time management powerpoint 6 design-Arrow, Background, Collection, Completed, Concept, Confirmation, Design, Flow, Graph, Graphic, Illustration, Indication, Indicator, Information, Instruction, Interface, Internet, Layout, Measurement, Order, Phase, Pointer, Process, Progress, Reflection, Scale, Shape, Sign Integrate teams with our Usa Ppt Template Linear Arrow 11 Phase Diagram Time Management PowerPoint 6 Design. Download without worries with our money back guaranteee.
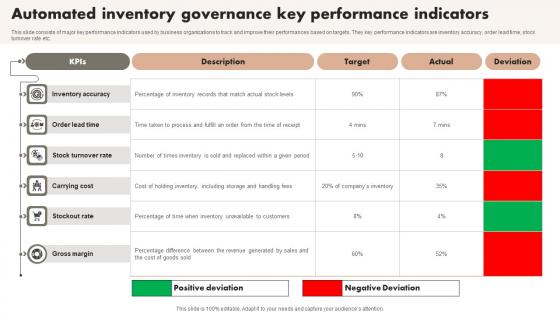
Automated Inventory Governance Key Performance Indicators Information Pdf
This slide consists of major key performance indicators used by business organizations to track and improve their performances based on targets. They key performance indicators are inventory accuracy, order lead time, stock turnover rate etc. Showcasing this set of slides titled Automated Inventory Governance Key Performance Indicators Information Pdf. The topics addressed in these templates are Description, Target, Actual. All the content presented in this PPT design is completely editable. Download it and make adjustments in color, background, font etc. as per your unique business setting. This slide consists of major key performance indicators used by business organizations to track and improve their performances based on targets. They key performance indicators are inventory accuracy, order lead time, stock turnover rate etc.
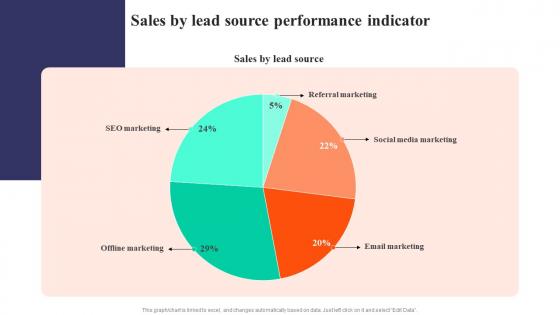
Sales By Lead Source Performance Indicator Strategies To Develop Successful Guidelines Pdf
This modern and well-arranged Sales By Lead Source Performance Indicator Strategies To Develop Successful Guidelines Pdf provides lots of creative possibilities. It is very simple to customize and edit with the Powerpoint Software. Just drag and drop your pictures into the shapes. All facets of this template can be edited with Powerpoint no extra software is necessary. Add your own material, put your images in the places assigned for them, adjust the colors, and then you can show your slides to the world, with an animated slide included. Our Sales By Lead Source Performance Indicator Strategies To Develop Successful Guidelines Pdf are topically designed to provide an attractive backdrop to any subject. Use them to look like a presentation pro.

ITIL Authorization Management Key Performance Indicators Infographics Pdf
This slide showcase KPI indicators which helps in identifying areas of improvement and align all parties involved in access management. It include KPIs such as unauthorized access setting, request access number, revoked instances and deviation in defined security policies. Showcasing this set of slides titled ITIL Authorization Management Key Performance Indicators Infographics Pdf The topics addressed in these templates are Unit Of Measures, Defined Security, Access Management All the content presented in this PPT design is completely editable. Download it and make adjustments in color, background, font etc. as per your unique business setting. This slide showcase KPI indicators which helps in identifying areas of improvement and align all parties involved in access management. It include KPIs such as unauthorized access setting, request access number, revoked instances and deviation in defined security policies.
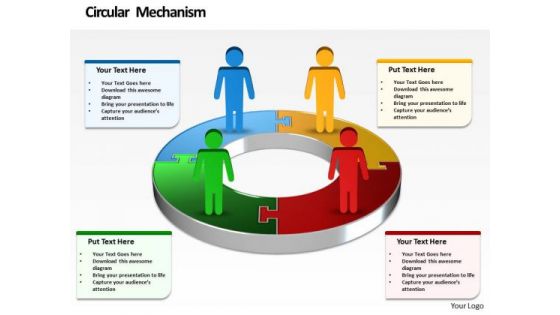
Ppt Symbol Business Men Standing On Financial Colorful Pie Chart PowerPoint Templates
PPT symbol business men standing on financial colorful pie chart PowerPoint Templates-Use this Business based PowerPoint Diagram to represent the Business issues Graphically. It indicates arrange, block out, blueprint, cast, delineate, design, devise, draft, graph , lay out, outline, plot, project, shape, sketch etc.-PPT symbol business men standing on financial colorful pie chart PowerPoint Templates-Adult, Art, Background, Business, Career, Chart, Communication, Concept, Conference, Corporate, Creative, Design, Economy, Executive, Finance, Group, Growth, Idea, Illustration, Leadership, Meeting, New, Occupation, Office, People, Person, Progress, Silhouette, Space, Speaking, Standing, Success Entertain your audience with your thoughts. Capture their imagination with our Ppt Symbol Business Men Standing On Financial Colorful Pie Chart PowerPoint Templates.
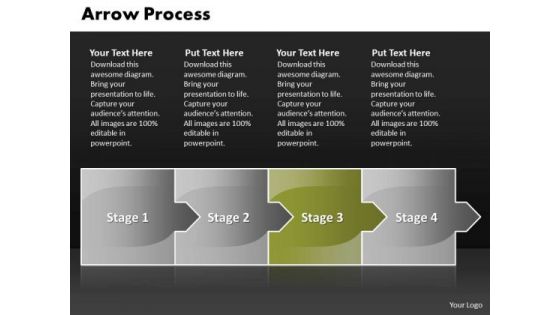
Editable Ppt Theme Arrow Process 4 Stages Business Strategy PowerPoint Graphic
editable PPT Theme arrow process 4 stages business strategy powerpoint Graphic-Arrows Indicates the way to growth. Use this diagram for improved controls to drive your business towards the right direction. Deliver amazing presentations to mesmerize your audience.-editable PPT Theme arrow process 4 stages business strategy powerpoint Graphic-Advertising, Arrow, Concept, Corporate, Creative, Design, Direction, Flow, Illustration, Info, Graphic, Instruction, Label, Layout, Manual, Modern, Number, Offer, Order, Pointer, Product, Progress, Promotion, Sequence, Special, Step, Symbol Stand on your own feet with our Editable Ppt Theme Arrow Process 4 Stages Business Strategy PowerPoint Graphic. They will deliver all the assistance you need.
Product Development Status Icon With Bulb Ideas PDF
The following slide showcases dashboard that helps to track key performance indicators of product development. Key metrics covered overall progress, planning, design, development, testing, risks, summary, average handle time, overdue tasks, upcoming deadlines and projected launch date. Showcasing this set of slides titled Product Development Status Icon With Bulb Ideas PDF. The topics addressed in these templates are Design, Development, Planning. All the content presented in this PPT design is completely editable. Download it and make adjustments in color, background, font etc. as per your unique business setting.
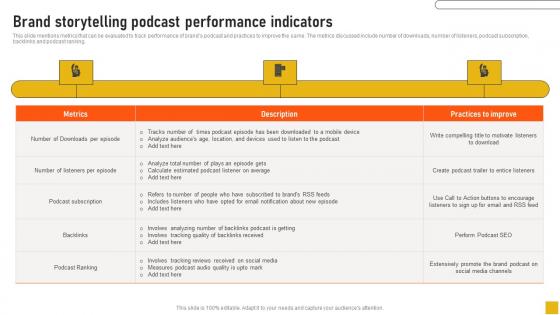
Brand Storytelling Podcast Performance Indicators Comprehensive Guide Structure Pdf
This slide mentions metrics that can be evaluated to track performance of brands podcast and practices to improve the same. The metrics discussed include number of downloads, number of listeners, podcast subscription, backlinks and podcast ranking. This Brand Storytelling Podcast Performance Indicators Comprehensive Guide Structure Pdf from Slidegeeks makes it easy to present information on your topic with precision. It provides customization options, so you can make changes to the colors, design, graphics, or any other component to create a unique layout. It is also available for immediate download, so you can begin using it right away. Slidegeeks has done good research to ensure that you have everything you need to make your presentation stand out. Make a name out there for a brilliant performance. This slide mentions metrics that can be evaluated to track performance of brands podcast and practices to improve the same. The metrics discussed include number of downloads, number of listeners, podcast subscription, backlinks and podcast ranking.

Cybersecurity Key Performance Indicators With Applications Summary Pdf
Pitch your topic with ease and precision using this Cybersecurity Key Performance Indicators With Applications Summary Pdf This layout presents information on Identify Weaknesses, Review Improvement, Security Policies It is also available for immediate download and adjustment. So, changes can be made in the color, design, graphics or any other component to create a unique layout. This slide showcases the cyber security key performance indicators with applications which helps an organization to determine readiness. It include details such as security policies, identify weaknesses, obligation to compliance framework, etc.
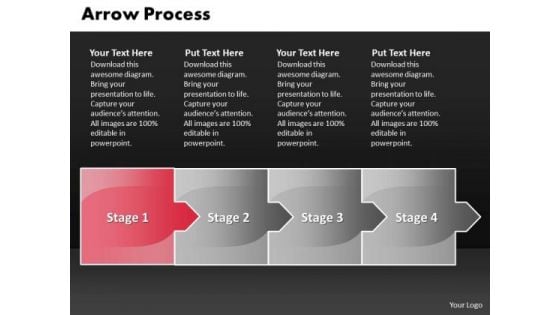
Process Ppt Template Arrow 4 Stages Business Management PowerPoint 2 Design
process PPT template arrow 4 stages business management powerpoint 2 design-This diagram is a graphical illustration of the relationships between and among sets of data, groups of objects. They are indicators of the path you have in mind.-process PPT template arrow 4 stages business management powerpoint 2 design-Advertising, Arrow, Concept, Corporate, Creative, Design, Direction, Flow, Illustration, Info, Graphic, Instruction, Label, Layout, Manual, Modern, Number, Offer, Order, Pointer, Product, Progress, Promotion, Sequence, Special, Step, Symbol Increase viewership with our Process Ppt Template Arrow 4 Stages Business Management PowerPoint 2 Design. Make sure your presentation gets the attention it deserves.
Implementing Digital Transformation Performance Tracking Kpi Dashboard For Digital Background PDF
Mentioned slide provides information about the key performance indicators that can be used by managers to measure the success of digital marketing strategy, KPIs covered are status, progress, priority and timeline. Boost your pitch with our creative Implementing Digital Transformation Performance Tracking Kpi Dashboard For Digital Background PDF. Deliver an awe-inspiring pitch that will mesmerize everyone. Using these presentation templates you will surely catch everyones attention. You can browse the ppts collection on our website. We have researchers who are experts at creating the right content for the templates. So you dont have to invest time in any additional work. Just grab the template now and use them.
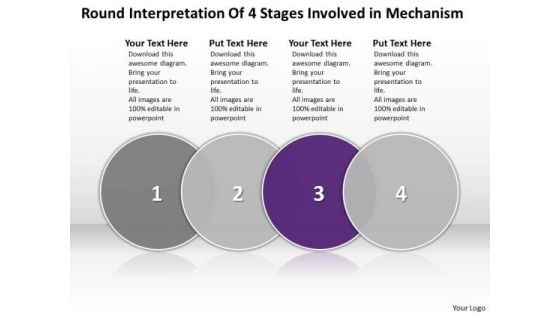
Ppt Summary Of 4 State PowerPoint Project Diagram Involved Mechanism Templates
PPT summary of 4 state powerpoint project diagram involved mechanism Templates-This diagram is a graphical illustration of the relationships between and among sets of data, groups of objects that share something in common. They are indicators of the path you have in mind.-PPT summary of 4 state powerpoint project diagram involved mechanism Templates-abstract, background, balance, business, circle, colorful, complement, concept, conceptual, connected, control, cooperation, design, gear, harmony, icon, ideal, illustration, involved, machine, progress, rhythm, round, shape, spin, support, system, teamwork, technology, together, wheel Ask any favour of our Ppt Summary Of 4 State PowerPoint Project Diagram Involved Mechanism Templates. You will find them truly accomodating.
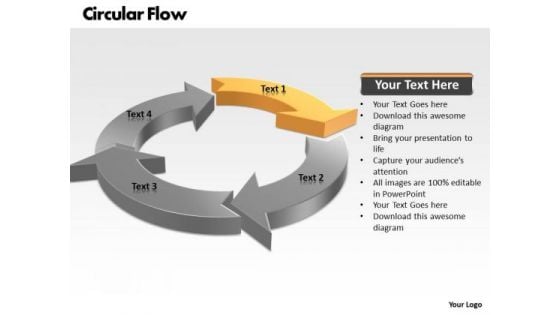
Ppt Circular Flow Process PowerPoint Presentation Chart 4 Stages Templates
PPT circular flow process powerpoint presentation chart 4 stages Templates-The diagrams are used to represent part whole relationship because results relationship etc. this is a 4 parts circle to express your ideas. They are indicators of the path you have in mind.-PPT circular flow process powerpoint presentation chart 4 stages Templates-Arrow, Chart, Circle, Circular, Circulation, Collection, Concept, Connection, Continuity, Cursor, Cycle, Cyclic, Diagram, Direction, Flow, Flowchart, Graph, Graphic, Group, Icon, Motion, Movement, Process, Progress, Recycle, Recycling, Refresh, Reload, Renew, Repetition, Return, Reuse, Ring, Rotation, Round, Sign, Six, Symbol Address eco-clubs with our Ppt Circular Flow Process PowerPoint Presentation Chart 4 Stages Templates. Advocate curbing of carbon emissions.
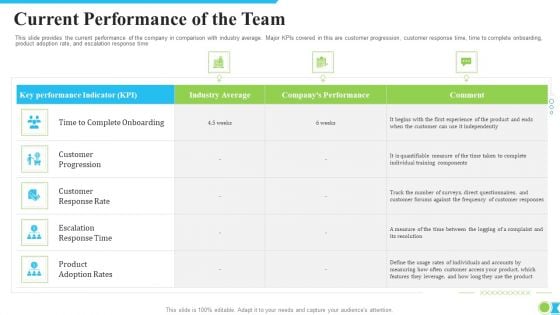
Current Performance Of The Team Ppt Summary Skills PDF
This slide provides the current performance of the company in comparison with industry average. Major KPIs covered in this are customer progression, customer response time, time to complete onboarding, product adoption rate, and escalation response time. Deliver and pitch your topic in the best possible manner with this current performance of the team ppt summary skills pdf. Use them to share invaluable insights on key performance indicator, industry average, companys performance, comment and impress your audience. This template can be altered and modified as per your expectations. So, grab it now.
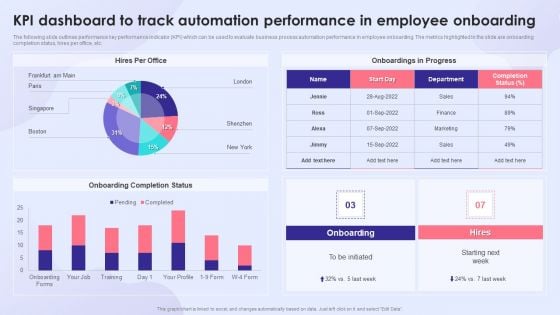
KPI Dashboard To Track Automation Performance In Employee Onboarding Introduction PDF
The following slide outlines performance key performance indicator KPI which can be used to evaluate business process automation performance in employee onboarding. The metrics highlighted in the slide are onboarding completion status, hires per office, etc. Deliver an awe inspiring pitch with this creative KPI Dashboard To Track Automation Performance In Employee Onboarding Introduction PDF bundle. Topics like Onboarding Completion Status, Onboardings In Progress, Employee Onboarding can be discussed with this completely editable template. It is available for immediate download depending on the needs and requirements of the user.
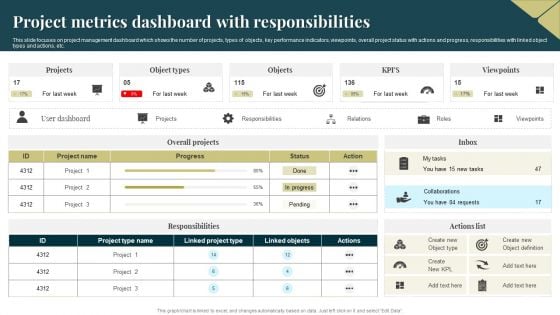
Project Metrics Dashboard With Responsibilities Graphics PDF
This slide focuses on project management dashboard which shows the number of projects, types of objects, key performance indicators, viewpoints, overall project status with actions and progress, responsibilities with linked object types and actions, etc. Pitch your topic with ease and precision using this Project Metrics Dashboard With Responsibilities Graphics PDF. This layout presents information on Project Metrics, Dashboard With Responsibilities. It is also available for immediate download and adjustment. So, changes can be made in the color, design, graphics or any other component to create a unique layout.
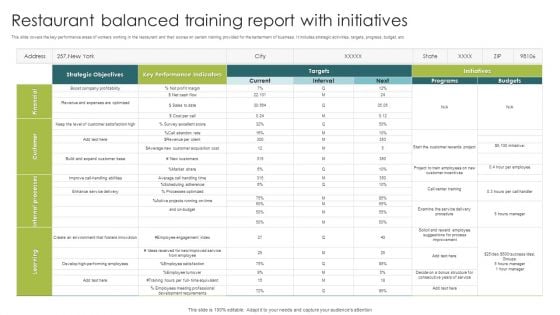
Restaurant Balanced Training Report With Initiatives Ppt Professional Tips PDF
This slide covers the key performance areas of workers working in the restaurant and their scores on certain training provided for the betterment of business. It includes strategic activities, targets, progress, budget, etc. Pitch your topic with ease and precision using this Restaurant Balanced Training Report With Initiatives Ppt Professional Tips PDF. This layout presents information on Key Performance Indicators, Target, Strategic Objectives. It is also available for immediate download and adjustment. So, changes can be made in the color, design, graphics or any other component to create a unique layout.
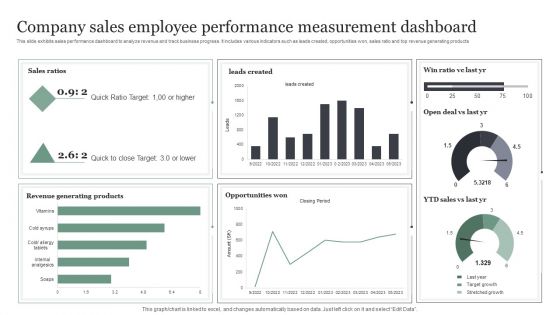
Company Sales Employee Performance Measurement Dashboard Information PDF
This slide exhibits sales performance dashboard to analyze revenue and track business progress. It includes various indicators such as leads created, opportunities won, sales ratio and top revenue generating products. Showcasing this set of slides titled Company Sales Employee Performance Measurement Dashboard Information PDF. The topics addressed in these templates are Quick Ratio Target, Opportunities Won, Revenue Generating Products. All the content presented in this PPT design is completely editable. Download it and make adjustments in color, background, font etc. as per your unique business setting.
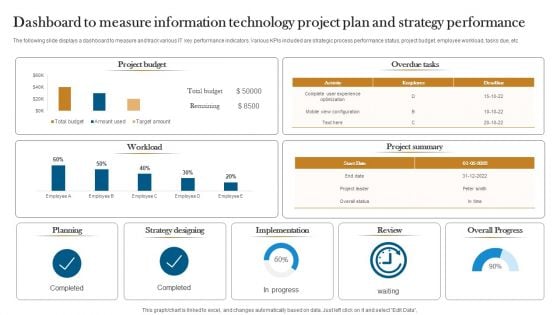
Dashboard To Measure Information Technology Project Plan And Strategy Performance Designs PDF
The following slide displays a dashboard to measure and track various IT key performance indicators. Various KPIs included are strategic process performance status, project budget, employee workload, tasks due, etc. Showcasing this set of slides titled Dashboard To Measure Information Technology Project Plan And Strategy Performance Designs PDF. The topics addressed in these templates are Strategy Designing, Implementation, Overall Progress. All the content presented in this PPT design is completely editable. Download it and make adjustments in color, background, font etc. as per your unique business setting.
KPI Dashboard For Tracking Project Summary Ppt Status Themes PDF
This slide brings forth dashboard which assists project managers in tracking the status of projects . The key performance indicators are project title, tag, responsibility, date assigned, project team, progress, deadline and status. Persuade your audience using this KPI Dashboard For Tracking Project Summary Ppt Status Themes PDF. This PPT design covers one stages, thus making it a great tool to use. It also caters to a variety of topics including Project Title, Responsibility, Date Assigned. Download this PPT design now to present a convincing pitch that not only emphasizes the topic but also showcases your presentation skills.
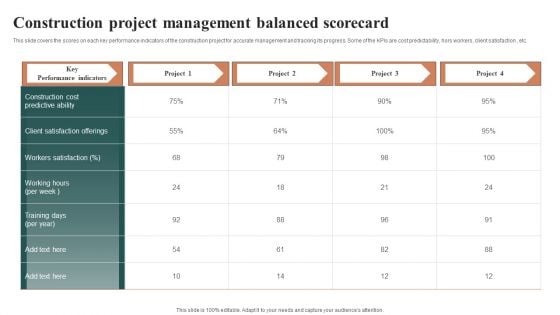
Construction Project Management Balanced Scorecard Slides PDF
This slide covers the scores on each key performance indicators of the construction project for accurate management and tracking its progress. Some of the KPIs are cost predictability, hors workers, client satisfaction , etc. Showcasing this set of slides titled Construction Project Management Balanced Scorecard Slides PDF. The topics addressed in these templates are Workers Satisfaction, Construction Cost Predictive Ability, Project. All the content presented in this PPT design is completely editable. Download it and make adjustments in color, background, font etc. as per your unique business setting.
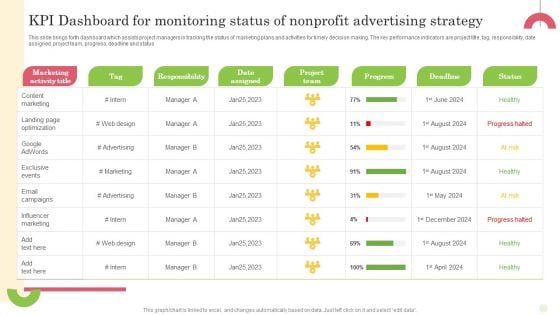
Kpi Dashboard For Monitoring Status Of Nonprofit Advertising Strategy Portrait PDF
This slide brings forth dashboard which assists project managers in tracking the status of marketing plans and activities for timely decision making. The key performance indicators are project title, tag, responsibility, date assigned, project team, progress, deadline and status Pitch your topic with ease and precision using this Kpi Dashboard For Monitoring Status Of Nonprofit Advertising Strategy Portrait PDF. This layout presents information on Tag, Responsibility, Date Assigned. It is also available for immediate download and adjustment. So, changes can be made in the color, design, graphics or any other component to create a unique layout.
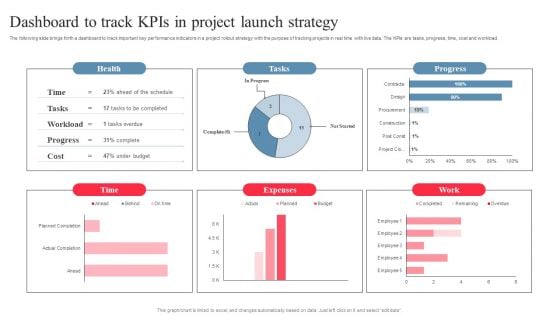
Dashboard To Track Kpis In Project Launch Strategy Pictures PDF
The following slide brings forth a dashboard to track important key performance indicators in a project rollout strategy with the purpose of tracking projects in real time with live data. The KPIs are tasks, progress, time, cost and workload. Showcasing this set of slides titled Dashboard To Track Kpis In Project Launch Strategy Pictures PDF. The topics addressed in these templates are Expenses, Project Launch Strategy, Dashboard To Track Kpis. All the content presented in this PPT design is completely editable. Download it and make adjustments in color, background, font etc. as per your unique business setting.
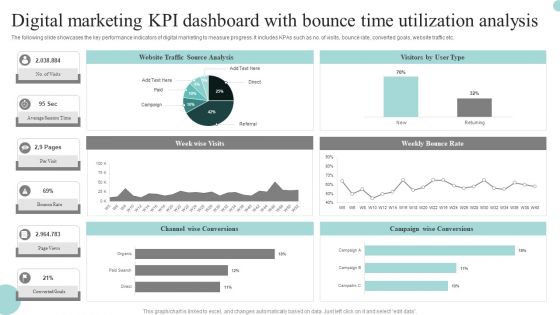
Digital Marketing Kpi Dashboard With Bounce Time Utilization Analysis Graphics PDF
The following slide showcases the key performance indicators of digital marketing to measure progress. It includes KPAs such as no. of visits, bounce rate, converted goals, website traffic etc. Pitch your topic with ease and precision using this Digital Marketing Kpi Dashboard With Bounce Time Utilization Analysis Graphics PDF. This layout presents information on Digital Marketing, KPI Dashboard, Bounce Time Utilization Analysis. It is also available for immediate download and adjustment. So, changes can be made in the color, design, graphics or any other component to create a unique layout.
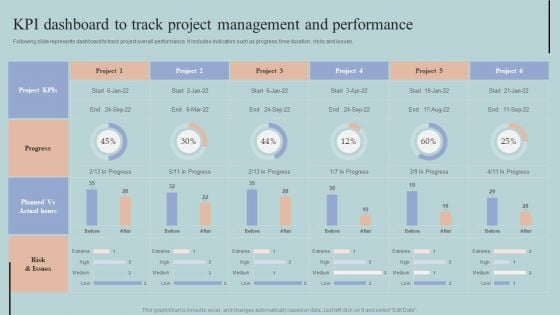
KPI Dashboard To Track Project Management And Performance Elements PDF
Following slide represents dashboard to track project overall performance. It includes indicators such as progress, time duration , risks and issues. Welcome to our selection of the KPI Dashboard To Track Project Management And Performance Elements PDF. These are designed to help you showcase your creativity and bring your sphere to life. Planning and Innovation are essential for any business that is just starting out. This collection contains the designs that you need for your everyday presentations. All of our PowerPoints are 100 percent editable, so you can customize them to suit your needs. This multi-purpose template can be used in various situations. Grab these presentation templates today
Performance Tracking KPI Dashboard Digital Approaches To Increase Business Growth Summary Pdf
Mentioned slide provides information about the key performance indicators that can be used by managers to measure the success of digital marketing strategy, KPIs covered are status, progress, priority and timeline. Formulating a presentation can take up a lot of effort and time, so the content and message should always be the primary focus. The visuals of the PowerPoint can enhance the presenters message, so our Performance Tracking KPI Dashboard Digital Approaches To Increase Business Growth Summary Pdf was created to help save time. Instead of worrying about the design, the presenter can concentrate on the message while our designers work on creating the ideal templates for whatever situation is needed. Slidegeeks has experts for everything from amazing designs to valuable content, we have put everything into Performance Tracking KPI Dashboard Digital Approaches To Increase Business Growth Summary Pdf Mentioned slide provides information about the key performance indicators that can be used by managers to measure the success of digital marketing strategy, KPIs covered are status, progress, priority and timeline.
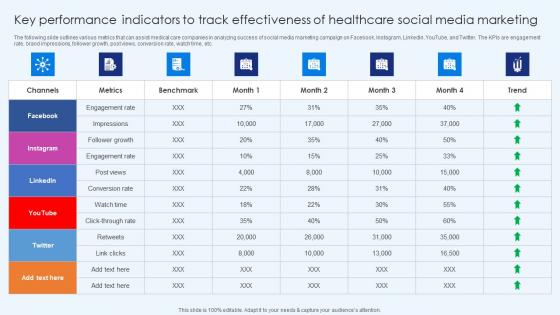
Key Performance Indicators To Tracks Effectiveness Healthcare Promotion Diagrams Pdf
The following slide outlines various metrics that can assist medical care companies in analyzing success of social media marketing campaign on Facebook, Instagram, LinkedIn, YouTube, and Twitter. The KPIs are engagement rate, brand impressions, follower growth, post views, conversion rate, watch time, etc. Slidegeeks has constructed Key Performance Indicators To Tracks Effectiveness Healthcare Promotion Diagrams Pdf after conducting extensive research and examination. These presentation templates are constantly being generated and modified based on user preferences and critiques from editors. Here, you will find the most attractive templates for a range of purposes while taking into account ratings and remarks from users regarding the content. This is an excellent jumping-off point to explore our content and will give new users an insight into our top-notch PowerPoint Templates. The following slide outlines various metrics that can assist medical care companies in analyzing success of social media marketing campaign on Facebook, Instagram, LinkedIn, YouTube, and Twitter. The KPIs are engagement rate, brand impressions, follower growth, post views, conversion rate, watch time, etc.
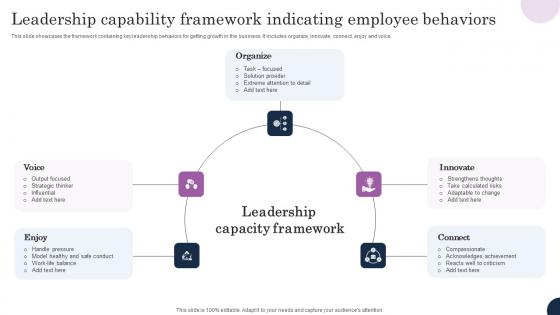
Leadership Capability Framework Indicating Employee Behaviors Mockup Pdf
This slide showcases the framework containing key leadership behaviors for getting growth in the business. It includes organize, innovate, connect, enjoy and voice. Showcasing this set of slides titled Leadership Capability Framework Indicating Employee Behaviors Mockup Pdf The topics addressed in these templates are Handle Pressure, Output Focused, Extreme Attention All the content presented in this PPT design is completely editable. Download it and make adjustments in color, background, font etc. as per your unique business setting. This slide showcases the framework containing key leadership behaviors for getting growth in the business. It includes organize, innovate, connect, enjoy and voice.
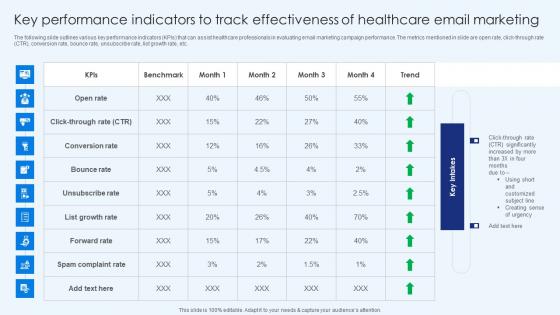
Key Performance Indicators To Track Effectiveness Of Healthcare Promotion Download Pdf
The following slide outlines various key performance indicators KPIs that can assist healthcare professionals in evaluating email marketing campaign performance. The metrics mentioned in slide are open rate, click-through rate CTR, conversion rate, bounce rate, unsubscribe rate, list growth rate, etc. Retrieve professionally designed Key Performance Indicators To Track Effectiveness Of Healthcare Promotion Download Pdf to effectively convey your message and captivate your listeners. Save time by selecting pre-made slideshows that are appropriate for various topics, from business to educational purposes. These themes come in many different styles, from creative to corporate, and all of them are easily adjustable and can be edited quickly. Access them as PowerPoint templates or as Google Slides themes. You do not have to go on a hunt for the perfect presentation because Slidegeeks got you covered from everywhere. The following slide outlines various key performance indicators KPIs that can assist healthcare professionals in evaluating email marketing campaign performance. The metrics mentioned in slide are open rate, click-through rate CTR, conversion rate, bounce rate, unsubscribe rate, list growth rate, etc.

Flowchart Indicating Activities Of Blockchain Logistics Blockchain Transportation Summary Pdf
This slide represents blockchain oriented logistics flowchart which can help manufacturers increase efficiency and profitability of managing supply chain. It provides details about financial flow, insurance company, smart contract service, cyber physical system, etc. Find highly impressive Flowchart Indicating Activities Of Blockchain Logistics Blockchain Transportation Summary Pdf on Slidegeeks to deliver a meaningful presentation. You can save an ample amount of time using these presentation templates. No need to worry to prepare everything from scratch because Slidegeeks experts have already done a huge research and work for you. You need to download Flowchart Indicating Activities Of Blockchain Logistics Blockchain Transportation Summary Pdf for your upcoming presentation. All the presentation templates are 100 percent editable and you can change the color and personalize the content accordingly. Download now This slide represents blockchain oriented logistics flowchart which can help manufacturers increase efficiency and profitability of managing supply chain. It provides details about financial flow, insurance company, smart contract service, cyber physical system, etc.

HR Innovation Program Performance Indicators Ppt Powerpoint Presentation Complete Deck With Slides
Use this HR Innovation Program Performance Indicators Ppt Powerpoint Presentation Complete Deck With Slides to ensure the business world gets to know you as a presentation expert with tremendous recall value. With its focus on providing the worlds best designs to highlight business ideas that have the potential to change the world, this PPT Template is sure to win you clients. The complete deck in ninteen slides is a compendium of information, structured in a manner that provides the best framework for a presentation. Use this completely editable and customizable presentation to make an impact and improve your order book. Download now. Our HR Innovation Program Performance Indicators Ppt Powerpoint Presentation Complete Deck With Slides are topically designed to provide an attractive backdrop to any subject. Use them to look like a presentation pro.
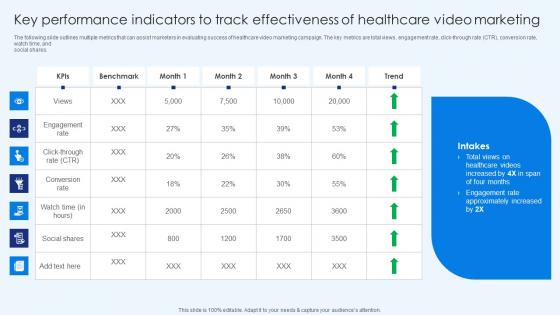
Healthcare Promotion Key Performance Indicators To Track Effectiveness Formats Pdf
The following slide outlines multiple metrics that can assist marketers in evaluating success of healthcare video marketing campaign. The key metrics are total views, engagement rate, click-through rate CTR, conversion rate, watch time, and social shares. Make sure to capture your audiences attention in your business displays with our gratis customizable Healthcare Promotion Key Performance Indicators To Track Effectiveness Formats Pdf. These are great for business strategies, office conferences, capital raising or task suggestions. If you desire to acquire more customers for your tech business and ensure they stay satisfied, create your own sales presentation with these plain slides. The following slide outlines multiple metrics that can assist marketers in evaluating success of healthcare video marketing campaign. The key metrics are total views, engagement rate, click-through rate CTR, conversion rate, watch time, and social shares.
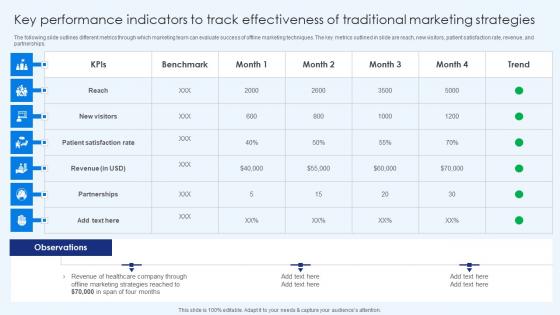
Key Performance Indicators To Track Effectivenes Healthcare Promotion Infographics Pdf
The following slide outlines different metrics through which marketing team can evaluate success of offline marketing techniques. The key metrics outlined in slide are reach, new visitors, patient satisfaction rate, revenue, and partnerships. The Key Performance Indicators To Track Effectivenes Healthcare Promotion Infographics Pdf is a compilation of the most recent design trends as a series of slides. It is suitable for any subject or industry presentation, containing attractive visuals and photo spots for businesses to clearly express their messages. This template contains a variety of slides for the user to input data, such as structures to contrast two elements, bullet points, and slides for written information. Slidegeeks is prepared to create an impression. The following slide outlines different metrics through which marketing team can evaluate success of offline marketing techniques. The key metrics outlined in slide are reach, new visitors, patient satisfaction rate, revenue, and partnerships.
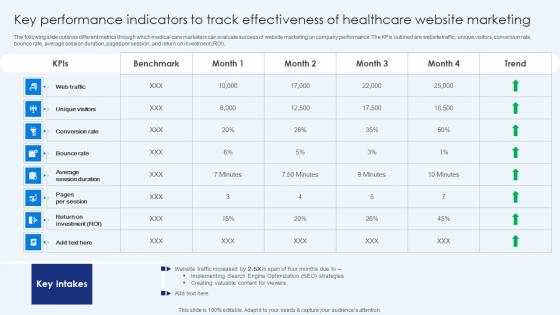
Key Performance Indicators To Track Effectiveness Healthcare Promotion Portrait Pdf
The following slide outlines different metrics through which medical care marketers can evaluate success of website marketing on company performance. The KPIs outlined are website traffic, unique visitors, conversion rate, bounce rate, average session duration, pages per session, and return on investment ROI. Are you searching for a Key Performance Indicators To Track Effectiveness Healthcare Promotion Portrait Pdf that is uncluttered, straightforward, and original Its easy to edit, and you can change the colors to suit your personal or business branding. For a presentation that expresses how much effort you have put in, this template is ideal With all of its features, including tables, diagrams, statistics, and lists, its perfect for a business plan presentation. Make your ideas more appealing with these professional slides. Download Key Performance Indicators To Track Effectiveness Healthcare Promotion Portrait Pdffrom Slidegeeks today. The following slide outlines different metrics through which medical care marketers can evaluate success of website marketing on company performance. The KPIs outlined are website traffic, unique visitors, conversion rate, bounce rate, average session duration, pages per session, and return on investment ROI.
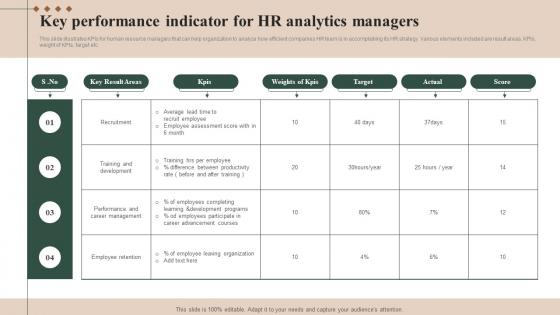
Key Performance Indicator For HR Analytics Managers Brochure Pdf
This slide illustrates KPIs for human resource managers that can help organization to analyze how efficient companies HR team is in accomplishing its HR strategy. Various elements included are result areas, KPIs, weight of KPIs, target etc.Pitch your topic with ease and precision using this Key Performance Indicator For HR Analytics Managers Brochure Pdf This layout presents information on Training Development, Career Management, Employee Retention It is also available for immediate download and adjustment. So, changes can be made in the color, design, graphics or any other component to create a unique layout. This slide illustrates KPIs for human resource managers that can help organization to analyze how efficient companies HR team is in accomplishing its HR strategy. Various elements included are result areas, KPIs, weight of KPIs, target etc.

Potential Indicators Managers Use For Appraisals Structure Pdf
This slide showcases the potential indicators used by managers for appraisals which help an organization to learn about training requirements of employees. It include details such as reality sense, analytical power, vision breadth, persuasiveness. Showcasing this set of slides titled Potential Indicators Managers Use For Appraisals Structure Pdf. The topics addressed in these templates are Reality Sense, Analytical Power, Vision Breadth. All the content presented in this PPT design is completely editable. Download it and make adjustments in color, background, font etc. as per your unique business setting. This slide showcases the potential indicators used by managers for appraisals which help an organization to learn about training requirements of employees. It include details such as reality sense, analytical power, vision breadth, persuasiveness.

Research Effectivenes Psychotherapy Indicates In Powerpoint And Google Slides Cpb
Presenting our innovatively-designed set of slides titled Research Effectivenes Psychotherapy Indicates In Powerpoint And Google Slides Cpb. This completely editable PowerPoint graphic exhibits Research Effectivenes Psychotherapy Indicates that will help you convey the message impactfully. It can be accessed with Google Slides and is available in both standard screen and widescreen aspect ratios. Apart from this, you can download this well-structured PowerPoint template design in different formats like PDF, JPG, and PNG. So, click the download button now to gain full access to this PPT design. Our Research Effectivenes Psychotherapy Indicates In Powerpoint And Google Slides Cpb are topically designed to provide an attractive backdrop to any subject. Use them to look like a presentation pro.
True Price Action Indicator In Powerpoint And Google Slides Cpb
Introducing our well-designed True Price Action Indicator In Powerpoint And Google Slides Cpb. This PowerPoint design presents information on topics like True Price Action Indicator. As it is predesigned it helps boost your confidence level. It also makes you a better presenter because of its high-quality content and graphics. This PPT layout can be downloaded and used in different formats like PDF, PNG, and JPG. Not only this, it is available in both Standard Screen and Widescreen aspect ratios for your convenience. Therefore, click on the download button now to persuade and impress your audience. Our True Price Action Indicator In Powerpoint And Google Slides Cpb are topically designed to provide an attractive backdrop to any subject. Use them to look like a presentation pro.
Synchronized Cardioversion Indications In Powerpoint And Google Slides Cpb
Introducing our well designed Synchronized Cardioversion Indications In Powerpoint And Google Slides Cpb. This PowerPoint design presents information on topics like Synchronized Cardioversion Indications. As it is predesigned it helps boost your confidence level. It also makes you a better presenter because of its high-quality content and graphics. This PPT layout can be downloaded and used in different formats like PDF, PNG, and JPG. Not only this, it is available in both Standard Screen and Widescreen aspect ratios for your convenience. Therefore, click on the download button now to persuade and impress your audience. Our Synchronized Cardioversion Indications In Powerpoint And Google Slides Cpb are topically designed to provide an attractive backdrop to any subject. Use them to look like a presentation pro.
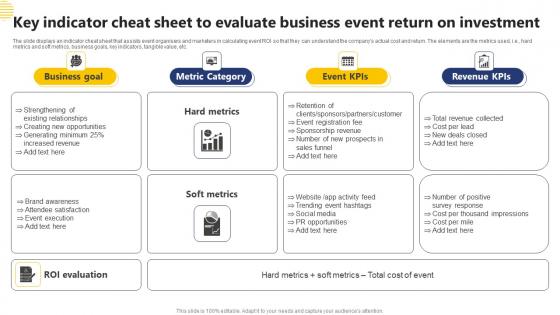
Key Indicator Cheat Sheet To Evaluate Business Event Return On Investment Template Pdf
The slide displays an indicator cheat sheet that assists event organisers and marketers in calculating event ROI so that they can understand the companys actual cost and return. The elements are the metrics used, i.e., hard metrics and soft metrics, business goals, key indicators, tangible value, etc. Showcasing this set of slides titled Key Indicator Cheat Sheet To Evaluate Business Event Return On Investment Template Pdf The topics addressed in these templates are Business Goal, Metric Category, Revenue KPIS All the content presented in this PPT design is completely editable. Download it and make adjustments in color, background, font etc. as per your unique business setting. The slide displays an indicator cheat sheet that assists event organisers and marketers in calculating event ROI so that they can understand the companys actual cost and return. The elements are the metrics used, i.e., hard metrics and soft metrics, business goals, key indicators, tangible value, etc.
Key Indicator Dashboard Of Vertical Channel Marketing Software Ppt Icon Templates Pdf
This slide showcases the key indicators for vertical channel marketing software. This further includes reach, engagement and conversion data along with geography and industry. Showcasing this set of slides titled Key Indicator Dashboard Of Vertical Channel Marketing Software Ppt Icon Templates Pdf. The topics addressed in these templates are Reach, Engagement, Conversion. All the content presented in this PPT design is completely editable. Download it and make adjustments in color, background, font etc. as per your unique business setting. This slide showcases the key indicators for vertical channel marketing software. This further includes reach, engagement and conversion data along with geography and industry.
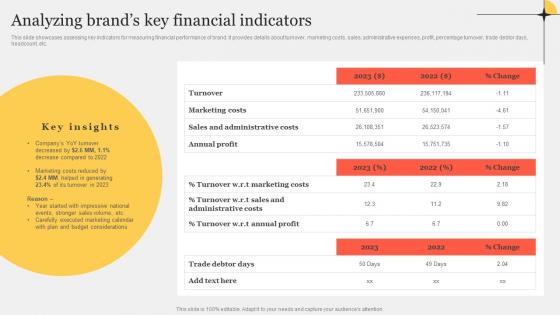
Analyzing Brands Key Financial Indicators Improving Customer Interaction Through Microsoft Pdf
This slide showcases assessing key indicators for measuring financial performance of brand. It provides details about turnover, marketing costs, sales, administrative expenses, profit, percentage turnover, trade debtor days, headcount, etc.Find highly impressive Analyzing Brands Key Financial Indicators Improving Customer Interaction Through Microsoft Pdf on Slidegeeks to deliver a meaningful presentation. You can save an ample amount of time using these presentation templates. No need to worry to prepare everything from scratch because Slidegeeks experts have already done a huge research and work for you. You need to download Analyzing Brands Key Financial Indicators Improving Customer Interaction Through Microsoft Pdf for your upcoming presentation. All the presentation templates are 100Precent editable and you can change the color and personalize the content accordingly. Download now. This slide showcases assessing key indicators for measuring financial performance of brand. It provides details about turnover, marketing costs, sales, administrative expenses, profit, percentage turnover, trade debtor days, headcount, etc.
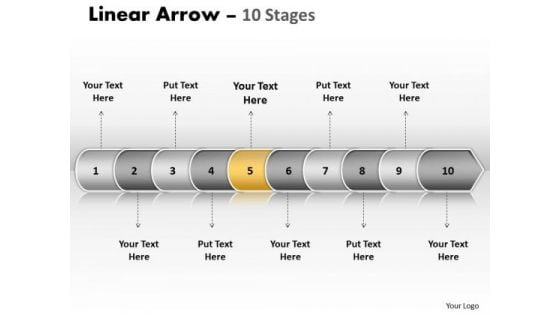
Usa Ppt Background Linear Arrow 10 State PowerPoint Project Diagram 6 Image
USA PPT Background linear arrow 10 state powerpoint project diagram 6 Image-Use this diagram to display your ideas and highlight their ability to accelerate the growth of your company and you. Impress upon the audience how your strategy will carry all to the top of the corporate heap.-USA PPT Background linear arrow 10 state powerpoint project diagram 6 Image-Arrow, Background, Collection, Completed, Concept, Confirmation, Design, Flow, Graph, Graphic, Illustration, Indication, Indicator, Information, Instruction, Interface, Internet, Layout, Measurement, Order, Phase, Pointer, Process, Progress, Reflection, Scale, Shape, Sign Our Usa Ppt Background Linear Arrow 10 State PowerPoint Project Diagram 6 Image will go on till blue in the face. They will keep at it till you achieve your aim.
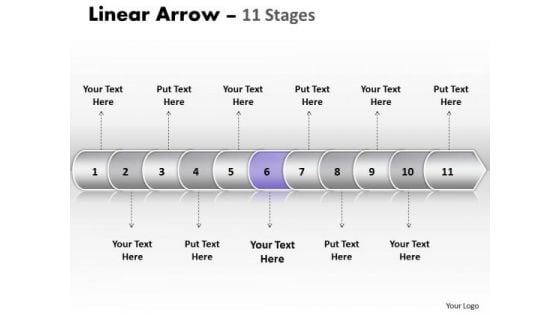
Usa Ppt Template Linear Arrow 11 Phase Diagram Time Management PowerPoint 7 Design
USA PPT template linear arrow 11 phase diagram time management powerpoint 7 design-This diagram is capable of conveying the important characteristics more plainly than what words are capable of doing. Feel the buzz as they comprehend your plan to get the entire act together.-USA PPT template linear arrow 11 phase diagram time management powerpoint 7 design-Arrow, Background, Collection, Completed, Concept, Confirmation, Design, Flow, Graph, Graphic, Illustration, Indication, Indicator, Information, Instruction, Interface, Internet, Layout, Measurement, Order, Phase, Pointer, Process, Progress, Reflection, Scale, Shape, Sign The impact of your ideas will take time to fade. The images of our Usa Ppt Template Linear Arrow 11 Phase Diagram Time Management PowerPoint 7 Design will help their recall.
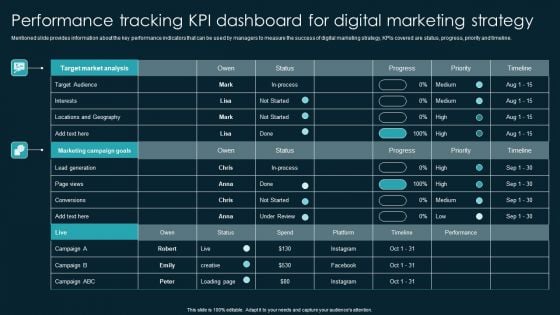
Performance Tracking KPI Dashboard For Digital Marketing Strategy Ppt Icon Slideshow PDF
Mentioned slide provides information about the key performance indicators that can be used by managers to measure the success of digital marketing strategy, KPIs covered are status, progress, priority and timeline. This Performance Tracking KPI Dashboard For Digital Marketing Strategy Ppt Icon Slideshow PDF from Slidegeeks makes it easy to present information on your topic with precision. It provides customization options, so you can make changes to the colors, design, graphics, or any other component to create a unique layout. It is also available for immediate download, so you can begin using it right away. Slidegeeks has done good research to ensure that you have everything you need to make your presentation stand out. Make a name out there for a brilliant performance.
Performance Tracking KPI Dashboard For Digital Marketing Strategy Topics PDF

Like Button Social Network Internet PowerPoint Templates And PowerPoint Themes 1012
Like Button Social Network Internet PowerPoint Templates And PowerPoint Themes 1012-This PowerPoint Template shows the Like Button made using keyboard which signifies the Social Networking sites that are Facebook, Twitter, orkut etc. This Template will let you explain the importance of social networking sites. It indicates communal, community, common, societal, public, shared, collective, group etc. You have reached an important crossroad in your business progress. You have many different options available to you.-Like Button Social Network Internet PowerPoint Templates And PowerPoint Themes 1012-This PowerPoint template can be used for presentations relating to-Keyboard With Blue Like Button, Social Network Concept, Technology, Symbol, Internet, Computer, Shapes Develop their craving for your creativity. Become a brand name with our Like Button Social Network Internet PowerPoint Templates And PowerPoint Themes 1012.
Deploying Cyber Security Incident Response Administration Enterprise Cyber Risk Management Dashboard Icons PDF
This slide represents the key metrics dashboard representing details related to management of cyber security incidents by an enterprise. It includes key performance indicators such as risk analysis progress, risk rating breakdown etc. Whether you have daily or monthly meetings, a brilliant presentation is necessary. Deploying Cyber Security Incident Response Administration Enterprise Cyber Risk Management Dashboard Icons PDF can be your best option for delivering a presentation. Represent everything in detail using Deploying Cyber Security Incident Response Administration Enterprise Cyber Risk Management Dashboard Icons PDF and make yourself stand out in meetings. The template is versatile and follows a structure that will cater to your requirements. All the templates prepared by Slidegeeks are easy to download and edit. Our research experts have taken care of the corporate themes as well. So, give it a try and see the results.
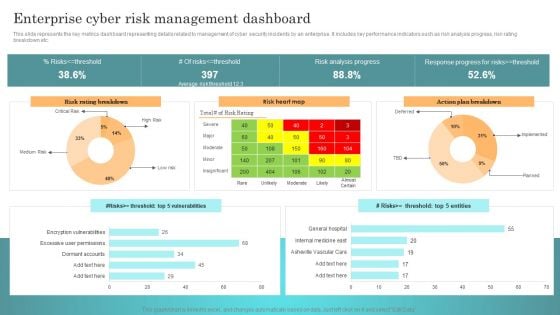
Incident Response Techniques Deployement Enterprise Cyber Risk Management Dashboard Rules PDF
This slide represents the key metrics dashboard representing details related to management of cyber security incidents by an enterprise. It includes key performance indicators such as risk analysis progress, risk rating breakdown etc. Find highly impressive Incident Response Techniques Deployement Enterprise Cyber Risk Management Dashboard Rules PDF on Slidegeeks to deliver a meaningful presentation. You can save an ample amount of time using these presentation templates. No need to worry to prepare everything from scratch because Slidegeeks experts have already done a huge research and work for you. You need to download Incident Response Techniques Deployement Enterprise Cyber Risk Management Dashboard Rules PDF for your upcoming presentation. All the presentation templates are 100 percent editable and you can change the color and personalize the content accordingly. Download now.

 Home
Home