Report Infographics Template
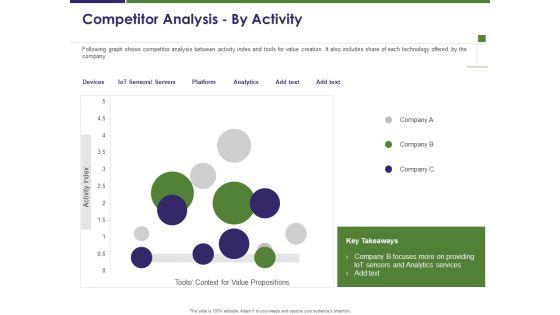
Business Intelligence Report Competitor Analysis By Activity Ppt Infographics Design Inspiration PDF
Presenting this set of slides with name business intelligence report competitor analysis by activity ppt infographics design inspiration pdf. The topics discussed in these slides are devices, servers, platform, analytics, technology. This is a completely editable PowerPoint presentation and is available for immediate download. Download now and impress your audience.
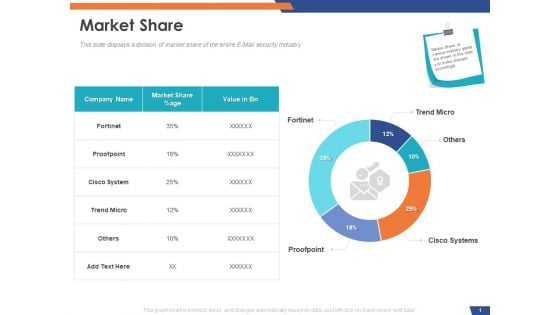
Email Security Market Research Report Market Share Ppt Show Infographics PDF
Presenting this set of slides with name email security market research report market share ppt show infographics pdf. The topics discussed in these slides are company name, market share, value. This is a completely editable PowerPoint presentation and is available for immediate download. Download now and impress your audience.
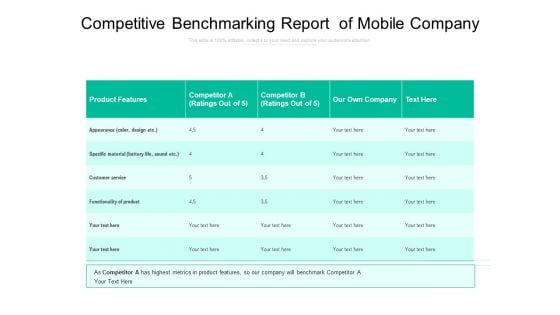
Competitive Benchmarking Report Of Mobile Company Ppt PowerPoint Presentation Infographics Pictures PDF
Presenting this set of slides with name competitive benchmarking report of mobile company ppt powerpoint presentation infographics pictures pdf. The topics discussed in these slides are product features, competitor ratings out, our own company, customer service, functionality of product. This is a completely editable PowerPoint presentation and is available for immediate download. Download now and impress your audience.

Project Budget Utilization Report With Name And Type Ppt PowerPoint Presentation Infographics PDF
Presenting this set of slides with name project budget utilization report with name and type ppt powerpoint presentation infographics pdf. The topics discussed in these slides are budget, budget type, current, budgeted, forecasted, current vs budgeted, forecasted vs budgeted, project abc, project pqr, investment, expenditure. This is a completely editable PowerPoint presentation and is available for immediate download. Download now and impress your audience.
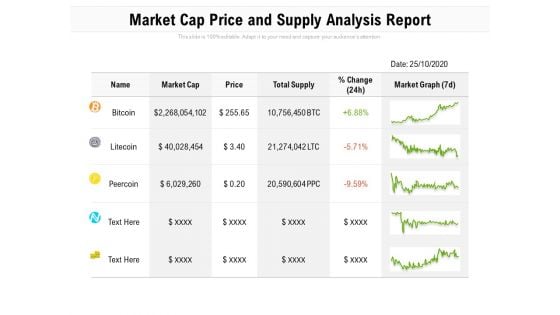
Market Cap Price And Supply Analysis Report Ppt PowerPoint Presentation Infographics Picture PDF
Presenting this set of slides with name market cap price and supply analysis report ppt powerpoint presentation infographics picture pdf. The topics discussed in these slides are market cap, price, total supply, market graph. This is a completely editable PowerPoint presentation and is available for immediate download. Download now and impress your audience.
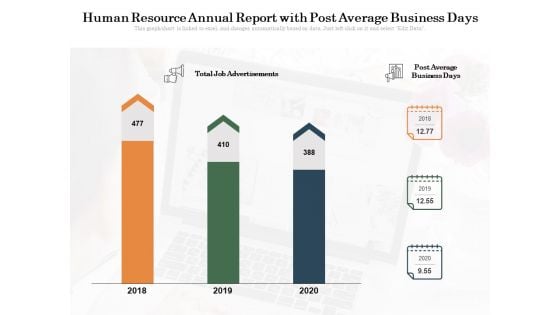
Human Resource Annual Report With Post Average Business Days Ppt PowerPoint Presentation Infographics Display PDF
Presenting this set of slides with name human resource annual report with post average business days ppt powerpoint presentation infographics display pdf. The topics discussed in these slides are post average business days, 2018 to 2020, total job advertisement. This is a completely editable PowerPoint presentation and is available for immediate download. Download now and impress your audience.
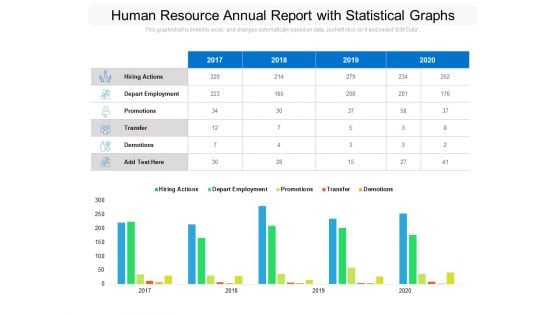
Human Resource Annual Report With Statistical Graphs Ppt PowerPoint Presentation Infographics Shapes PDF
Presenting this set of slides with name human resource annual report with statistical graphs ppt powerpoint presentation infographics shapes pdf. The topics discussed in these slides are hiring actions, depart employment, promotions, transfer, demotions, 2017 to 2020. This is a completely editable PowerPoint presentation and is available for immediate download. Download now and impress your audience.
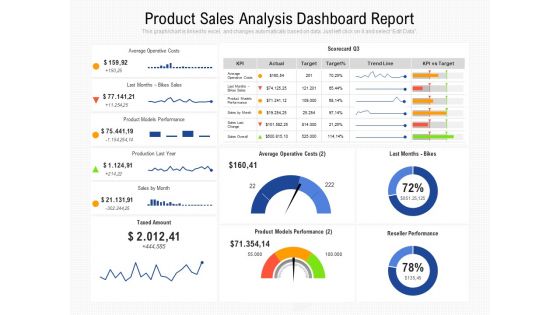
Product Sales Analysis Dashboard Report Ppt PowerPoint Presentation Infographics Graphics Pictures PDF
Presenting this set of slides with name product sales analysis dashboard report ppt powerpoint presentation infographics graphics pictures pdf. The topics discussed in these slides are average operative costs, product models performance, production last year, sales by month, taxed amount. This is a completely editable PowerPoint presentation and is available for immediate download. Download now and impress your audience.
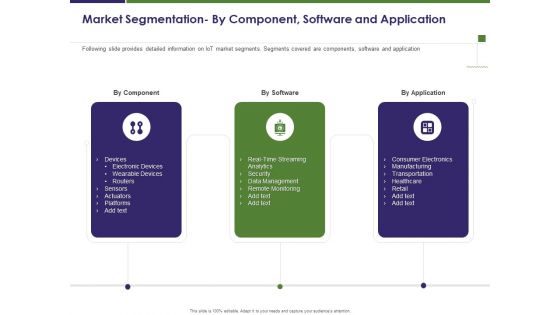
Business Intelligence Report Market Segmentation By Component Software And Application Ppt Infographics Examples PDF
Presenting this set of slides with name business intelligence report market segmentation by component software and application ppt infographics examples pdf. This is a three stage process. The stages in this process are component, software, application. This is a completely editable PowerPoint presentation and is available for immediate download. Download now and impress your audience.
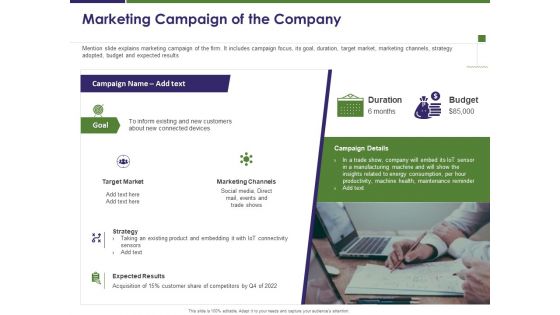
Business Intelligence Report Marketing Campaign Of The Company Ppt Infographics Rules PDF
Presenting this set of slides with name business intelligence report marketing campaign of the company ppt infographics rules pdf. This is a one stage process. The stages in this process are target market, strategy, expected results, marketing channels, duration, budget. This is a completely editable PowerPoint presentation and is available for immediate download. Download now and impress your audience.
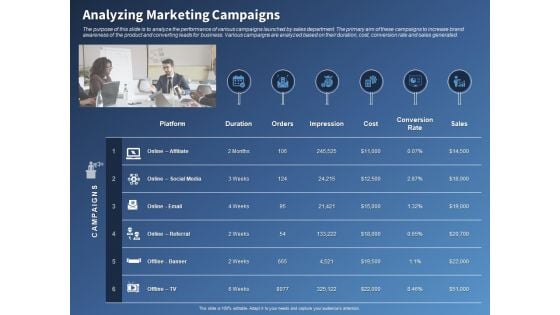
Performance Assessment And Sales Initiative Report Analyzing Marketing Campaigns Ppt Infographics Background Designs PDF
Presenting this set of slides with name performance assessment and sales initiative report analyzing marketing campaigns ppt infographics background designs pdf. This is a six stage process. The stages in this process are social media, duration, banner, referral, cost. This is a completely editable PowerPoint presentation and is available for immediate download. Download now and impress your audience.
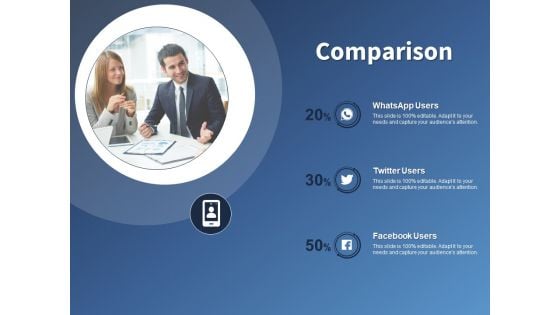
Performance Assessment And Sales Initiative Report Comparison Ppt Infographics Designs PDF
Presenting this set of slides with name performance assessment and sales initiative report comparison ppt infographics designs pdf. This is a three stage process. The stages in this process are whatsapp users, twitter users, facebook users. This is a completely editable PowerPoint presentation and is available for immediate download. Download now and impress your audience.
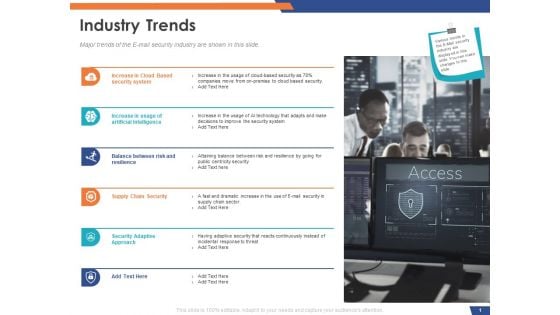
Email Security Market Research Report Industry Trends Ppt Infographics Styles PDF
Presenting this set of slides with name email security market research report industry trends ppt infographics styles pdf. This is a six stage process. The stages in this process are balance between risk and resilience, supply chain security, security adaptive approach. This is a completely editable PowerPoint presentation and is available for immediate download. Download now and impress your audience.
Gym Health And Fitness Market Industry Report Idea Generation Ppt PowerPoint Presentation Infographics Layout PDF
Presenting this set of slides with name gym health and fitness market industry report idea generation ppt powerpoint presentation infographics layout pdf. This is a three stage process. The stages in this process are idea generation. This is a completely editable PowerPoint presentation and is available for immediate download. Download now and impress your audience.
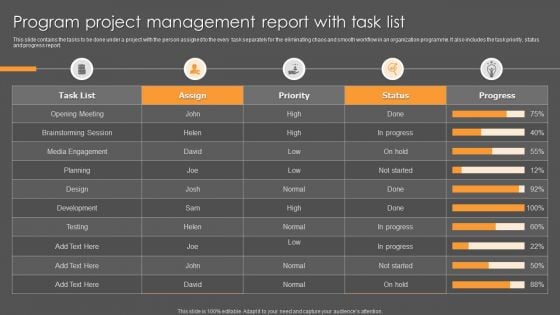
Program Project Management Report With Task List Ppt Infographics Examples PDF
This slide contains the tasks to be done under a project with the person assigned to the every task separately for the eliminating chaos and smooth workflow in an organization programme. It also includes the task priority, status and progress report. Pitch your topic with ease and precision using this Program Project Management Report With Task List Ppt Infographics Examples PDF. This layout presents information on Opening Meeting, Brainstorming Session, Media Engagement. It is also available for immediate download and adjustment. So, changes can be made in the color, design, graphics or any other component to create a unique layout.
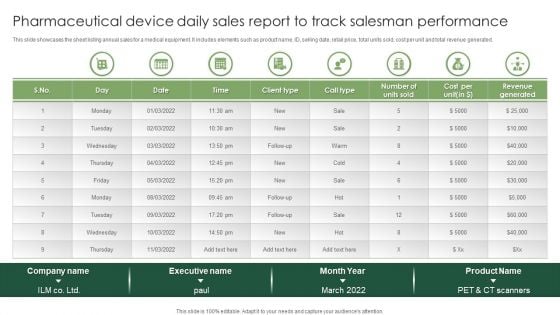
Pharmaceutical Device Daily Sales Report To Track Salesman Performance Infographics PDF
This slide showcases the sheet listing annual sales for a medical equipment. It includes elements such as product name, ID, selling date, retail price, total units sold, cost per unit and total revenue generated. Pitch your topic with ease and precision using this Pharmaceutical Device Daily Sales Report To Track Salesman Performance Infographics PDF. This layout presents information on Pharmaceutical Device Daily, Sales Report To Track, Salesman Performance. It is also available for immediate download and adjustment. So, changes can be made in the color, design, graphics or any other component to create a unique layout.
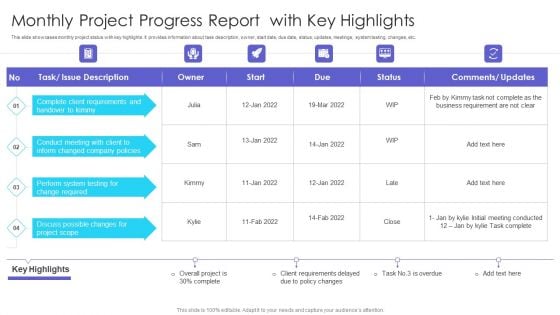
Monthly Project Progress Report With Key Highlights Ppt Infographics Design Ideas PDF
This slide showcases monthly project status with key highlights. It provides information about task description, owner, start date, due date, status, updates, meetings, system testing, changes, etc. Showcasing this set of slides titled Monthly Project Progress Report With Key Highlights Ppt Infographics Design Ideas PDF. The topics addressed in these templates are Business Requirement, Initial Meeting Conducted, Project Scope. All the content presented in this PPT design is completely editable. Download it and make adjustments in color, background, font etc. as per your unique business setting.
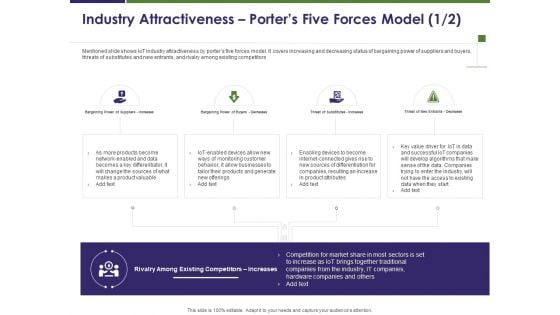
Business Intelligence Report Industry Attractiveness Porters Five Forces Model Increases Ppt Outline Infographics PDF
Presenting this set of slides with name business intelligence report industry attractiveness porters five forces model increases ppt outline infographics pdf. This is a four stage process. The stages in this process are bargaining power of suppliers increases, bargaining power of buyers decreases, threat of substitutes increases, threat of new entrants decreases. This is a completely editable PowerPoint presentation and is available for immediate download. Download now and impress your audience.
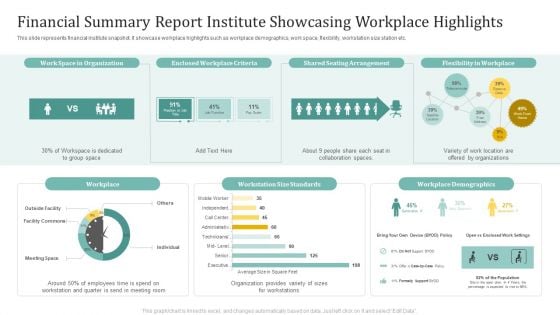
Financial Summary Report Institute Showcasing Workplace Highlights Ppt Infographics Inspiration PDF
This slide represents financial institute snapshot. It showcase workplace highlights such as workplace demographics, work space, flexibility, workstation size station etc. Pitch your topic with ease and precision using this Financial Summary Report Institute Showcasing Workplace Highlights Ppt Infographics Inspiration PDF. This layout presents information on Shared Seating Arrangement, Flexibility Workplace, Workplace. It is also available for immediate download and adjustment. So, changes can be made in the color, design, graphics or any other component to create a unique layout.
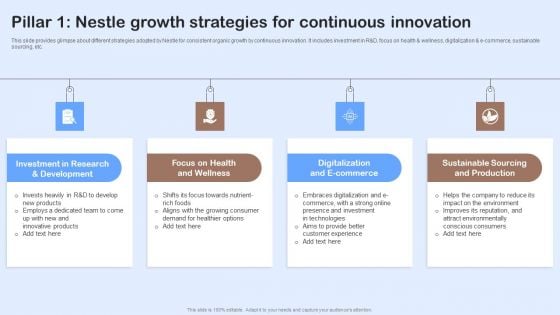
Nestle Performance Management Report Pillar 1 Nestle Growth Strategies For Continuous Infographics PDF
This slide provides glimpse about different strategies adopted by Nestle for consistent organic growth by continuous innovation. It includes investment in RandD, focus on health and wellness, digitalization and e-commerce, sustainable sourcing, etc. Slidegeeks is one of the best resources for PowerPoint templates. You can download easily and regulate Nestle Performance Management Report Pillar 1 Nestle Growth Strategies For Continuous Infographics PDF for your personal presentations from our wonderful collection. A few clicks is all it takes to discover and get the most relevant and appropriate templates. Use our Templates to add a unique zing and appeal to your presentation and meetings. All the slides are easy to edit and you can use them even for advertisement purposes.
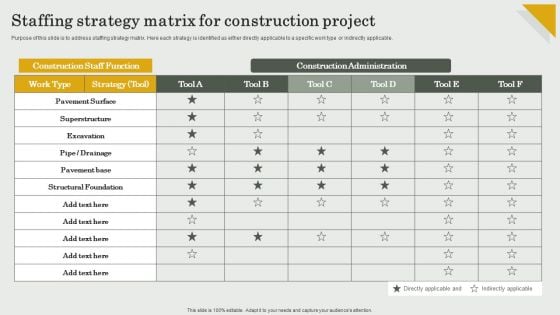
Submission Of Project Viability Report For Bank Loan Staffing Strategy Matrix For Construction Project Infographics PDF
Purpose of this slide is to address staffing strategy matrix. Here each strategy is identified as either directly applicable to a specific work type or indirectly applicable. Slidegeeks have 100 percent editable powerpoint slides making them incredibly versatile. With these quality presentation templates, you can create a captivating and memorable presentation by combining visually appealing slides and effectively communicating your message. Download Submission Of Project Viability Report For Bank Loan Staffing Strategy Matrix For Construction Project Infographics PDF from Slidegeeks and deliver a wonderful presentation.
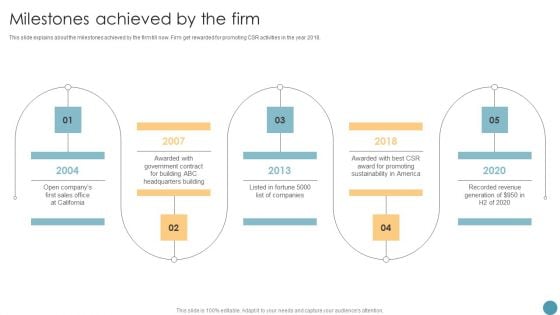
Feasibility Analysis Report For Construction Project Milestones Achieved By The Firm Infographics PDF
This slide explains about the milestones achieved by the firm till now. Firm get rewarded for promoting CSR activities in the year 2018. Make sure to capture your audiences attention in your business displays with our gratis customizable Feasibility Analysis Report For Construction Project Milestones Achieved By The Firm Infographics PDF. These are great for business strategies, office conferences, capital raising or task suggestions. If you desire to acquire more customers for your tech business and ensure they stay satisfied, create your own sales presentation with these plain slides.
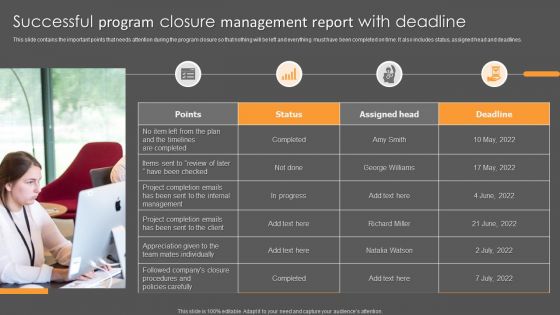
Successful Program Closure Management Report With Deadline Ppt Infographics Visual Aids PDF
This slide contains the important points that needs attention during the program closure so that nothing will be left and everything must have been completed on time. It also includes status, assigned head and deadlines. Persuade your audience using this Successful Program Closure Management Report With Deadline Ppt Infographics Visual Aids PDF. This PPT design covers four stages, thus making it a great tool to use. It also caters to a variety of topics including Assigned Head, Deadline, Project Completion. Download this PPT design now to present a convincing pitch that not only emphasizes the topic but also showcases your presentation skills.
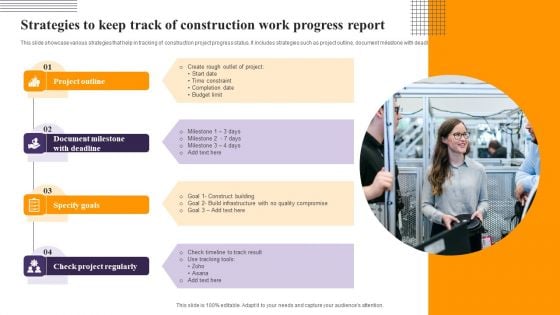
Strategies To Keep Track Of Construction Work Progress Report Infographics PDF
This slide showcase various strategies that help in tracking of construction project progress status. It includes strategies such as project outline, document milestone with deadline, specify goals and check project regularly Persuade your audience using this Strategies To Keep Track Of Construction Work Progress Report Infographics PDF. This PPT design covers four stages, thus making it a great tool to use. It also caters to a variety of topics including Schedule Date, Actual Start Date, Tasks Project Regularly. Download this PPT design now to present a convincing pitch that not only emphasizes the topic but also showcases your presentation skills.
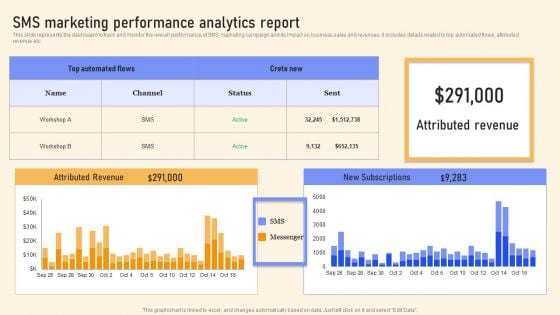
SMS Marketing Performance Analytics Report Ppt PowerPoint Presentation File Infographics PDF
This slide represents the dashboard to track and monitor the overall performance of SMS marketing campaign and its impact on business sales and revenues. It includes details related to top automated flows, attributed revenue etc. Slidegeeks is here to make your presentations a breeze with SMS Marketing Performance Analytics Report Ppt PowerPoint Presentation File Infographics PDF With our easy to use and customizable templates, you can focus on delivering your ideas rather than worrying about formatting. With a variety of designs to choose from, you are sure to find one that suits your needs. And with animations and unique photos, illustrations, and fonts, you can make your presentation pop. So whether you are giving a sales pitch or presenting to the board, make sure to check out Slidegeeks first.
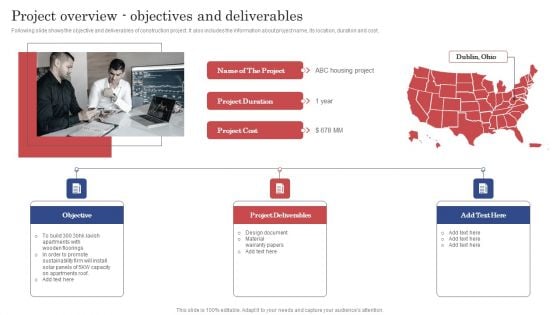
Construction Project Cost Benefit Analysis Report Project Overview Objectives And Deliverables Infographics PDF
Following slide shows the objective and deliverables of construction project. It also includes the information about project name, its location, duration and cost. Slidegeeks is here to make your presentations a breeze with Construction Project Cost Benefit Analysis Report Project Overview Objectives And Deliverables Infographics PDF With our easy to use and customizable templates, you can focus on delivering your ideas rather than worrying about formatting. With a variety of designs to choose from, you are sure to find one that suits your needs. And with animations and unique photos, illustrations, and fonts, you can make your presentation pop. So whether you are giving a sales pitch or presenting to the board, make sure to check out Slidegeeks first.

Nestle Performance Management Report Understanding Business Environment SWOT Analysis Infographics PDF
This slide provides glimpse about SWOT analysis of Nestle SA to compare strengths and weaknesses of company with opportunities and threats from external environment. It includes strengths, weaknesses, opportunities, threats, etc. Slidegeeks is here to make your presentations a breeze with Nestle Performance Management Report Understanding Business Environment SWOT Analysis Infographics PDF With our easy-to-use and customizable templates, you can focus on delivering your ideas rather than worrying about formatting. With a variety of designs to choose from, you are sure to find one that suits your needs. And with animations and unique photos, illustrations, and fonts, you can make your presentation pop. So whether you are giving a sales pitch or presenting to the board, make sure to check out Slidegeeks first.
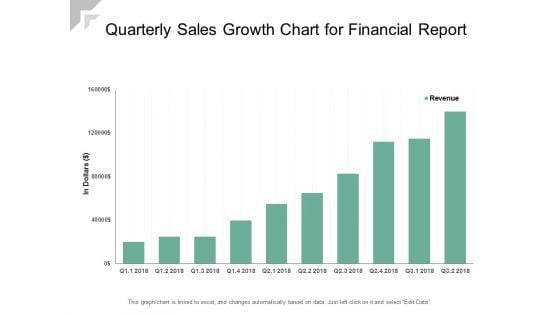
Quarterly Sales Growth Chart For Financial Report Ppt PowerPoint Presentation Ideas Infographics
Presenting this set of slides with name quarterly sales growth chart for financial report ppt powerpoint presentation ideas infographics. The topics discussed in these slides are revenue trend, bar chart, financial. This is a completely editable PowerPoint presentation and is available for immediate download. Download now and impress your audience.
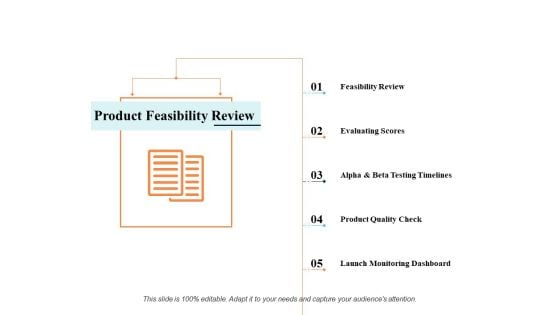
Product Feasibility Review Ppt PowerPoint Presentation Infographics Graphics Template
This is a product feasibility review ppt powerpoint presentation infographics graphics template. This is a five stage process. The stages in this process are marketing, business, management.
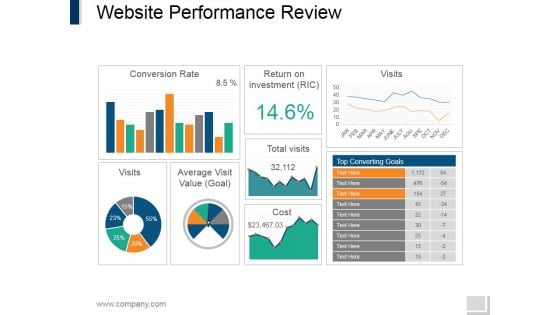
Website Performance Review Template 2 Ppt PowerPoint Presentation Infographics Vector
This is a website performance review template 2 ppt powerpoint presentation infographics vector. This is a three stage process. The stages in this process are conversion rate, return on investment, visits, average visit value, total visits.
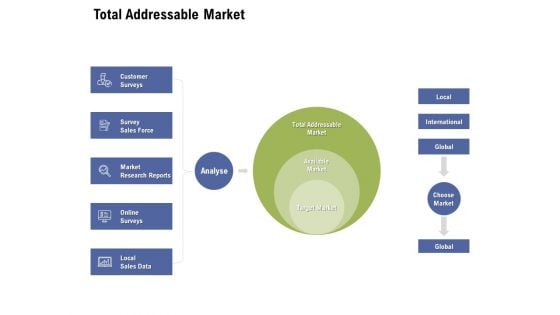
Total Addressable Market Ppt PowerPoint Presentation Infographics Template
Presenting this set of slides with name total addressable market ppt powerpoint presentation infographics template. This is a three stage process. The stages in this process are customer surveys, survey sales force, market research reports, online surveys, local, sales data, target market, total addressable market, choose market, global, international. This is a completely editable PowerPoint presentation and is available for immediate download. Download now and impress your audience.
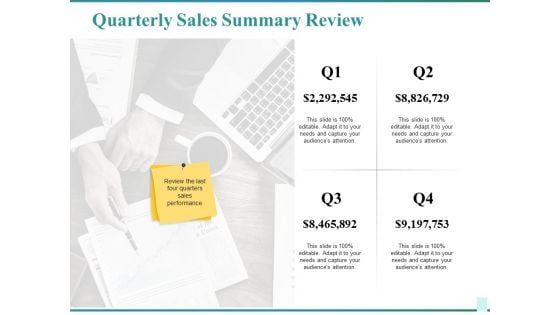
Quarterly Sales Summary Review Ppt PowerPoint Presentation Infographics Graphics Template
This is a quarterly sales summary review ppt powerpoint presentation infographics graphics template. This is a four stage process. The stages in this process are business, marketing, review, management, planning.
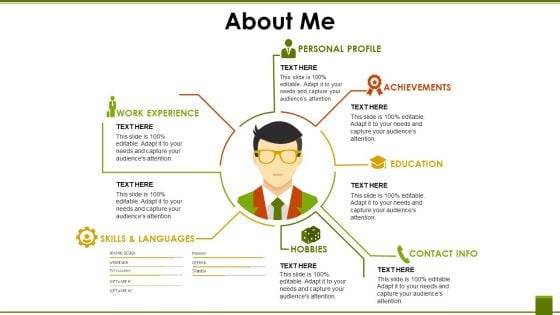
About Me Template 2 Ppt PowerPoint Presentation Infographics Mockup
Business Milestones Goal Achievement Icon Ppt Infographics Template PDF
Persuade your audience using this Business Milestones Goal Achievement Icon Ppt Infographics Template PDF. This PPT design covers three stages, thus making it a great tool to use. It also caters to a variety of topics including Business Milestones, Goal Achievement, Icon. Download this PPT design now to present a convincing pitch that not only emphasizes the topic but also showcases your presentation skills.
Online Distribution Services Icons Slide Ppt Infographics Graphics Template PDF
Introducing our well designed online distribution services icons slide ppt infographics graphics template pdf set of slides. The slide displays editable icons to enhance your visual presentation. The icons can be edited easily. So customize according to your business to achieve a creative edge. Download and share it with your audience.
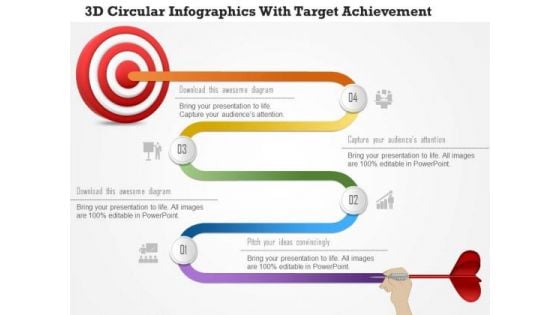
Business Diagram 3d Circular Infographics With Target Achievement PowerPoint Template
This power point template has been crafted with graphic of 3d circular info graphics. This PPT slide contains the concept of data representation and target achievement. This PPT can be used for target and success related presentations.
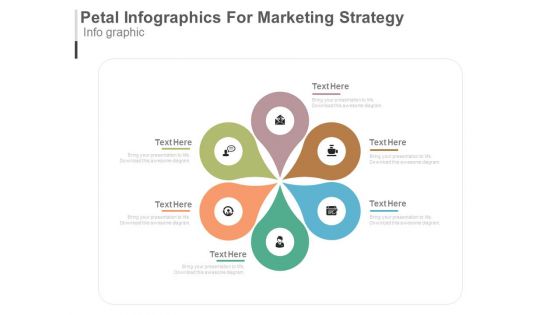
Six Steps Circular Infographics For Marketing Strategy Powerpoint Template
Create visually amazing presentations with slide of circular infographic chart. This business slide may be used to depict six steps of marketing strategy. You may use this slide to share a plan to achieve the desired goals.
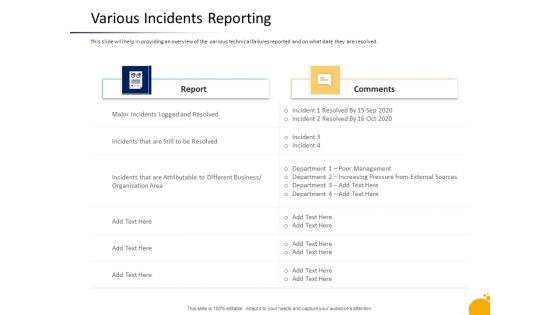
Crisis Management Program Presentation Various Incidents Reporting Infographics PDF
This slide will help in providing an overview of the various technical failures reported and on what date they are resolved. Deliver and pitch your topic in the best possible manner with this crisis management program presentation various incidents reporting infographics pdf. Use them to share invaluable insights on report, comments, external sources, different business, organization area and impress your audience. This template can be altered and modified as per your expectations. So, grab it now.
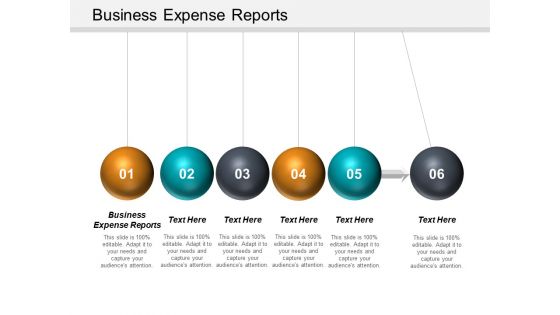
Business Expense Reports Ppt PowerPoint Presentation Infographics Slide Cpb
This is a business expense reports ppt powerpoint presentation infographics slide cpb. This is a six stage process. The stages in this process are business expense reports.
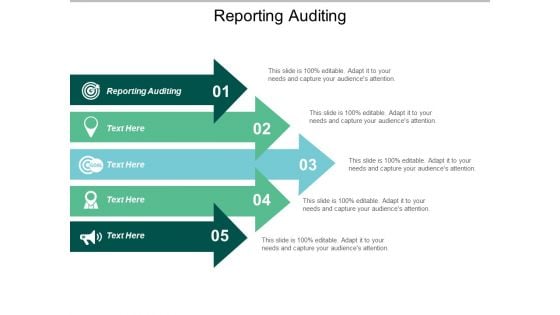
Reporting Auditing Ppt PowerPoint Presentation Infographics Slides Cpb
This is a reporting auditing ppt powerpoint presentation infographics slides cpb. This is a five stage process. The stages in this process are reporting auditing.
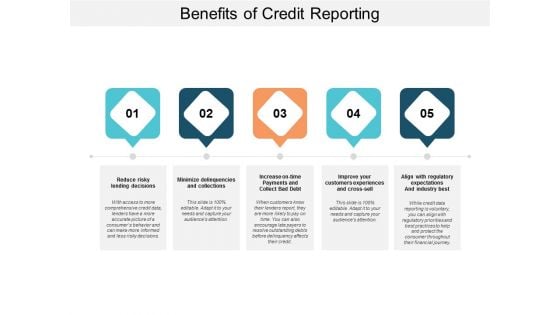
Benefits Of Credit Reporting Ppt PowerPoint Presentation Infographics Brochure
Presenting this set of slides with name benefits of credit reporting ppt powerpoint presentation infographics brochure. This is a five stage process. The stages in this process are data report, infographics brochure, business statement. This is a completely editable PowerPoint presentation and is available for immediate download. Download now and impress your audience.
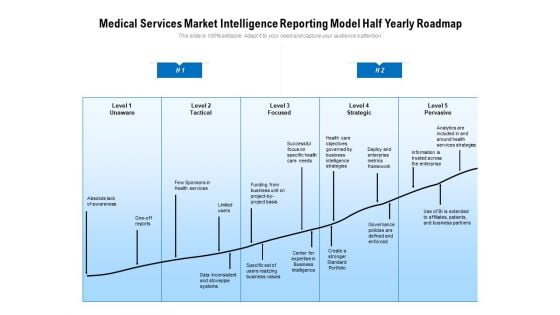
Medical Services Market Intelligence Reporting Model Half Yearly Roadmap Infographics
Introducing our medical services market intelligence reporting model half yearly roadmap infographics. This PPT presentation is Google Slides compatible, therefore, you can share it easily with the collaborators for measuring the progress. Also, the presentation is available in both standard screen and widescreen aspect ratios. So edit the template design by modifying the font size, font type, color, and shapes as per your requirements. As this PPT design is fully editable it can be presented in PDF, JPG and PNG formats.
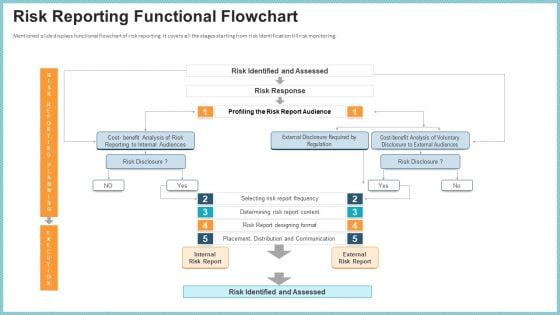
OP Risk Management Risk Reporting Functional Flowchart Infographics PDF
Mentioned slide displays functional flowchart of risk reporting. It covers all the stages starting from risk identification till risk monitoring. Deliver an awe inspiring pitch with this creative op risk management risk reporting functional flowchart infographics pdf bundle. Topics like internal risk report, external risk report, risk identified and assessed can be discussed with this completely editable template. It is available for immediate download depending on the needs and requirements of the user.
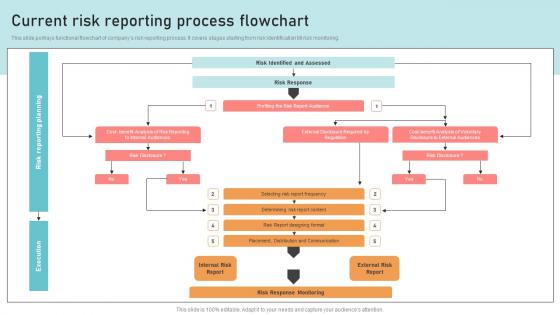
Optimizing Business Integration Current Risk Reporting Process Infographics Pdf
This slide portrays functional flowchart of companys risk reporting process. It covers stages starting from risk identification till risk monitoring. Present like a pro with Optimizing Business Integration Current Risk Reporting Process Infographics Pdf Create beautiful presentations together with your team, using our easy to use presentation slides. Share your ideas in real time and make changes on the fly by downloading our templates. So whether you are in the office, on the go, or in a remote location, you can stay in sync with your team and present your ideas with confidence. With Slidegeeks presentation got a whole lot easier. Grab these presentations today. This slide portrays functional flowchart of companys risk reporting process. It covers stages starting from risk identification till risk monitoring.
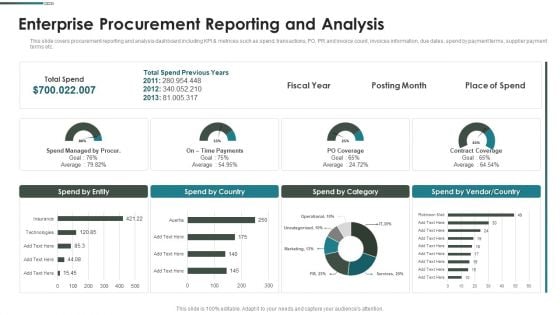
Purchase Assessment Process Enterprise Procurement Reporting And Analysis Infographics PDF
This slide covers procurement reporting and analysis dashboard including KPI metrices such as spend, transactions, PO, PR and invoice count, invoices information, due dates, spend by payment terms, supplier payment terms etc. Deliver an awe inspiring pitch with this creative Purchase Assessment Process Enterprise Procurement Reporting And Analysis Infographics PDF bundle. Topics like Spend Entity, Spend Country, Spend Category can be discussed with this completely editable template. It is available for immediate download depending on the needs and requirements of the user.
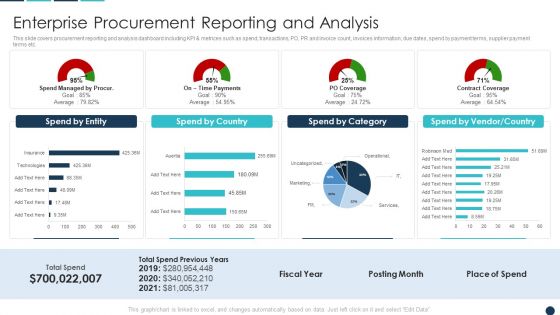
Procurement Analytics Tools And Strategies Enterprise Procurement Reporting Infographics PDF
This slide covers procurement reporting and analysis dashboard including KPI metrices such as spend, transactions, PO, PR and invoice count, invoices information, due dates, spend by payment terms, supplier payment terms etc. Deliver an awe inspiring pitch with this creative Procurement Analytics Tools And Strategies Enterprise Procurement Reporting Infographics PDF bundle. Topics like Spend By Country, Spend Category, Vendor Country can be discussed with this completely editable template. It is available for immediate download depending on the needs and requirements of the user.
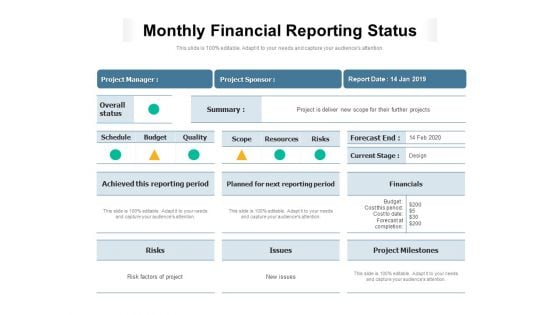
Monthly Financial Reporting Status Ppt PowerPoint Presentation Infographics Diagrams PDF
Presenting this set of slides with name monthly financial reporting status ppt powerpoint presentation infographics diagrams pdf. The topics discussed in these slides are resources, risks, project milestones, quality, scope, overall status. This is a completely editable PowerPoint presentation and is available for immediate download. Download now and impress your audience.
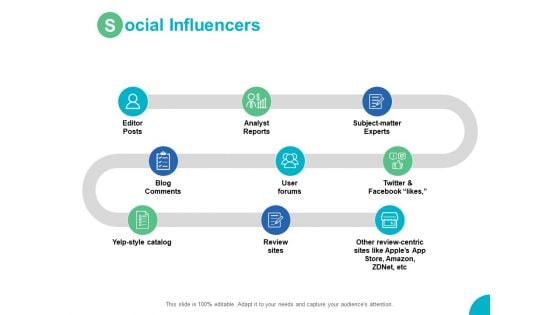
Social Influencers Analyst Reports Ppt PowerPoint Presentation Infographics Mockup
Presenting this set of slides with name social influencers analyst reports ppt powerpoint presentation infographics mockup. This is a nine stage process. The stages in this process are marketing, business, management, planning, strategy. This is a completely editable PowerPoint presentation and is available for immediate download. Download now and impress your audience.
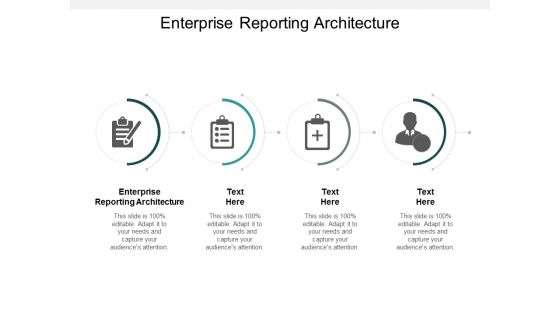
Enterprise Reporting Architecture Ppt Powerpoint Presentation Infographics Ideas Cpb
Presenting this set of slides with name enterprise reporting architecture ppt powerpoint presentation infographics ideas cpb. This is an editable Powerpoint four stages graphic that deals with topics like enterprise reporting architecture to help convey your message better graphically. This product is a premium product available for immediate download and is 100 percent editable in Powerpoint. Download this now and use it in your presentations to impress your audience.

Financial Performance Reports Ppt PowerPoint Presentation Infographics Pictures Cpb
Presenting this set of slides with name financial performance reports ppt powerpoint presentation infographics pictures cpb. This is an editable Powerpoint four stages graphic that deals with topics like financial performance reports to help convey your message better graphically. This product is a premium product available for immediate download and is 100 percent editable in Powerpoint. Download this now and use it in your presentations to impress your audience.
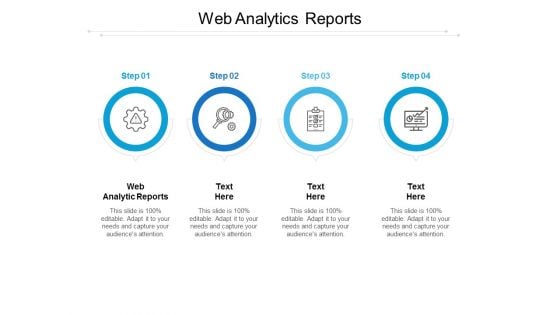
Web Analytics Reports Ppt PowerPoint Presentation Infographics Format Ideas Cpb
Presenting this set of slides with name web analytics reports ppt powerpoint presentation infographics format ideas cpb. This is an editable Powerpoint four stages graphic that deals with topics like web analytics reports to help convey your message better graphically. This product is a premium product available for immediate download and is 100 percent editable in Powerpoint. Download this now and use it in your presentations to impress your audience.
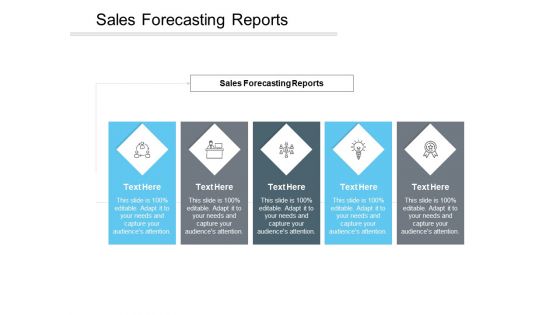
Sales Forecasting Reports Ppt PowerPoint Presentation Infographics Demonstration Cpb
Presenting this set of slides with name sales forecasting reports ppt powerpoint presentation infographics demonstration cpb. This is an editable Powerpoint five stages graphic that deals with topics like sales forecasting reports to help convey your message better graphically. This product is a premium product available for immediate download and is 100 percent editable in Powerpoint. Download this now and use it in your presentations to impress your audience.

Service Level Reporting Ppt PowerPoint Presentation Infographics Ideas Cpb Pdf
Presenting this set of slides with name service level reporting ppt powerpoint presentation infographics ideas cpb pdf. This is an editable Powerpoint three stages graphic that deals with topics like service level reporting to help convey your message better graphically. This product is a premium product available for immediate download and is 100 percent editable in Powerpoint. Download this now and use it in your presentations to impress your audience.
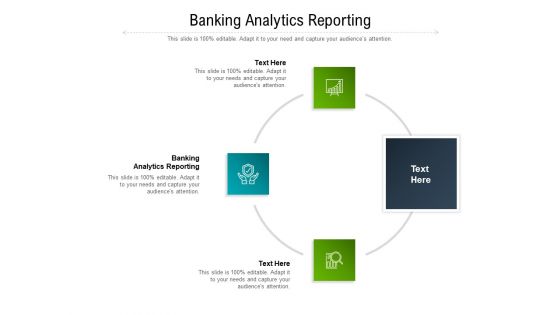
Banking Analytics Reporting Ppt PowerPoint Presentation Infographics Shapes Cpb Pdf
Presenting this set of slides with name banking analytics reporting ppt powerpoint presentation infographics shapes cpb pdf. This is an editable Powerpoint three stages graphic that deals with topics like banking analytics reporting to help convey your message better graphically. This product is a premium product available for immediate download and is 100 percent editable in Powerpoint. Download this now and use it in your presentations to impress your audience.
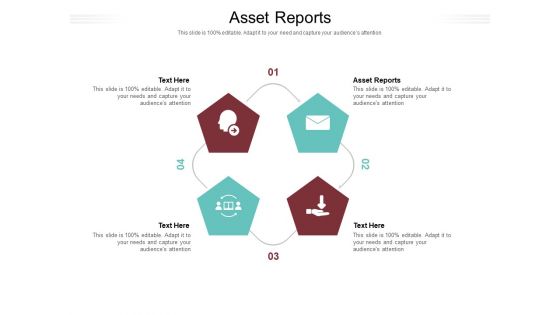
Asset Reports Ppt PowerPoint Presentation Pictures Infographics Cpb Pdf
Presenting this set of slides with name asset reports ppt powerpoint presentation pictures infographics cpb pdf. This is an editable Powerpoint four stages graphic that deals with topics like asset reports to help convey your message better graphically. This product is a premium product available for immediate download and is 100 percent editable in Powerpoint. Download this now and use it in your presentations to impress your audience.
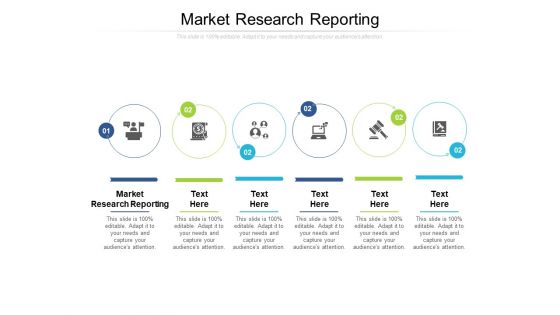
Market Research Reporting Ppt PowerPoint Presentation Infographics Rules Cpb Pdf
Presenting this set of slides with name market research reporting ppt powerpoint presentation infographics rules cpb pdf. This is an editable Powerpoint six stages graphic that deals with topics like market research reporting to help convey your message better graphically. This product is a premium product available for immediate download and is 100 percent editable in Powerpoint. Download this now and use it in your presentations to impress your audience.
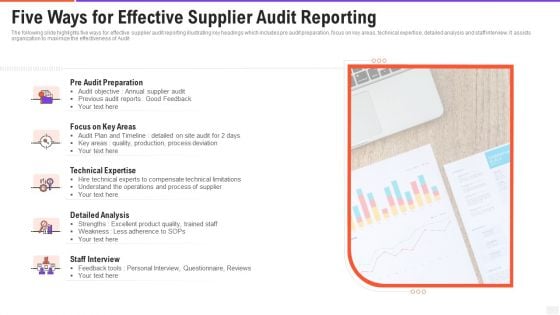
Five Ways For Effective Supplier Audit Reporting Infographics PDF
The following slide highlights five ways for effective supplier audit reporting illustrating key headings which includes pre audit preparation, focus on key areas, technical expertise, detailed analysis and staff interview. It assists organization to maximize the effectiveness of Audit. Persuade your audience using this five ways for effective supplier audit reporting infographics pdf. This PPT design covers five stages, thus making it a great tool to use. It also caters to a variety of topics including focus on key areas technical expertise, detailed analysis. Download this PPT design now to present a convincing pitch that not only emphasizes the topic but also showcases your presentation skills.
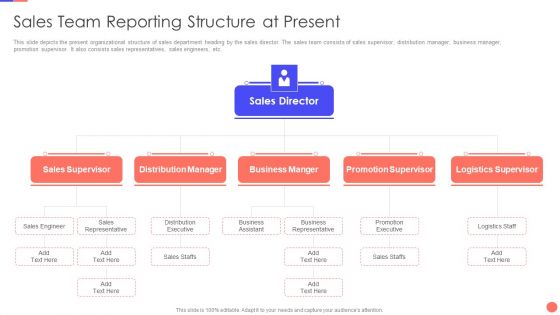
Sales Techniques Playbook Sales Team Reporting Structure At Present Infographics PDF
This is a sales techniques playbook sales team reporting structure at present infographics pdf template with various stages. Focus and dispense information on four stages using this creative set, that comes with editable features. It contains large content boxes to add your information on topics like distribution executive, business assistant, promotion executive, sales staffs. You can also showcase facts, figures, and other relevant content using this PPT layout. Grab it now.
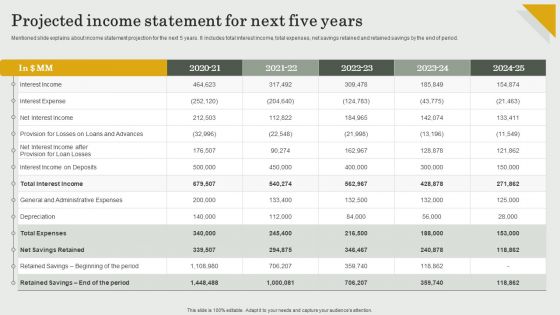
Submission Of Project Viability Report For Bank Loan Projected Income Statement For Next Five Years Infographics PDF
Mentioned slide explains about income statement projection for the next 5 years. It includes total interest income, total expenses, net savings retained and retained savings by the end of period. Welcome to our selection of the Submission Of Project Viability Report For Bank Loan Projected Income Statement For Next Five Years Infographics PDF. These are designed to help you showcase your creativity and bring your sphere to life. Planning and Innovation are essential for any business that is just starting out. This collection contains the designs that you need for your everyday presentations. All of our PowerPoints are 100 percent editable, so you can customize them to suit your needs. This multi-purpose template can be used in various situations. Grab these presentation templates today
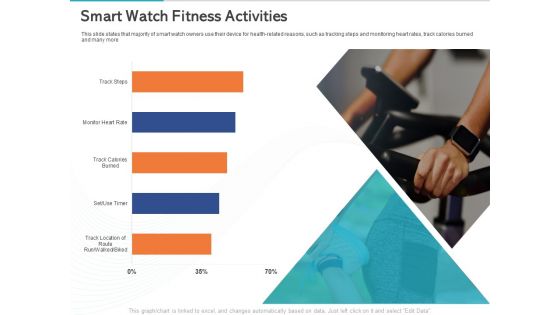
Gym Health And Fitness Market Industry Report Smart Watch Fitness Activities Ppt PowerPoint Presentation Infographics Ideas PDF
Presenting this set of slides with name gym health and fitness market industry report smart watch fitness activities ppt powerpoint presentation infographics ideas pdf. The topics discussed in these slide is smart watch fitness activities. This is a completely editable PowerPoint presentation and is available for immediate download. Download now and impress your audience.

 Home
Home