Results
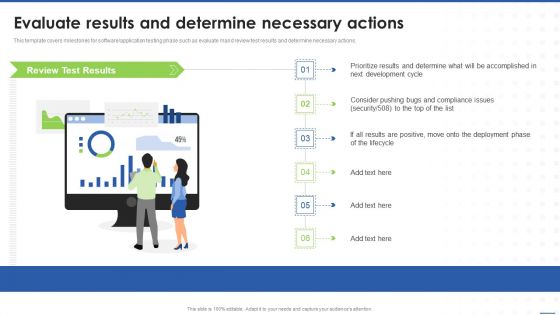
Evaluate Results And Determine Necessary Actions Summary PDF
This template covers milestones for software application testing phase such as evaluate mand review test results and determine necessary actions.This is a Evaluate Results And Determine Necessary Actions Summary PDF template with various stages. Focus and dispense information on two stages using this creative set, that comes with editable features. It contains large content boxes to add your information on topics like Prioritize Results, Next Development, Consider Pushing. You can also showcase facts, figures, and other relevant content using this PPT layout. Grab it now.
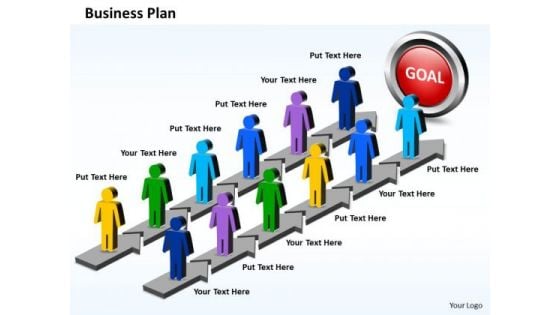
Business Charts PowerPoint Templates Parallel Steps Plan For Achieving Results
Business Charts PowerPoint templates parallel steps plan for achieving results-Use this Parallel Process with six steps in each process to represent a continuing sequence of stages, tasks, or events in a circular flow and emphasize the connection between all components. You can change color, size and orientation of any icon to your liking.-Business Charts PowerPoint templates parallel steps plan for achieving results Communicate goals with our Business Charts PowerPoint Templates Parallel Steps Plan For Achieving Results. Download without worries with our money back guaranteee.

Customer Support Team Performance Audit And Review Results Clipart PDF
This slide covers the customer care department audit results. It includes performance evaluation criteria such as agent name, accepted call legs, declined legs, missed, outbound calls, leg talk time, avg leg talk time, live chat issues resolved, video calls, etc. Deliver an awe inspiring pitch with this creative Customer Support Team Performance Audit And Review Results Clipart PDF bundle. Topics like Audit And Review Results, Customer Support Team Performance can be discussed with this completely editable template. It is available for immediate download depending on the needs and requirements of the user.

Customer Support Team Performance Audit And Review Results Designs PDF
This slide covers the customer care department audit results. It includes performance evaluation criteria such as agent name, accepted call legs, declined legs, missed, outbound calls, leg talk time, avg leg talk time, live chat issues resolved, video calls, etc. Deliver an awe inspiring pitch with this creative Customer Support Team Performance Audit And Review Results Designs PDF bundle. Topics like Customer Support Team, Performance Audit Review Results can be discussed with this completely editable template. It is available for immediate download depending on the needs and requirements of the user.
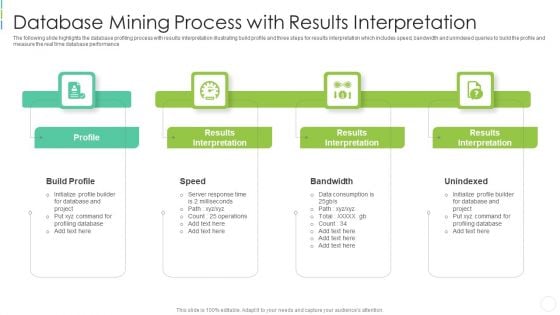
Database Mining Process With Results Interpretation Slides PDF
The following slide highlights the database profiling process with results interpretation illustrating build profile and three steps for results interpretation which includes speed, bandwidth and unindexed queries to build the profile and measure the real time database performance Presenting database mining process with results interpretation slides pdf to dispense important information. This template comprises four stages. It also presents valuable insights into the topics including build profile, bandwidth, response, database . This is a completely customizable PowerPoint theme that can be put to use immediately. So, download it and address the topic impactfully.
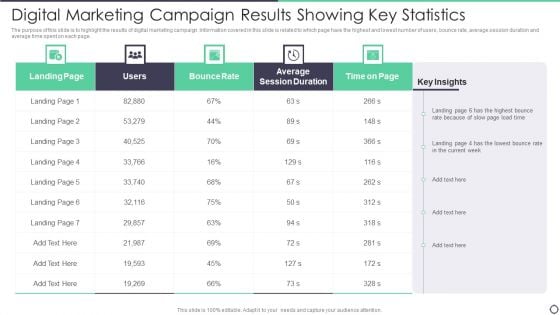
Digital Marketing Campaign Results Showing Key Statistics Rules PDF
The purpose of this slide is to highlight the results of digital marketing campaign. Information covered in this slide is related to which page have the highest and lowest number of users, bounce rate, average session duration and average time spent on each page. Showcasing this set of slides titled Digital Marketing Campaign Results Showing Key Statistics Rules PDF. The topics addressed in these templates are Digital Marketing Campaign Results Showing Key Statistics. All the content presented in this PPT design is completely editable. Download it and make adjustments in color, background, font etc. as per your unique business setting.
Major Statistics Illustrating Digital Marketing Campaign Results Icons PDF
The purpose of this slide is to showcase major statistics of digital marketing results. The statistics covered in the slide are consumers who watch online videos by different age group and the various advertising channels which have the highest conversion rates. Showcasing this set of slides titled Major Statistics Illustrating Digital Marketing Campaign Results Icons PDF. The topics addressed in these templates are Major Statistics Illustrating Digital Marketing Campaign Results. All the content presented in this PPT design is completely editable. Download it and make adjustments in color, background, font etc. as per your unique business setting.

Monthly Report Of Email Marketing Campaign Results Designs PDF
The purpose of this slide is to showcase results of email marketing campaign. Open rate, click through rate, conversion rate, bounce rate and number of unsubscribes are the key metrics which will assist company to measure the performance of email marketing. Showcasing this set of slides titled Monthly Report Of Email Marketing Campaign Results Designs PDF. The topics addressed in these templates are Monthly Report Of Email Marketing Campaign Results. All the content presented in this PPT design is completely editable. Download it and make adjustments in color, background, font etc. as per your unique business setting.
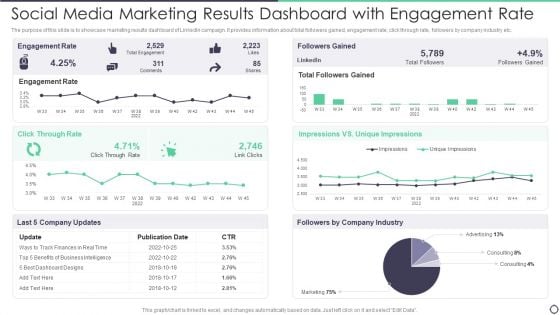
Social Media Marketing Results Dashboard With Engagement Rate Brochure PDF
The purpose of this slide is to showcase marketing results dashboard of LinkedIn campaign. It provides information about total followers gained, engagement rate, click through rate, followers by company industry etc. Pitch your topic with ease and precision using this Social Media Marketing Results Dashboard With Engagement Rate Brochure PDF. This layout presents information on Social Media Marketing Results Dashboard With Engagement Rate. It is also available for immediate download and adjustment. So, changes can be made in the color, design, graphics or any other component to create a unique layout.
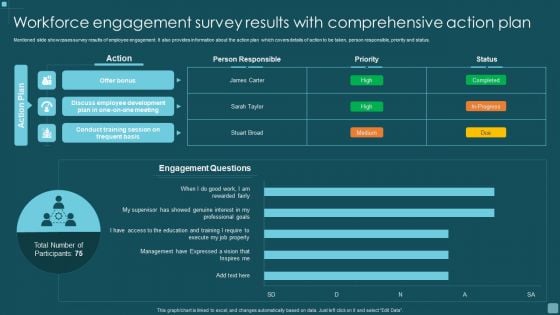
Workforce Engagement Survey Results With Comprehensive Action Plan Rules PDF
Mentioned slide showcases survey results of employee engagement. It also provides information about the action plan which covers details of action to be taken, person responsible, priority and status. Showcasing this set of slides titled Workforce Engagement Survey Results With Comprehensive Action Plan Rules PDF. The topics addressed in these templates are Workforce Engagement Survey Results, Comprehensive Action Plan. All the content presented in this PPT design is completely editable. Download it and make adjustments in color, background, font etc. as per your unique business setting.
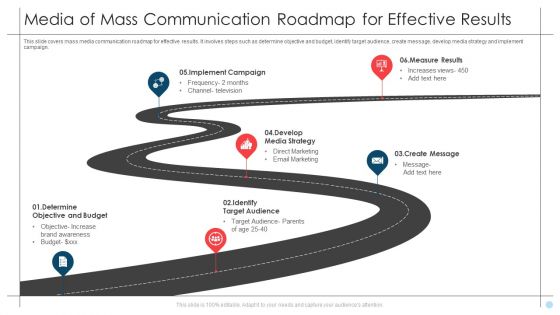
Media Of Mass Communication Roadmap For Effective Results Formats PDF
This slide covers mass media communication roadmap for effective results. It involves steps such as determine objective and budget, identify target audience, create message, develop media strategy and implement campaign. Presenting Media Of Mass Communication Roadmap For Effective Results Formats PDF to dispense important information. This template comprises six stages. It also presents valuable insights into the topics including Implement Campaign, Measure Results, Create Message, Develop Media Strategy. This is a completely customizable PowerPoint theme that can be put to use immediately. So, download it and address the topic impactfully.
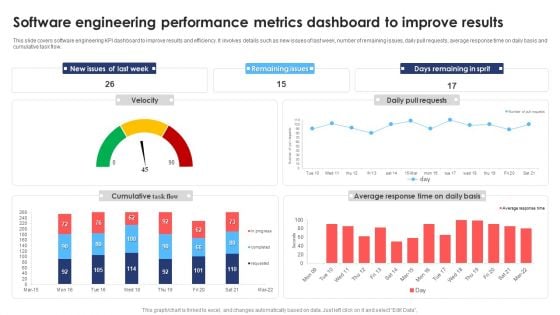
Software Engineering Performance Metrics Dashboard To Improve Results Infographics PDF
This slide covers software engineering KPI dashboard to improve results and efficiency. It involves details such as new issues of last week, number of remaining issues, daily pull requests, average response time on daily basis and cumulative task flow. Pitch your topic with ease and precision using this Software Engineering Performance Metrics Dashboard To Improve Results Infographics PDF. This layout presents information on Software Engineering Performance, Metrics Dashboard Improve Results. It is also available for immediate download and adjustment. So, changes can be made in the color, design, graphics or any other component to create a unique layout.

Digital Marketing Campaign Results With Cost Per Lead Ideas PDF
The purpose of this slide is to outline results of various marketing campaigns. It provides detailed information about campaign name, start date, qualified and disqualified leads, budgeted cost, cost per qualified lead, etc. .Showcasing this set of slides titled Digital Marketing Campaign Results With Cost Per Lead Ideas PDF. The topics addressed in these templates are Digital Marketing Campaign, Results Cost Per Lead. All the content presented in this PPT design is completely editable. Download it and make adjustments in color, background, font etc. as per your unique business setting.
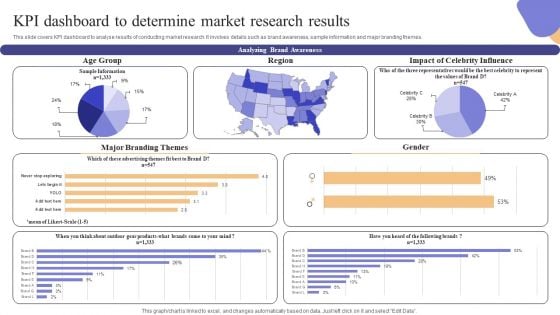
KPI Dashboard To Determine Market Research Results Information PDF
This slide covers KPI dashboard to analyse results of conducting market research. It involves details such as brand awareness, sample information and major branding themes. Crafting an eye-catching presentation has never been more straightforward. Let your presentation shine with this tasteful yet straightforward KPI Dashboard To Determine Market Research Results Information PDF template. It offers a minimalistic and classy look that is great for making a statement. The colors have been employed intelligently to add a bit of playfulness while still remaining professional. Construct the ideal KPI Dashboard To Determine Market Research Results Information PDF that effortlessly grabs the attention of your audience Begin now and be certain to wow your customers
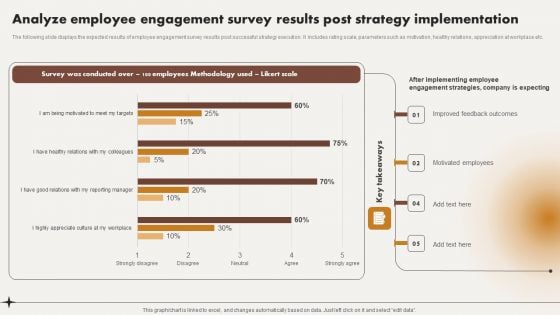
Analyze Employee Engagement Survey Results Post Strategy Implementation Introduction PDF
The following slide displays the expected results of employee engagement survey results post successful strategy execution. It includes rating scale, parameters such as motivation, healthy relations, appreciation at workplace etc. Find a pre designed and impeccable Analyze Employee Engagement Survey Results Post Strategy Implementation Introduction PDF. The templates can ace your presentation without additional effort. You can download these easy to edit presentation templates to make your presentation stand out from others. So, what are you waiting for Download the template from Slidegeeks today and give a unique touch to your presentation.
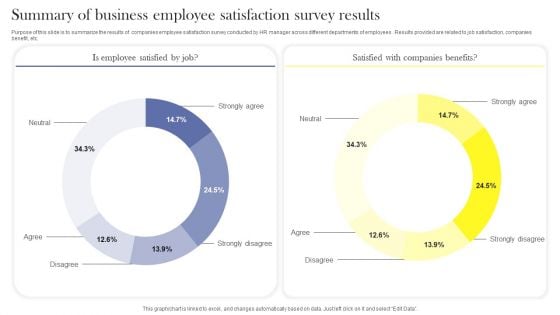
Summary Of Business Employee Satisfaction Survey Results Survey SS
Purpose of this slide is to summarize the results of companies employee satisfaction survey conducted by HR manager across different departments of employees . Results provided are related to job satisfaction, companies benefit, etc. Pitch your topic with ease and precision using this Summary Of Business Employee Satisfaction Survey Results Survey SS. This layout presents information on Neutral, Strongly Agree, Strongly Disagree, Disagree, Agree. It is also available for immediate download and adjustment. So, changes can be made in the color, design, graphics or any other component to create a unique layout.
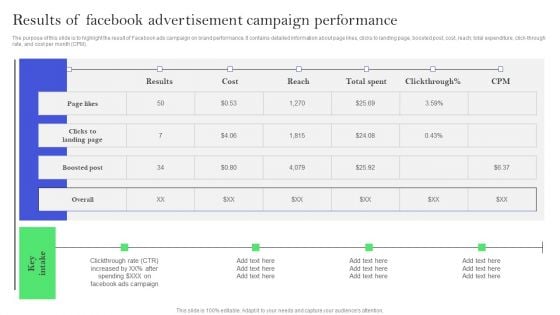
Efficient Facebook Promotion Strategies Results Of Facebook Advertisement Portrait PDF
The purpose of this slide is to highlight the result of Facebook ads campaign on brand performance. It contains detailed information about page likes, clicks to landing page, boosted post, cost, reach, total expenditure, click through rate, and cost per month CPM. Do you have to make sure that everyone on your team knows about any specific topic I yes, then you should give Efficient Facebook Promotion Strategies Results Of Facebook Advertisement Portrait PDF a try. Our experts have put a lot of knowledge and effort into creating this impeccable Efficient Facebook Promotion Strategies Results Of Facebook Advertisement Portrait PDF. You can use this template for your upcoming presentations, as the slides are perfect to represent even the tiniest detail. You can download these templates from the Slidegeeks website and these are easy to edit. So grab these today.
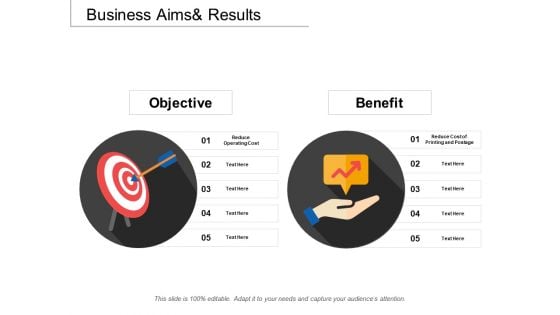
Business Aims And Results Ppt PowerPoint Presentation Portfolio Show
This is a business aims and results ppt powerpoint presentation portfolio show. This is a five stage process. The stages in this process are objective and benefit, goal and benefit, plan and benefit.
Expected Results Benefits Ppt PowerPoint Presentation Styles Model
This is a expected results benefits ppt powerpoint presentation styles model. This is a one stage process. The stages in this process are business, strategy, marketing, analysis, our goal.
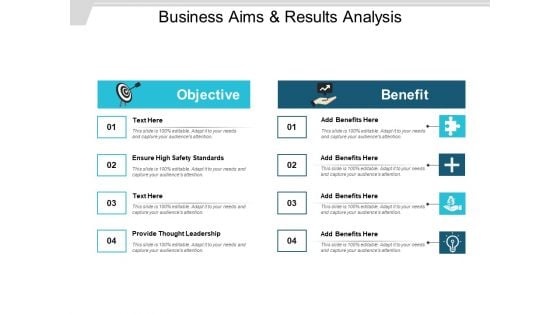
Business Aims And Results Analysis Ppt PowerPoint Presentation Gallery Format
This is a business aims and results analysis ppt powerpoint presentation gallery format. This is a four stage process. The stages in this process are objective and benefit, goal and benefit, plan and benefit.
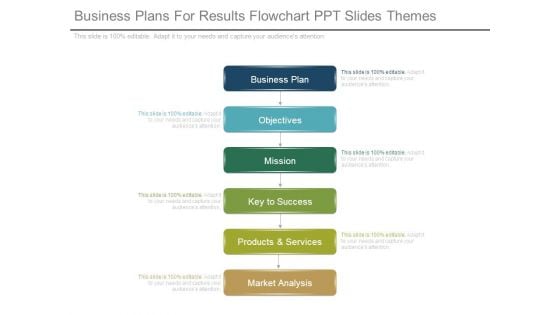
Business Plans For Results Flowchart Ppt Slides Themes
This is a business plans for results flowchart ppt slides themes. This is a six stage process. The stages in this process are business plan, objectives, mission, key to success, products and services, market analysis.

Results Of Success Money PowerPoint Templates And PowerPoint Backgrounds 0411
Microsoft PowerPoint Template and Background with inspiration showing success someone standing out from the crowd. Hit the ground running with our Results Of Success Money PowerPoint Templates And PowerPoint Backgrounds 0411. Your thoughts will get upto speed in a jiffy.

Results Of Success Money PowerPoint Themes And PowerPoint Slides 0411
Microsoft PowerPoint Theme and Slide with inspiration showing success someone standing out from the crowd. Our Results Of Success Money PowerPoint Themes And PowerPoint Slides 0411 are exceptionally adaptive. They will blend in with any scenario.
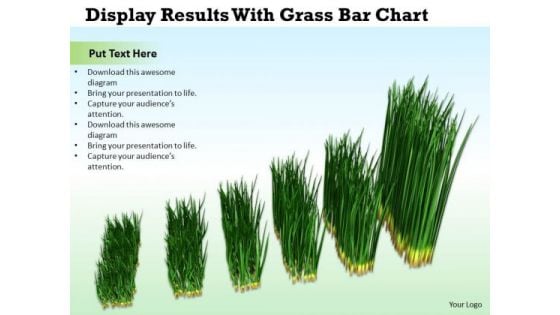
Business And Strategy Display Results With Grass Bar Chart Images
Analyze Ailments On Our business and strategy display results with grass bar chart images Powerpoint Templates. Bring Out The Thinking Doctor In You. Dock Your Thoughts With Our Agriculture Powerpoint Templates. They Will Launch Them Into Orbit.
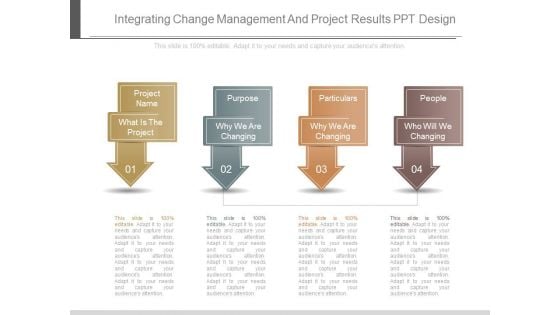
Integrating Change Management And Project Results Ppt Design
This is a integrating change management and project results ppt design. This is a four stage process. The stages in this process are project name, purpose, particulars, people, what is the project, why we are changing, who will we changing.
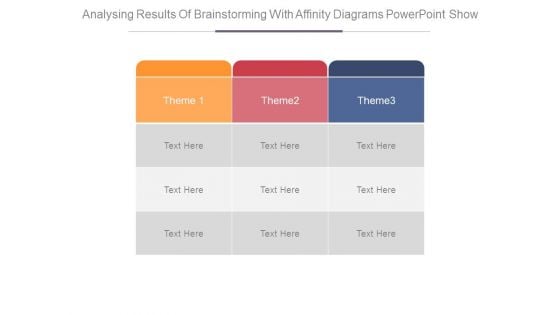
Analysing Results Of Brainstorming With Affinity Diagrams Powerpoint Show
This is a analysing results of brainstorming with affinity diagrams powerpoint show. This is a three stage process. The stages in this process are theme, business, table, marketing, planning.
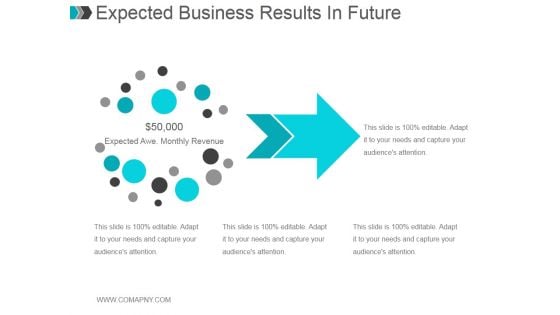
Expected Business Results In Future Ppt PowerPoint Presentation Visuals
This is a expected business results in future ppt powerpoint presentation visuals. This is a one stage process. The stages in this process are arrow, marketing, management, business, strategy.
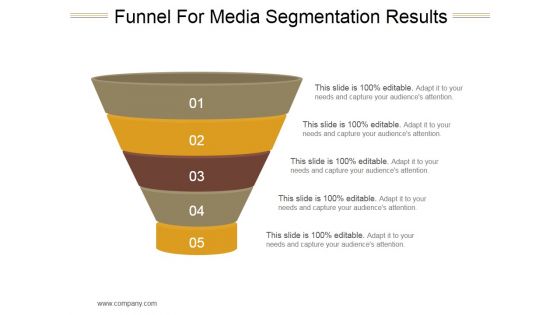
Funnel For Media Segmentation Results Ppt PowerPoint Presentation Microsoft
This is a funnel for media segmentation results ppt powerpoint presentation microsoft. This is a five stage process. The stages in this process are funnel, process, business, marketing, sales.
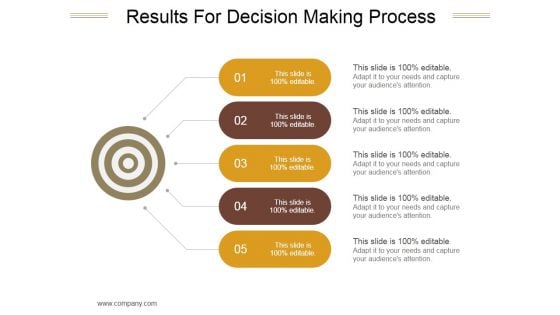
Results For Decision Making Process Ppt PowerPoint Presentation Outline
This is a results for decision making process ppt powerpoint presentation outline. This is a five stage process. The stages in this process are process, management, strategy, marketing, business.
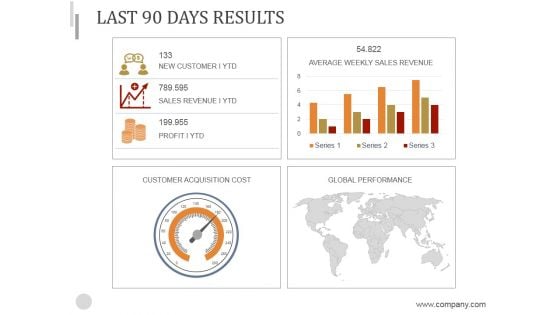
Last 90 Days Results Ppt PowerPoint Presentation Background Image
This is a last 90 days results ppt powerpoint presentation background image. This is a four stage process. The stages in this process are customer acquisition cost, global performance, average weekly sales revenue.
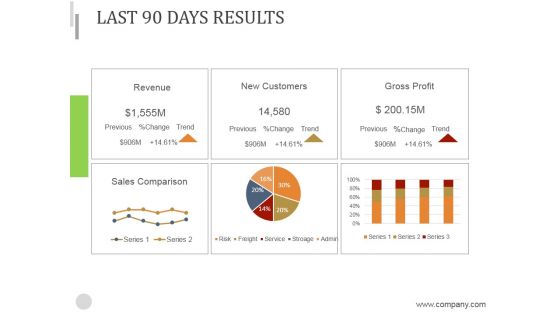
Last 90 Days Results Ppt PowerPoint Presentation Introduction
This is a last 90 days results ppt powerpoint presentation introduction. This is a six stage process. The stages in this process are revenue, new customers, gross profit, sales comparison.
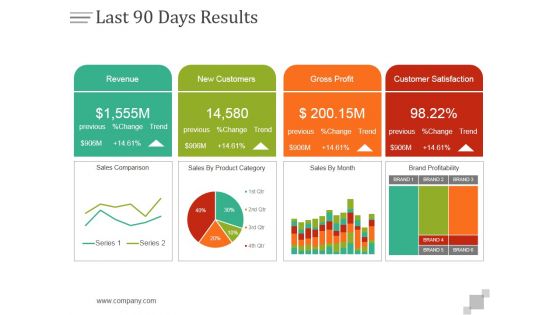
Last 90 Days Results Ppt PowerPoint Presentation Design Templates
This is a last 90 days results ppt powerpoint presentation design templates. This is a four stage process. The stages in this process are revenue, new customers, gross profit, customer satisfaction.
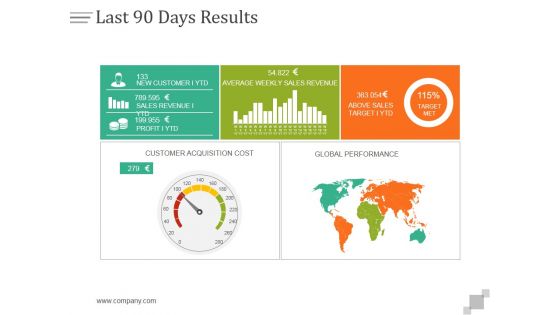
Last 90 Days Results Ppt PowerPoint Presentation Layouts
This is a last 90 days results ppt powerpoint presentation layouts. This is a five stage process. The stages in this process are business, finance, marketing, strategy, analysis, success.
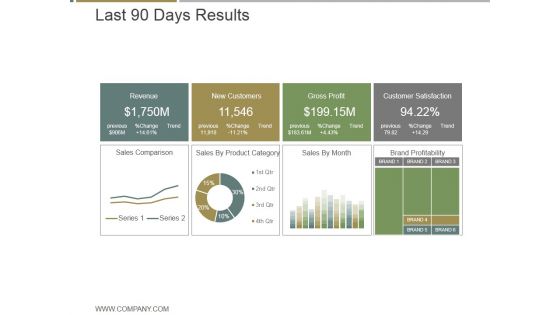
Last 90 Days Results Ppt PowerPoint Presentation Microsoft
This is a last 90 days results ppt powerpoint presentation microsoft. This is a four stage process. The stages in this process are revenue, new customers, gross profit, customer satisfaction.
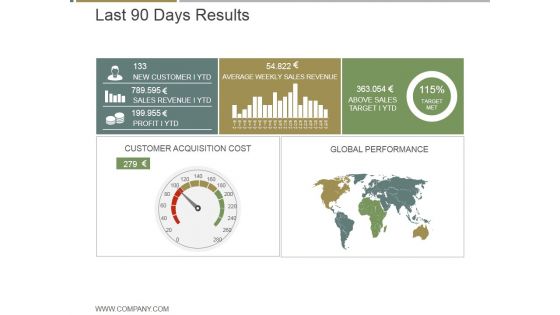
Last 90 Days Results Ppt PowerPoint Presentation Graphics
This is a last 90 days results ppt powerpoint presentation graphics. This is a five stage process. The stages in this process are new customer ytd, average weekly sales revenue, above sales target i ytd, customer acquisition cost, global performance.
Preliminary Discussion And Results Ppt PowerPoint Presentation Gallery Samples
This is a preliminary discussion and results ppt powerpoint presentation gallery samples. This is a four stage process. The stages in this process are business, marketing, strategy, growth, success.
Preliminary Discussion And Results Ppt PowerPoint Presentation Show Layout Ideas
This is a preliminary discussion and results ppt powerpoint presentation show layout ideas. This is a four stage process. The stages in this process are steps, business, marketing, success, management.
Preliminary Discussion And Results Ppt PowerPoint Presentation Icon Picture
This is a preliminary discussion and results ppt powerpoint presentation icon picture. This is a four stage process. The stages in this process are business, marketing, strategy, management, planning.
Preliminary Discussion And Results Ppt PowerPoint Presentation Portfolio Slides
This is a preliminary discussion and results ppt powerpoint presentation portfolio slides. This is a four stage process. The stages in this process are limitation, business, marketing, strategy, planning.
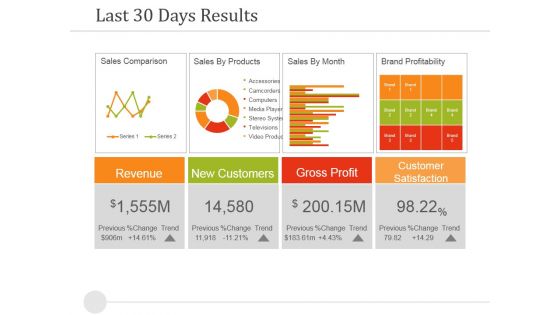
Last 30 Days Results Ppt PowerPoint Presentation Summary Brochure
This is a last 30 days results ppt powerpoint presentation summary brochure. This is a four stage process. The stages in this process are revenue, new customers, gross profit, customer satisfaction.
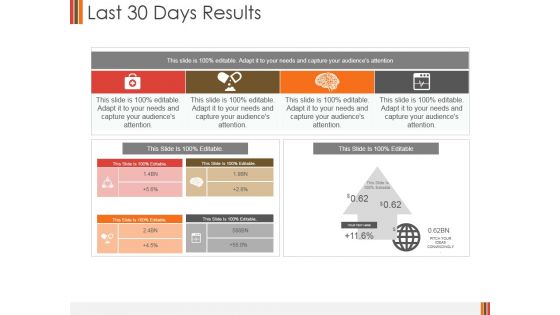
Last 30 Days Results Ppt PowerPoint Presentation Layouts Shapes
This is a last 30 days results ppt powerpoint presentation layouts shapes. This is a four stage process. The stages in this process are business, finance, management, analysis, strategy, success.
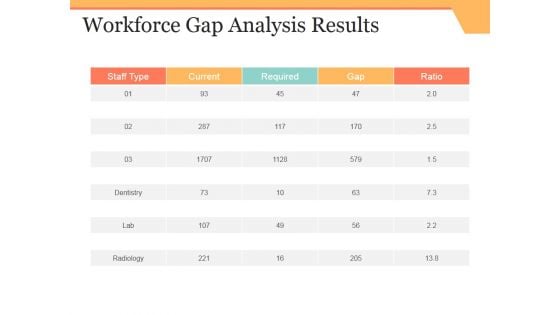
Workforce Gap Analysis Results Ppt PowerPoint Presentation Pictures Themes
This is a workforce gap analysis results ppt powerpoint presentation pictures themes. This is a four stage process. The stages in this process are staff type, current, required, gap, ratio.
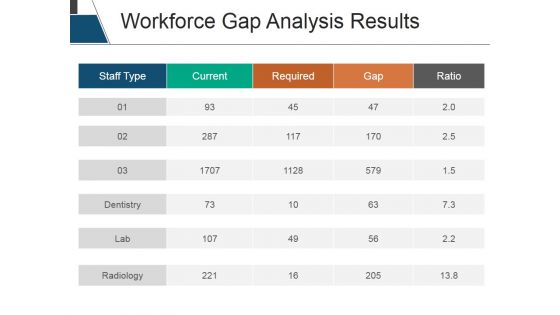
Workforce Gap Analysis Results Ppt PowerPoint Presentation Infographic Template Deck
This is a workforce gap analysis results ppt powerpoint presentation infographic template deck. This is a four stage process. The stages in this process are staff type, current, required, gap, ratio.

Workforce Gap Analysis Results Ppt PowerPoint Presentation File Slides
This is a workforce gap analysis results ppt powerpoint presentation file slides. This is a five stage process. The stages in this process are staff type, current, required, gap, ratio.
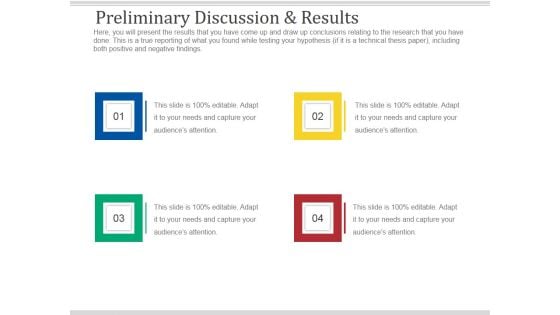
Preliminary Discussion And Results Ppt PowerPoint Presentation Layouts Files
This is a preliminary discussion and results ppt powerpoint presentation layouts files. This is a four stage process. The stages in this process are business, marketing, management, success, presentation.
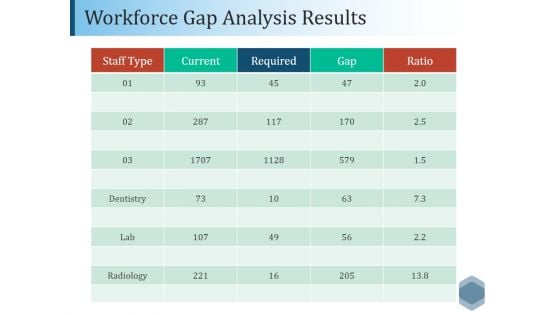
Workforce Gap Analysis Results Ppt PowerPoint Presentation Show Clipart
This is a workforce gap analysis results ppt powerpoint presentation show clipart. This is a five stage process. The stages in this process are staff type, current, required, gap, ratio.
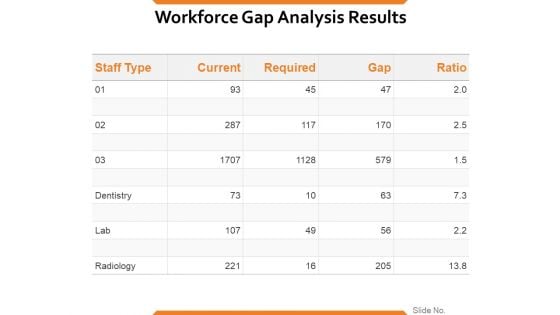
Workforce Gap Analysis Results Ppt PowerPoint Presentation Picture
This is a workforce gap analysis results ppt powerpoint presentation picture. This is a four stage process. The stages in this process are staff type, current, required, gap, ratio.
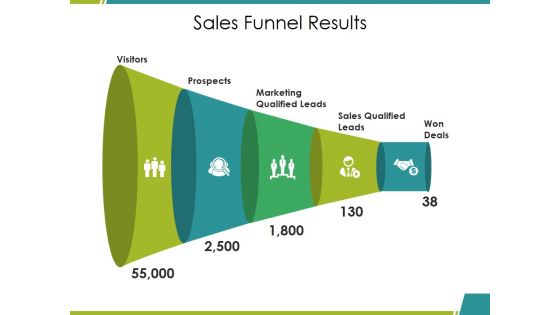
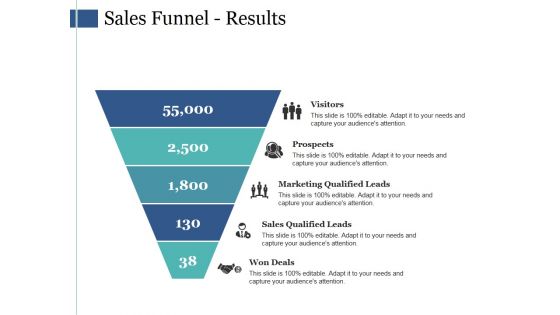
Sales Funnel Results Ppt PowerPoint Presentation Gallery Diagrams
This is a sales funnel results ppt powerpoint presentation gallery diagrams. This is a five stage process. The stages in this process are visitors, prospects, sales qualified leads, won, deals, marketing qualified leads.
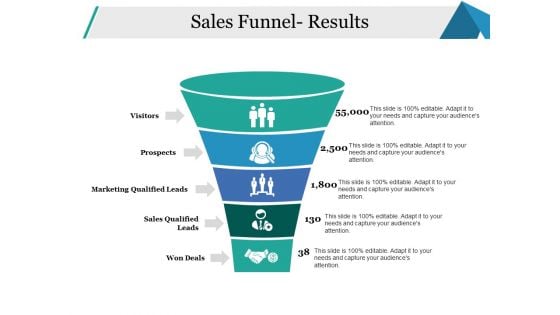
Sales Funnel Results Ppt PowerPoint Presentation Summary Background Designs
This is a sales funnel results ppt powerpoint presentation summary background designs. This is a five stage process. The stages in this process are visitors, prospects, marketing qualified leads, sales qualified leads, won deals.
Sales Funnel Results Ppt PowerPoint Presentation Gallery Show
This is a sales funnel results ppt powerpoint presentation gallery show. This is a five stage process. The stages in this process are visitors, prospects, marketing qualified leads, sales qualified leads, won deals.
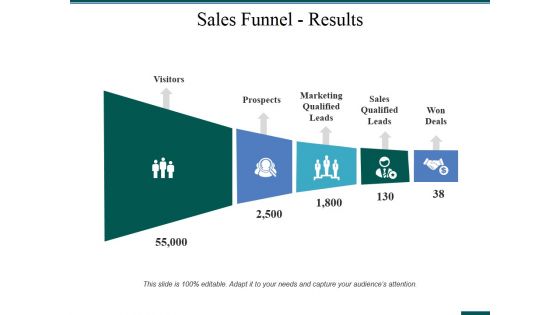
Sales Funnel Results Ppt PowerPoint Presentation Infographics Introduction
This is a sales funnel results ppt powerpoint presentation infographics introduction. This is a five stage process. The stages in this process are visitors, prospects, marketing qualified leads, sales qualified leads, won deals.
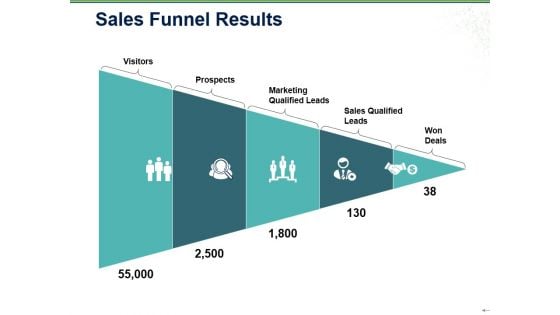
Sales Funnel Results Ppt PowerPoint Presentation Infographics Example Topics
This is a sales funnel results ppt powerpoint presentation infographics example topics. This is a five stage process. The stages in this process are visitors, prospects, sales qualified leads, won deals, marketing qualified leads.
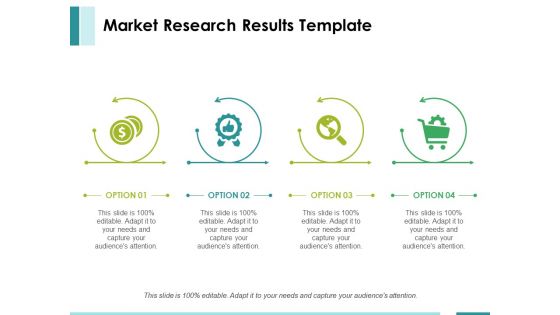
Market Research Results Template Ppt PowerPoint Presentation Ideas Graphic Tips
This is a market research results template ppt powerpoint presentation ideas graphic tips. This is a four stage process. The stages in this process are option, icons, strategy, business, marketing.
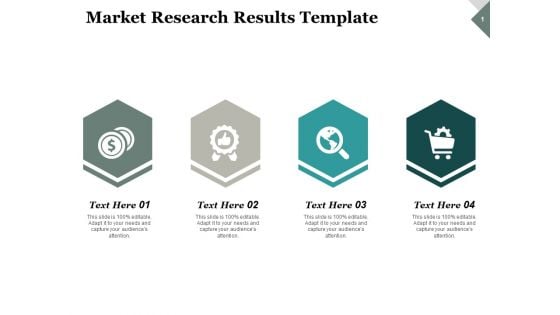
Market Research Results Business Ppt PowerPoint Presentation Infographic Template Ideas
This is a market research results business ppt powerpoint presentation infographic template ideas. This is a four stage process. The stages in this process are business, planning, strategy, marketing, management.
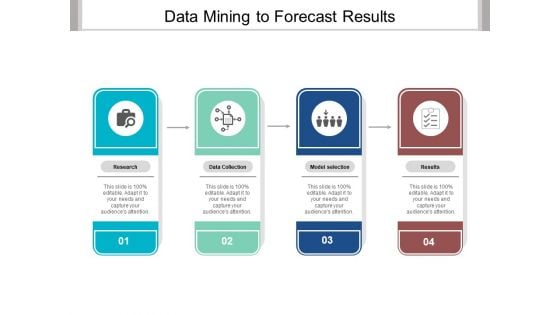
Data Mining To Forecast Results Ppt PowerPoint Presentation Ideas Inspiration
This is a data mining to forecast results ppt powerpoint presentation ideas inspiration. This is a four stage process. The stages in this process are predictive model, predictive framework, predictive structure.
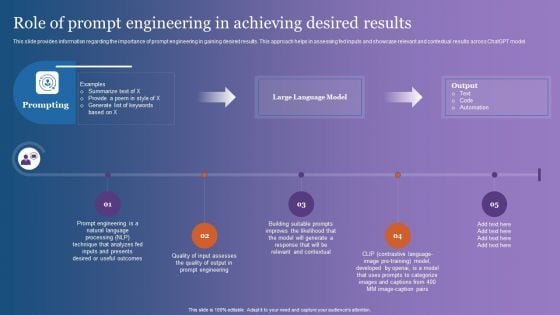
Role Of Prompt Engineering In Achieving Desired Results Themes PDF
This slide provides information regarding the importance of prompt engineering in gaining desired results. This approach helps in assessing fed inputs and showcase relevant and contextual results across ChatGPT model. If you are looking for a format to display your unique thoughts, then the professionally designed Role Of Prompt Engineering In Achieving Desired Results Themes PDF is the one for you. You can use it as a Google Slides template or a PowerPoint template. Incorporate impressive visuals, symbols, images, and other charts. Modify or reorganize the text boxes as you desire. Experiment with shade schemes and font pairings. Alter, share or cooperate with other people on your work. Download Role Of Prompt Engineering In Achieving Desired Results Themes PDF and find out how to give a successful presentation. Present a perfect display to your team and make your presentation unforgettable.
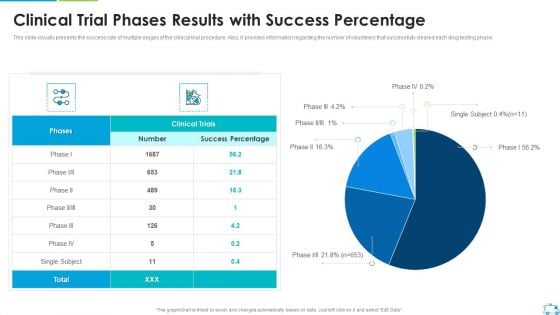
Clinical Trial Phases Results With Success Percentage Download PDF
This slide visually presents the success rate of multiple stages of the clinical trial procedure. Also, it provides information regarding the number of volunteers that successfully cleared each drug testing phase.Deliver an awe inspiring pitch with this creative Clinical Trial Phases Results With Success Percentage Download PDF bundle. Topics like Clinical Trial Phases Results With Success Percentage can be discussed with this completely editable template. It is available for immediate download depending on the needs and requirements of the user.
Product Results Icon With Expected Growth Ppt Pictures Show PDF
Persuade your audience using this Product Results Icon With Expected Growth Ppt Pictures Show PDF. This PPT design covers four stages, thus making it a great tool to use. It also caters to a variety of topics including Product Results Icon, Expected Growth. Download this PPT design now to present a convincing pitch that not only emphasizes the topic but also showcases your presentation skills.
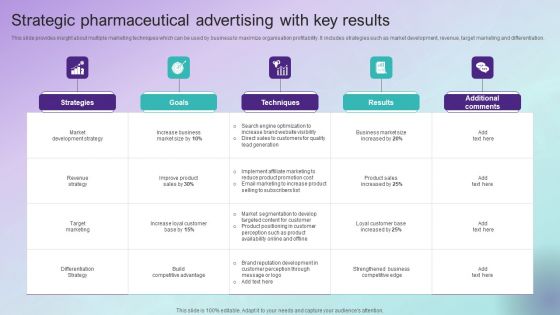
Strategic Pharmaceutical Advertising With Key Results Graphics PDF
This slide provides insight about multiple marketing techniques which can be used by business to maximize organisation profitability. It includes strategies such as market development, revenue, target marketing and differentiation. Showcasing this set of slides titled Strategic Pharmaceutical Advertising With Key Results Graphics PDF. The topics addressed in these templates are Strategies, Goals, Techniques, Results. All the content presented in this PPT design is completely editable. Download it and make adjustments in color, background, font etc. as per your unique business setting.
Results Based Marketing Ppt PowerPoint Presentation Outline Grid Cpb
Presenting this set of slides with name results based marketing ppt powerpoint presentation outline grid cpb. This is an editable Powerpoint five stages graphic that deals with topics like results based marketing to help convey your message better graphically. This product is a premium product available for immediate download and is 100 percent editable in Powerpoint. Download this now and use it in your presentations to impress your audience.

 Home
Home