Revenue Dashboard
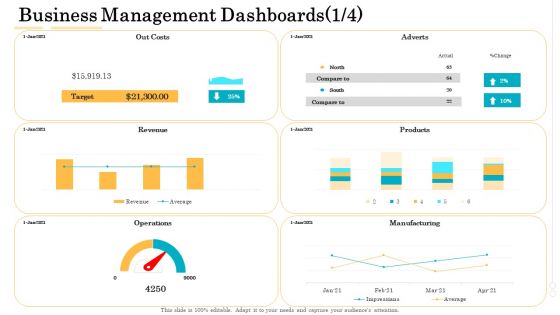
Administrative Regulation Business Management Dashboards Revenue Ppt PowerPoint Presentation Professional Graphics Design PDF
Deliver and pitch your topic in the best possible manner with this administrative regulation business management dashboards revenue ppt powerpoint presentation professional graphics design pdf. Use them to share invaluable insights on out costs, adverts, products, revenue, manufacturing, operations and impress your audience. This template can be altered and modified as per your expectations. So, grab it now.
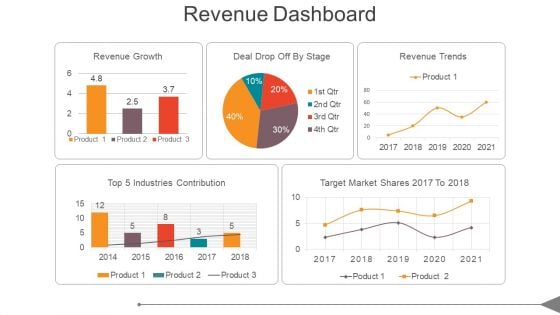
Revenue Dashboard Ppt PowerPoint Presentation Show
This is a revenue dashboard ppt powerpoint presentation show. This is a five stage process. The stages in this process are top 5 industries contribution, revenue growth, deal drop off by stage, revenue trends, target market shares 2017 to 2018.
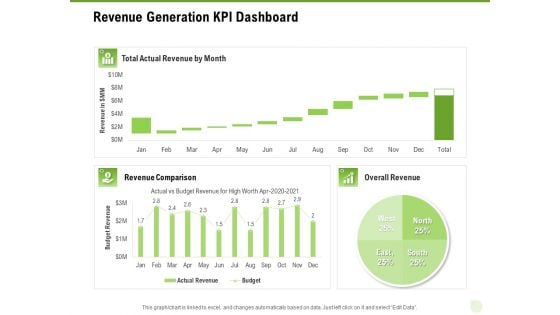
Cross Selling Of Retail Banking Products Revenue Generation KPI Dashboard Ppt Inspiration Rules PDF
Deliver and pitch your topic in the best possible manner with this cross selling of retail banking products revenue generation kpi dashboard ppt inspiration rules pdf. Use them to share invaluable insights on revenue generation kpi dashboard and impress your audience. This template can be altered and modified as per your expectations. So, grab it now.
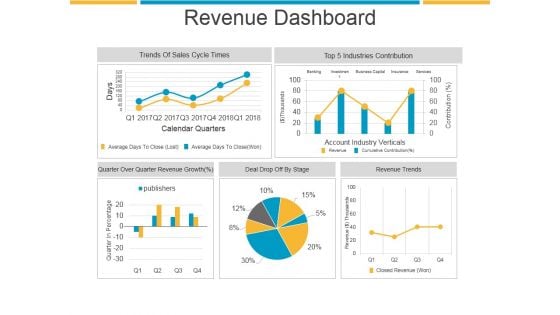
Revenue Dashboard Ppt PowerPoint Presentation Sample
This is a revenue dashboard ppt powerpoint presentation sample. This is a five stage process. The stages in this process are trends of sales cycle times, industries contribution, revenue trends, deal drop off by stage.

Saas Metrics Dashboard Illustrating Revenue Growth Rate Demonstration PDF
Showcasing this set of slides titled Saas Metrics Dashboard Illustrating Revenue Growth Rate Demonstration PDF The topics addressed in these templates are Saas Metrics Dashboard Illustrating Revenue Growth Rate All the content presented in this PPT design is completely editable. Download it and make adjustments in color, background, font etc. as per your unique business setting.
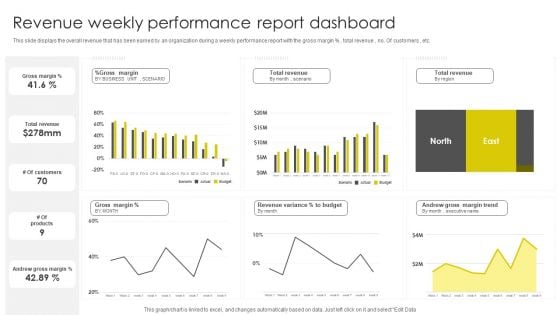
Revenue Weekly Performance Report Dashboard Topics PDF
This slide displays the overall revenue that has been earned by an organization during a weekly performance report with the gross margin percent , total revenue , no. Of customers , etc. Showcasing this set of slides titled Revenue Weekly Performance Report Dashboard Topics PDF. The topics addressed in these templates are Gross Margin, Total Revenue, Customers. All the content presented in this PPT design is completely editable. Download it and make adjustments in color, background, font etc. as per your unique business setting.
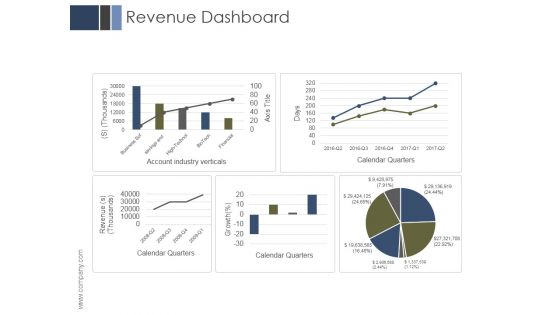
Revenue Dashboard Ppt PowerPoint Presentation Files
This is a revenue dashboard ppt powerpoint presentation files. This is a five stage process. The stages in this process are business, marketing, management, revenue, dashboard.
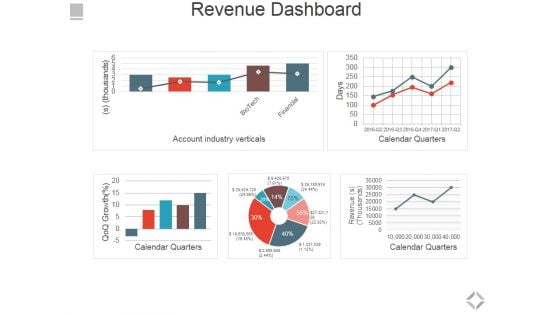
Revenue Dashboard Ppt PowerPoint Presentation Summary Brochure
This is a revenue dashboard ppt powerpoint presentation summary brochure. This is a five stage process. The stages in this process are account industry verticals, calendar quarters.
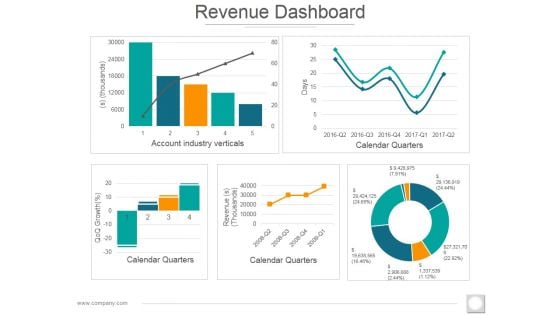
Revenue Dashboard Ppt PowerPoint Presentation Professional Microsoft
This is a revenue dashboard ppt powerpoint presentation professional microsoft. This is a five stage process. The stages in this process are account industry verticals, calendar quarters, revenue thousand, thousands.
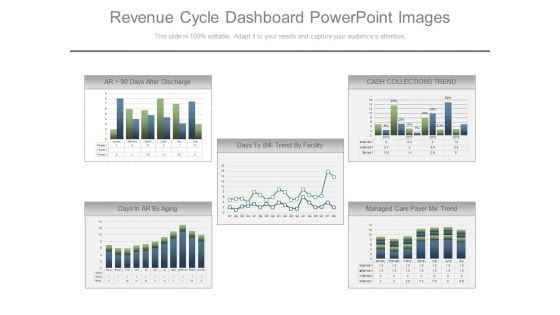
Revenue Cycle Dashboard Powerpoint Images
This is a revenue cycle dashboard powerpoint images. This is a five stage process. The stages in this process are days after discharge, cash collections trend, days to bill trend by facility, days in ar by aging, managed care payer mix trend.
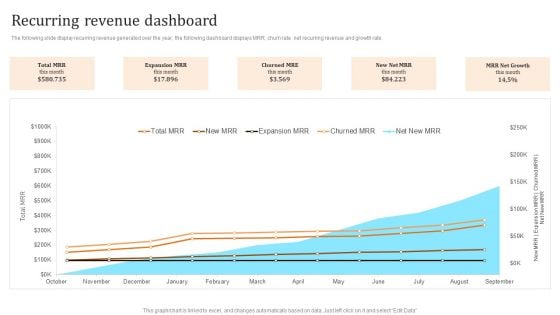
Membership Based Revenue Plan Recurring Revenue Dashboard Pictures PDF
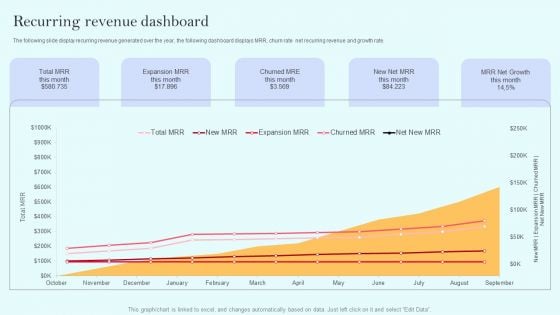
The following slide display recurring revenue generated over the year, the following dashboard displays MRR, churn rate net recurring revenue and growth rate. Formulating a presentation can take up a lot of effort and time, so the content and message should always be the primary focus. The visuals of the PowerPoint can enhance the presenters message, so our Membership Based Revenue Plan Recurring Revenue Dashboard Pictures PDF was created to help save time. Instead of worrying about the design, the presenter can concentrate on the message while our designers work on creating the ideal templates for whatever situation is needed. Slidegeeks has experts for everything from amazing designs to valuable content, we have put everything into Membership Based Revenue Plan Recurring Revenue Dashboard Pictures PDF
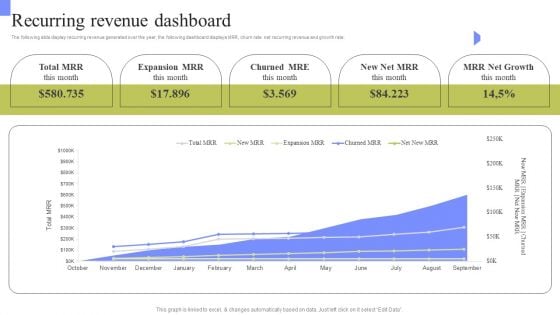
Periodic Revenue Model Recurring Revenue Dashboard Infographics PDF
The following slide display recurring revenue generated over the year, the following dashboard displays MRR, churn rate net recurring revenue and growth rate. Slidegeeks is one of the best resources for PowerPoint templates. You can download easily and regulate Periodic Revenue Model Recurring Revenue Dashboard Infographics PDF for your personal presentations from our wonderful collection. A few clicks is all it takes to discover and get the most relevant and appropriate templates. Use our Templates to add a unique zing and appeal to your presentation and meetings. All the slides are easy to edit and you can use them even for advertisement purposes.
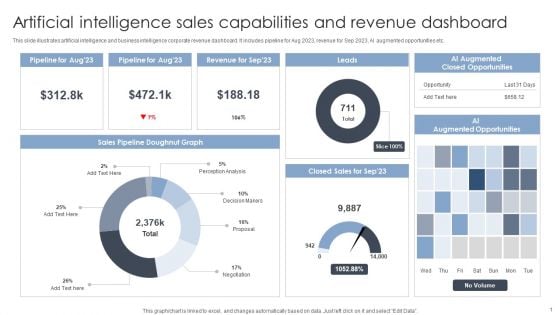
Artificial Intelligence Sales Capabilities And Revenue Dashboard Portrait PDF
This slide illustrates artificial intelligence and business intelligence corporate revenue dashboard. It includes pipeline for Aug 2023, revenue for Sep 2023, AI augmented opportunities etc. Pitch your topic with ease and precision using this Artificial Intelligence Sales Capabilities And Revenue Dashboard Portrait PDF. This layout presents information on Sales Capabilities, Revenue Dashboard. It is also available for immediate download and adjustment. So, changes can be made in the color, design, graphics or any other component to create a unique layout.
Recurring Income Generation Model Recurring Revenue Dashboard Pictures PDF
The following slide display recurring revenue generated over the year, the following dashboard displays MRR, churn rate net recurring revenue and growth rate. Explore a selection of the finest Recurring Income Generation Model Recurring Revenue Dashboard Pictures PDF here. With a plethora of professionally designed and pre made slide templates, you can quickly and easily find the right one for your upcoming presentation. You can use our Recurring Income Generation Model Recurring Revenue Dashboard Pictures PDF to effectively convey your message to a wider audience. Slidegeeks has done a lot of research before preparing these presentation templates. The content can be personalized and the slides are highly editable. Grab templates today from Slidegeeks.
Revenue Dashboard Of Digital Consultation Service Ppt Designs
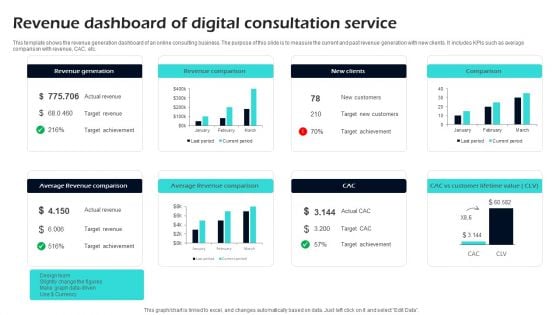
This template shows the revenue generation dashboard of an online consulting business. The purpose of this slide is to measure the current and past revenue generation with new clients. It includes KPIs such as average comparison with revenue, CAC, etc. Pitch your topic with ease and precision using this Revenue Dashboard Of Digital Consultation Service Ppt Designs. This layout presents information on Revenue, Digital, Consultation. It is also available for immediate download and adjustment. So, changes can be made in the color, design, graphics or any other component to create a unique layout.
Deploying And Managing Recurring Recurring Revenue Dashboard Designs PDF
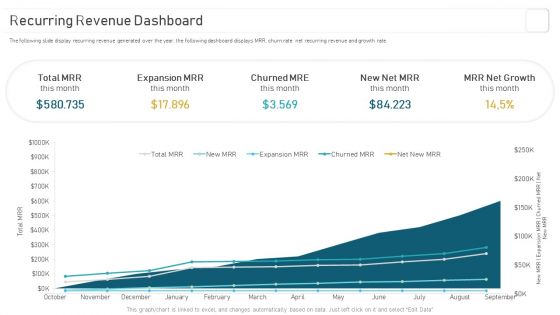
The following slide display recurring revenue generated over the year, the following dashboard displays MRR, churn rate net recurring revenue and growth rate. Make sure to capture your audiences attention in your business displays with our gratis customizable Deploying And Managing Recurring Recurring Revenue Dashboard Designs PDF. These are great for business strategies, office conferences, capital raising or task suggestions. If you desire to acquire more customers for your tech business and ensure they stay satisfied, create your own sales presentation with these plain slides.
Logistics Management Revenue Analysis Dashboard With Orders Revenue Brochure PDF
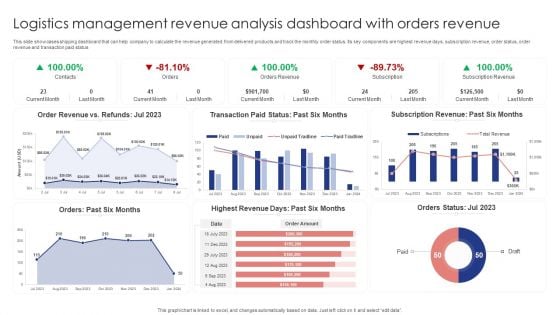
This slide showcases shipping dashboard that can help company to calculate the revenue generated from delivered products and track the monthly order status. Its key components are highest revenue days, subscription revenue, order status, order revenue and transaction paid status. Showcasing this set of slides titled Logistics Management Revenue Analysis Dashboard With Orders Revenue Brochure PDF. The topics addressed in these templates are Order Revenue, Transaction Paid, Subscription Revenue. All the content presented in this PPT design is completely editable. Download it and make adjustments in color, background, font etc. as per your unique business setting.

Revenue Kpi Dashboard Ppt Infographic Template
This is a revenue kpi dashboard ppt infographic template. This is a five stage process. The stages in this process are outcasts, successful adverts, earned revenue, sold products, operations.
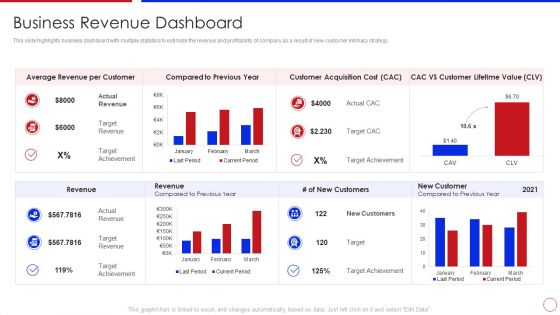
Strategy To Enhance Buyer Intimacy Business Revenue Dashboard Ppt Designs Download PDF
This slide highlights business dashboard with multiple statistics to estimate the revenue and profitability of company as a result of new customer intimacy strategy. Deliver an awe inspiring pitch with this creative strategy to enhance buyer intimacy business revenue dashboard ppt designs download pdf bundle. Topics like business revenue dashboard can be discussed with this completely editable template. It is available for immediate download depending on the needs and requirements of the user.

Customer Rapport Strategy To Build Loyal Client Base Business Revenue Dashboard Elements PDF
This slide highlights business dashboard with multiple statistics to estimate the revenue and profitability of company as a result of new customer intimacy strategy. Deliver and pitch your topic in the best possible manner with this customer rapport strategy to build loyal client base business revenue dashboard elements pdf. Use them to share invaluable insights on revenue, previous year, customer and impress your audience. This template can be altered and modified as per your expectations. So, grab it now.
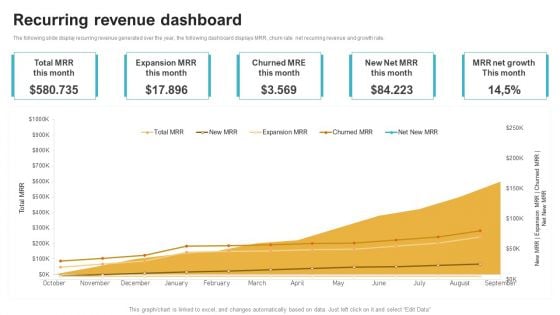
Saas Continuous Income Generation Model For Software Startup Recurring Revenue Dashboard Demonstration PDF
The following slide display recurring revenue generated over the year, the following dashboard displays MRR, churn rate net recurring revenue and growth rate. Explore a selection of the finest Saas Continuous Income Generation Model For Software Startup Recurring Revenue Dashboard Demonstration PDF here. With a plethora of professionally designed and pre made slide templates, you can quickly and easily find the right one for your upcoming presentation. You can use our Saas Continuous Income Generation Model For Software Startup Recurring Revenue Dashboard Demonstration PDF to effectively convey your message to a wider audience. Slidegeeks has done a lot of research before preparing these presentation templates. The content can be personalized and the slides are highly editable. Grab templates today from Slidegeeks.
Customer Relationship Strategy For Building Loyalty Business Revenue Dashboard Icons PDF
This slide highlights business dashboard with multiple statistics to estimate the revenue and profitability of company as a result of new customer intimacy strategy. Deliver an awe inspiring pitch with this creative customer relationship strategy for building loyalty business revenue dashboard icons pdf bundle. Topics like average revenue per customer, compared to previous year, customer acquisition cost, cac vs customer lifetime value, revenue can be discussed with this completely editable template. It is available for immediate download depending on the needs and requirements of the user.
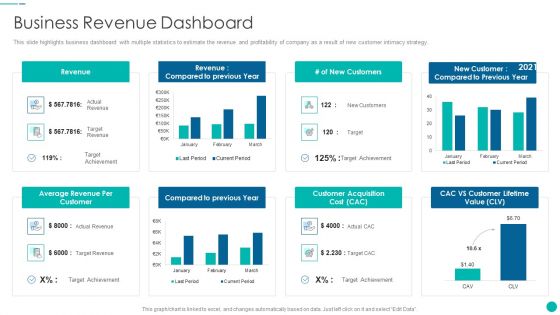
Tactical Procedure For Increasing Customer Intimacy Business Revenue Dashboard Diagrams PDF
This slide highlights business dashboard with multiple statistics to estimate the revenue and profitability of company as a result of new customer intimacy strategy. Deliver an awe inspiring pitch with this creative tactical procedure for increasing customer intimacy business revenue dashboard diagrams pdf bundle. Topics like average revenue per customer, compared to previous year, customer acquisition cost, cac vs customer lifetime value, revenue can be discussed with this completely editable template. It is available for immediate download depending on the needs and requirements of the user.
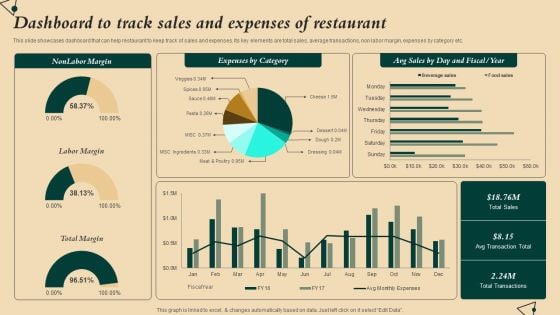
Coffeehouse Promotion Techniques To Boost Revenue Dashboard To Track Sales Expenses Restaurant Clipart PDF
This slide showcases dashboard that can help restaurant to keep track of sales and expenses. Its key elements are total sales, average transactions, non labor margin, expenses by category etc. If your project calls for a presentation, then Slidegeeks is your go-to partner because we have professionally designed, easy-to-edit templates that are perfect for any presentation. After downloading, you can easily edit Coffeehouse Promotion Techniques To Boost Revenue Dashboard To Track Sales Expenses Restaurant Clipart PDF and make the changes accordingly. You can rearrange slides or fill them with different images. Check out all the handy templates
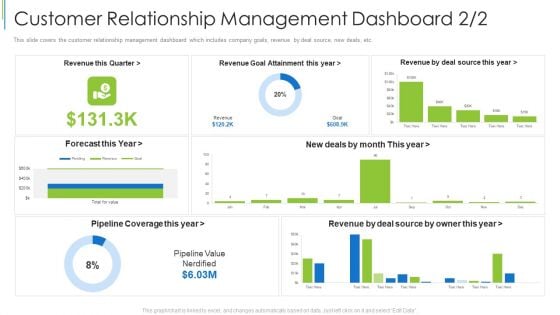
Customer Relationship Management Dashboard Revenue Background PDF
This slide covers the competitive analysis of different partner relationship management software which are compared based on features ratings and software prices. Deliver and pitch your topic in the best possible manner with this customer relationship management dashboard revenue background pdf. Use them to share invaluable insights on supply chain planning, fulfillment management, transportation management, inventory management and impress your audience. This template can be altered and modified as per your expectations. So, grab it now.
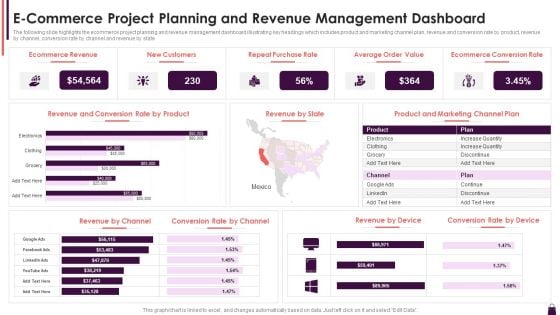
E Commerce Project Planning And Revenue Management Dashboard Introduction PDF
The following slide highlights the ecommerce project planning and revenue management dashboard illustrating key headings which includes product and marketing channel plan, revenue and conversion rate by product, revenue by channel, conversion rate by channel and revenue by state. Showcasing this set of slides titled E Commerce Project Planning And Revenue Management Dashboard Introduction PDF. The topics addressed in these templates are New Customers, Ecommerce Revenue, Repeat Purchase Rate. All the content presented in this PPT design is completely editable. Download it and make adjustments in color, background, font etc. as per your unique business setting.
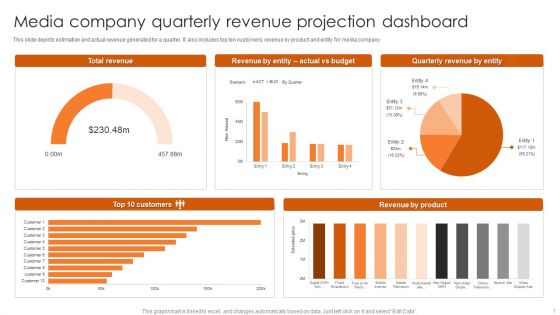
Media Company Quarterly Revenue Projection Dashboard Mockup PDF
This slide depicts estimation and actual revenue generated for a quarter. It also includes top ten customers, revenue by product and entity for media company. Pitch your topic with ease and precision using this Media Company Quarterly Revenue Projection Dashboard Mockup PDF. This layout presents information on Total Revenue, Quarterly Revenue Entity, Top 10 Customers. It is also available for immediate download and adjustment. So, changes can be made in the color, design, graphics or any other component to create a unique layout.
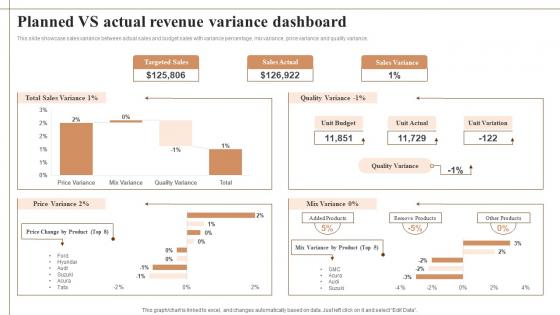
Planned Vs Actual Revenue Variance Dashboard Background Pdf
This slide showcase sales variance between actual sales and budget sales with variance percentage, mix variance, price variance and quality variance. Showcasing this set of slides titled Planned Vs Actual Revenue Variance Dashboard Background Pdf The topics addressed in these templates are Targeted Sales, Sales Actual, Sales Variance All the content presented in this PPT design is completely editable. Download it and make adjustments in color, background, font etc. as per your unique business setting. This slide showcase sales variance between actual sales and budget sales with variance percentage, mix variance, price variance and quality variance.
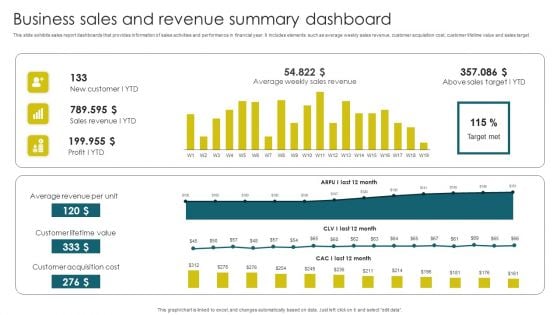
Business Sales And Revenue Summary Dashboard Brochure PDF
This slide exhibits sales report dashboards that provides information of sales activities and performance in financial year. It includes elements such as average weekly sales revenue, customer acquisition cost, customer lifetime value and sales target. Pitch your topic with ease and precision using this Business Sales And Revenue Summary Dashboard Brochure PDF. This layout presents information on Average Revenue, Customer Lifetime, Customer Acquisition. It is also available for immediate download and adjustment. So, changes can be made in the color, design, graphics or any other component to create a unique layout.
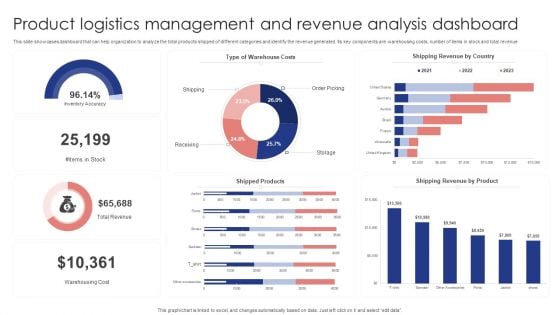
Product Logistics Management And Revenue Analysis Dashboard Demonstration PDF
This slide showcases dashboard that can help organization to analyze the total products shipped of different categories and identify the revenue generated. Its key components are warehousing costs, number of items in stock and total revenue. Pitch your topic with ease and precision using this Product Logistics Management And Revenue Analysis Dashboard Demonstration PDF. This layout presents information on Warehouse Costs, Shipping Revenue Country, Shipped Products . It is also available for immediate download and adjustment. So, changes can be made in the color, design, graphics or any other component to create a unique layout.
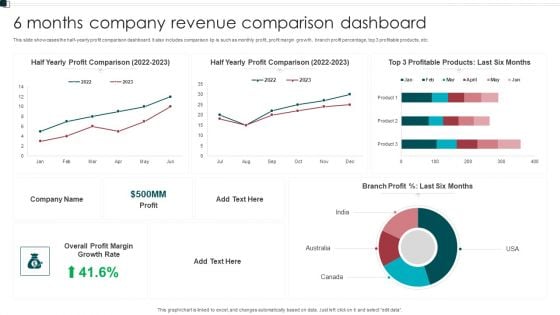
6 Months Company Revenue Comparison Dashboard Graphics PDF
This slide showcases the half yearly profit comparison dashboard. It also includes comparison kp is such as monthly profit, profit margin growth, branch profit percentage, top 3 profitable products, etc. Showcasing this set of slides titled 6 Months Company Revenue Comparison Dashboard Graphics PDF. The topics addressed in these templates are Growth Rate, Overall Profit Margin, Branch Profit. All the content presented in this PPT design is completely editable. Download it and make adjustments in color, background, font etc. as per your unique business setting.
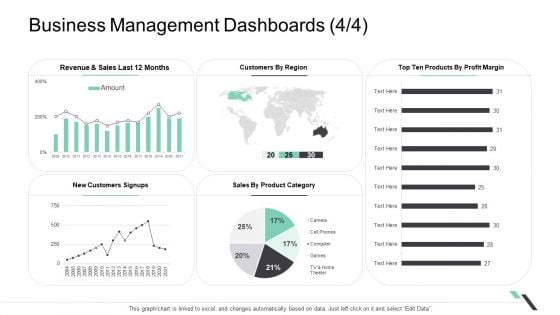
Business Management Dashboards Revenue Designs PDF
Deliver and pitch your topic in the best possible manner with this business management dashboards revenue designs pdf. Use them to share invaluable insights on revenue and sales, sales by product category and impress your audience. This template can be altered and modified as per your expectations. So, grab it now.
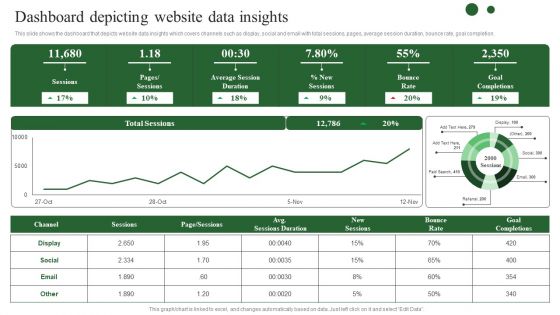
Brand Development Techniques To Increase Revenues Dashboard Depicting Website Data Diagrams PDF
This slide shows the dashboard that depicts website data insights which covers channels such as display, social and email with total sessions, pages, average session duration, bounce rate, goal completion. Are you in need of a template that can accommodate all of your creative concepts This one is crafted professionally and can be altered to fit any style. Use it with Google Slides or PowerPoint. Include striking photographs, symbols, depictions, and other visuals. Fill, move around, or remove text boxes as desired. Test out color palettes and font mixtures. Edit and save your work, or work with colleagues. Download Brand Development Techniques To Increase Revenues Dashboard Depicting Website Data Diagrams PDF and observe how to make your presentation outstanding. Give an impeccable presentation to your group and make your presentation unforgettable.
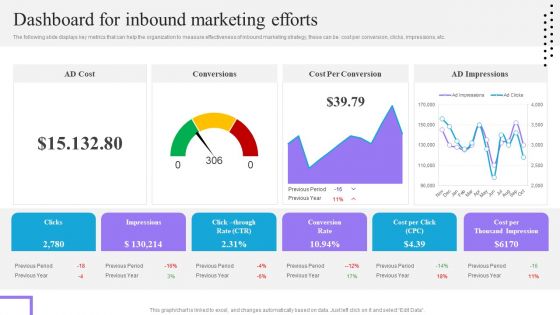
Content And Permission Marketing Tactics For Enhancing Business Revenues Dashboard For Inbound Marketing Efforts Wd Demonstration PDF
The following slide displays key metrics that can help the organization to measure effectiveness of inbound marketing strategy, these can be cost per conversion, clicks, impressions, etc. This modern and well-arranged Content And Permission Marketing Tactics For Enhancing Business Revenues Dashboard For Inbound Marketing Efforts Wd Demonstration PDF provides lots of creative possibilities. It is very simple to customize and edit with the Powerpoint Software. Just drag and drop your pictures into the shapes. All facets of this template can be edited with Powerpoint no extra software is necessary. Add your own material, put your images in the places assigned for them, adjust the colors, and then you can show your slides to the world, with an animated slide included.
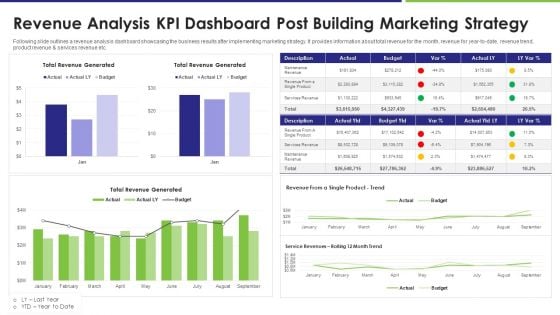
Revenue Analysis KPI Dashboard Post Building Marketing Strategy Infographics PDF
Following slide outlines a revenue analysis dashboard showcasing the business results after implementing marketing strategy. It provides information about total revenue for the month, revenue for year to date, revenue trend, product revenue and services revenue etc. Pitch your topic with ease and precision using this revenue analysis kpi dashboard post building marketing strategy infographics pdf. This layout presents information on revenue analysis kpi dashboard post building marketing strategy. It is also available for immediate download and adjustment. So, changes can be made in the color, design, graphics or any other component to create a unique layout.
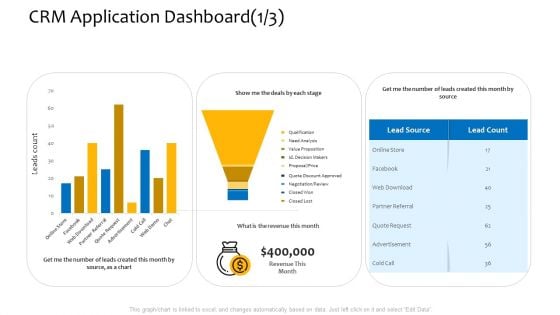
Customer Relationship Management Procedure CRM Application Dashboard Revenue Template PDF
Deliver and pitch your topic in the best possible manner with this customer relationship management procedure CRM application dashboard revenue template pdf. Use them to share invaluable insights on lead source, revenue this month, negotiation review, show me the deals by each stage, need analysis and impress your audience. This template can be altered and modified as per your expectations. So, grab it now.
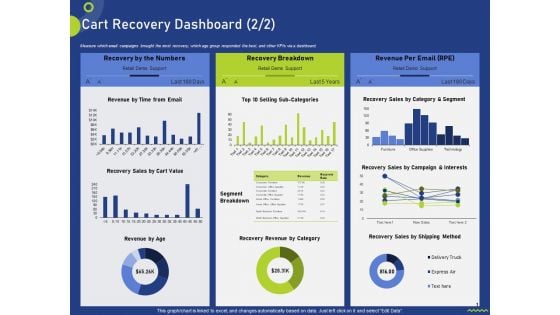
Cart Recovery Dashboard Revenue Ppt Portfolio Design Templates PDF
Measure which email campaigns brought the most recovery, which age group responded the best, and other KPIs via a dashboard. Deliver an awe-inspiring pitch with this creative cart recovery dashboard revenue ppt portfolio design templates pdf bundle. Topics like recovery revenue, recovery rate, revenue per email can be discussed with this completely editable template. It is available for immediate download depending on the needs and requirements of the user.
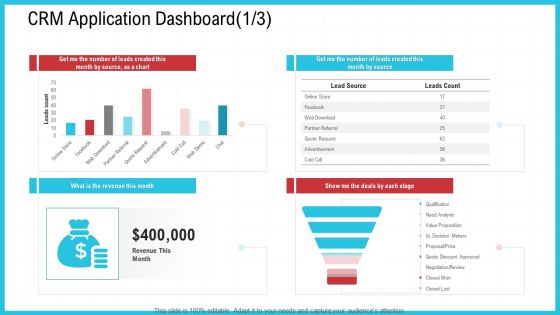
CRM Application Dashboard Revenue Ppt Infographics Example File PDF
Deliver and pitch your topic in the best possible manner with this crm application dashboard revenue ppt infographics example file pdf. Use them to share invaluable insights on source, analysis, price and impress your audience. This template can be altered and modified as per your expectations. So, grab it now.
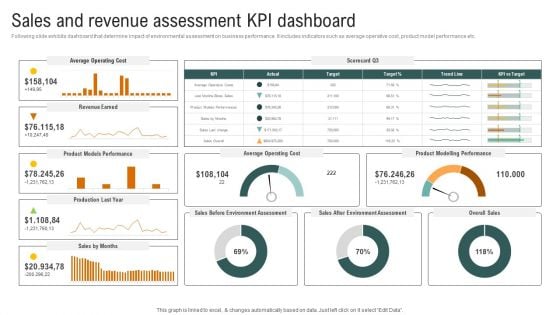
Sales And Revenue Assessment Kpi Dashboard Brochure PDF
Following slide exhibits dashboard that determine impact of environmental assessment on business performance. It includes indicators such as average operative cost, product model performance etc. If your project calls for a presentation, then Slidegeeks is your go-to partner because we have professionally designed, easy-to-edit templates that are perfect for any presentation. After downloading, you can easily edit Sales And Revenue Assessment Kpi Dashboard Brochure PDF and make the changes accordingly. You can rearrange slides or fill them with different images. Check out all the handy templates
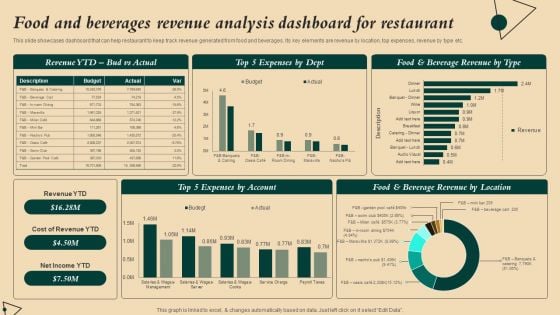
Coffeehouse Promotion Techniques To Boost Revenue Food And Beverages Revenue Analysis Dashboard Inspiration PDF
This slide showcases dashboard that can help restaurant to keep track revenue generated from food and beverages. Its key elements are revenue by location, top expenses, revenue by type etc. Are you in need of a template that can accommodate all of your creative concepts This one is crafted professionally and can be altered to fit any style. Use it with Google Slides or PowerPoint. Include striking photographs, symbols, depictions, and other visuals. Fill, move around, or remove text boxes as desired. Test out color palettes and font mixtures. Edit and save your work, or work with colleagues. Download Coffeehouse Promotion Techniques To Boost Revenue Food And Beverages Revenue Analysis Dashboard Inspiration PDF and observe how to make your presentation outstanding. Give an impeccable presentation to your group and make your presentation unforgettable.
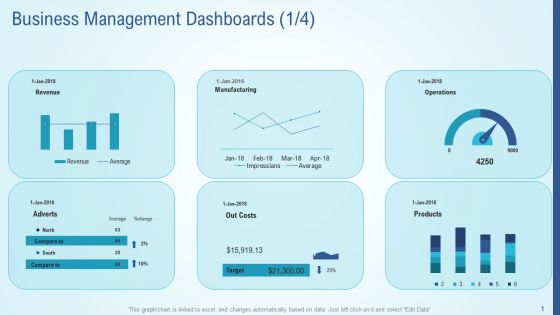
Business Strategy Development Process Business Management Dashboards Revenue Download PDF
Deliver an awe inspiring pitch with this creative business strategy development process business management dashboards revenue download pdf bundle. Topics like business management dashboards can be discussed with this completely editable template. It is available for immediate download depending on the needs and requirements of the user.
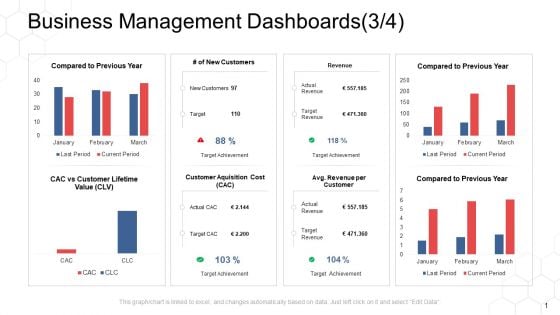
Corporate Regulation Business Management Dashboards Revenue Ppt Model PDF
Deliver and pitch your topic in the best possible manner with this corporate regulation business management dashboards revenue ppt model pdf. Use them to share invaluable insights on cost, revenue, acquisition, revenue, target and impress your audience. This template can be altered and modified as per your expectations. So, grab it now.
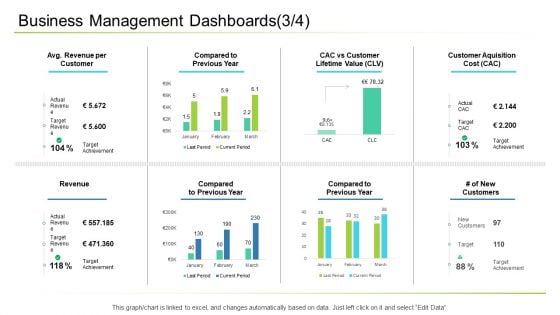
Business Management Dashboards Revenue Ppt Layouts Gridlines PDF
Deliver an awe inspiring pitch with this creative business management dashboards revenue ppt layouts gridlines pdf bundle. Topics like revenue, manufacturing, costs, products can be discussed with this completely editable template. It is available for immediate download depending on the needs and requirements of the user.
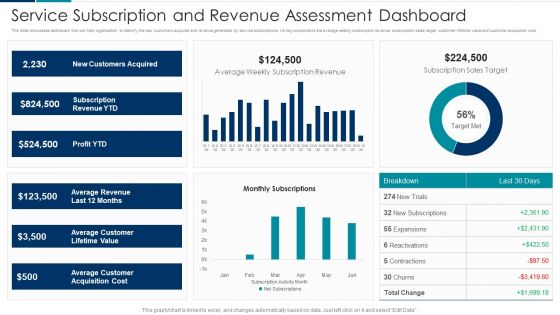
Managing New Service Roll Out And Marketing Procedure Service Subscription And Revenue Assessment Dashboard Themes PDF
Deliver an awe inspiring pitch with this creative Managing New Service Roll Out And Marketing Procedure Service Subscription And Revenue Assessment Dashboard Themes PDF bundle. Topics like New Customers Acquired, Subscription Revenue, Profit can be discussed with this completely editable template. It is available for immediate download depending on the needs and requirements of the user.
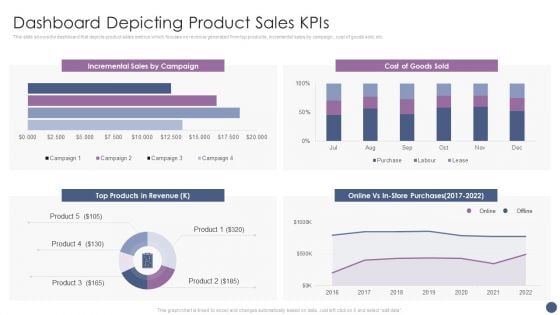
Competitive Sales Strategy Development Plan For Revenue Growth Dashboard Depicting Product Sales Kpis Elements PDF
This slide shows the dashboard that depicts product sales metrics which focuses on revenue generated from top products, incremental sales by campaign, cost of goods sold, etc. Deliver an awe inspiring pitch with this creative Competitive Sales Strategy Development Plan For Revenue Growth Dashboard Depicting Product Sales Kpis Elements PDF bundle. Topics like Incremental Sales, Cost, Store Purchases can be discussed with this completely editable template. It is available for immediate download depending on the needs and requirements of the user.
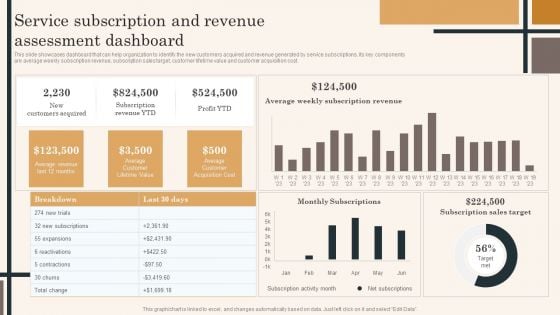
Edtech Service Launch And Promotion Plan Service Subscription And Revenue Assessment Dashboard Topics PDF
This slide showcases dashboard that can help organization to identify the new customers acquired and revenue generated by service subscriptions. Its key components are average weekly subscription revenue, subscription sales target, customer lifetime value and customer acquisition cost. Whether you have daily or monthly meetings, a brilliant presentation is necessary. Edtech Service Launch And Promotion Plan Service Subscription And Revenue Assessment Dashboard Topics PDF can be your best option for delivering a presentation. Represent everything in detail using Edtech Service Launch And Promotion Plan Service Subscription And Revenue Assessment Dashboard Topics PDF and make yourself stand out in meetings. The template is versatile and follows a structure that will cater to your requirements. All the templates prepared by Slidegeeks are easy to download and edit. Our research experts have taken care of the corporate themes as well. So, give it a try and see the results.
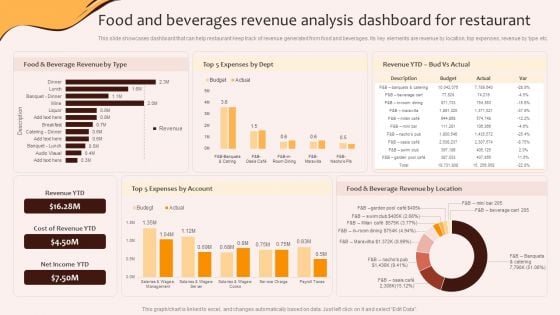
Digital Marketing Plan For Restaurant Business Food And Beverages Revenue Analysis Dashboard Template PDF
This slide showcases dashboard that can help restaurant keep track of revenue generated from food and beverages. Its key elements are revenue by location, top expenses, revenue by type etc.The best PPT templates are a great way to save time, energy, and resources. Slidegeeks have 100precent editable powerpoint slides making them incredibly versatile. With these quality presentation templates, you can create a captivating and memorable presentation by combining visually appealing slides and effectively communicating your message. Download Digital Marketing Plan For Restaurant Business Food And Beverages Revenue Analysis Dashboard Template PDF from Slidegeeks and deliver a wonderful presentation.
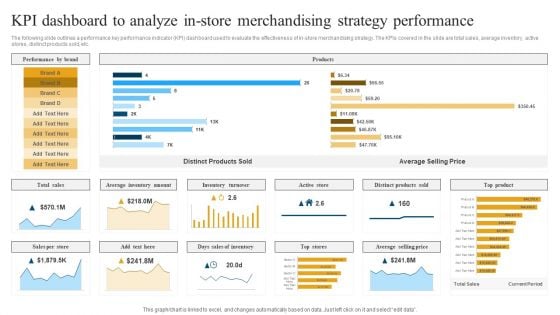
Retail Ecommerce Merchandising Tactics For Boosting Revenue KPI Dashboard To Analyze In Store Merchandising Rules PDF
The following slide outlines a performance key performance indicator KPI dashboard used to evaluate the effectiveness of in-store merchandising strategy. The KPIs covered in the slide are total sales, average inventory, active stores, distinct products sold, etc. Crafting an eye catching presentation has never been more straightforward. Let your presentation shine with this tasteful yet straightforward Retail Ecommerce Merchandising Tactics For Boosting Revenue KPI Dashboard To Analyze In Store Merchandising Rules PDF template. It offers a minimalistic and classy look that is great for making a statement. The colors have been employed intelligently to add a bit of playfulness while still remaining professional. Construct the ideal Retail Ecommerce Merchandising Tactics For Boosting Revenue KPI Dashboard To Analyze In Store Merchandising Rules PDF that effortlessly grabs the attention of your audience. Begin now and be certain to wow your customers.
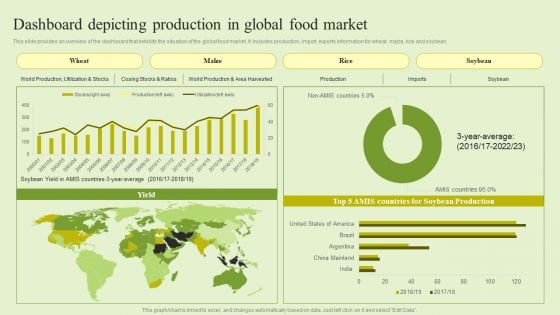
Agriculture Marketing Strategy To Improve Revenue Performance Dashboard Depicting Production Global Food Market Brochure PDF
This slide provides an overview of the dashboard that exhibits the situation of the global food market. It includes production, import, exports information for wheat, maize, rice and soybean. If you are looking for a format to display your unique thoughts, then the professionally designed Agriculture Marketing Strategy To Improve Revenue Performance Dashboard Depicting Production Global Food Market Brochure PDF is the one for you. You can use it as a Google Slides template or a PowerPoint template. Incorporate impressive visuals, symbols, images, and other charts. Modify or reorganize the text boxes as you desire. Experiment with shade schemes and font pairings. Alter, share or cooperate with other people on your work. Download Agriculture Marketing Strategy To Improve Revenue Performance Dashboard Depicting Production Global Food Market Brochure PDF and find out how to give a successful presentation. Present a perfect display to your team and make your presentation unforgettable.
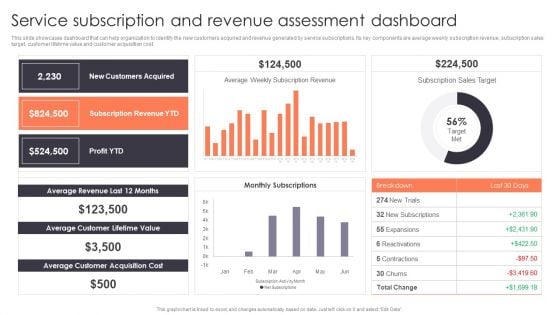
Promotion Strategies For New Service Launch Service Subscription And Revenue Assessment Dashboard Mockup PDF
This slide showcases dashboard that can help organization to identify the new customers acquired and revenue generated by service subscriptions. Its key components are average weekly subscription revenue, subscription sales target, customer lifetime value and customer acquisition cost. There are so many reasons you need a Promotion Strategies For New Service Launch Service Subscription And Revenue Assessment Dashboard Mockup PDF. The first reason is you can not spend time making everything from scratch, Thus, Slidegeeks has made presentation templates for you too. You can easily download these templates from our website easily.
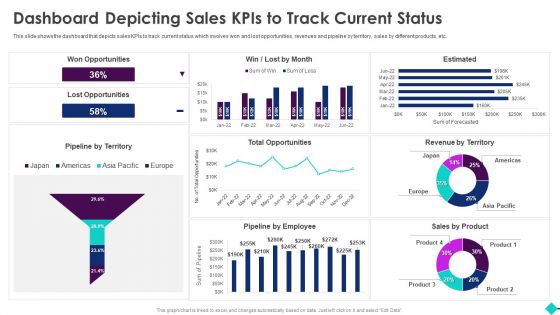
Sales Process Automation For Revenue Growth Dashboard Depicting Sales Kpis To Track Current Status Introduction PDF
This slide shows the dashboard that depicts sales KPIs to track current status which involves won and lost opportunities, revenues and pipeline by territory, sales by different products, etc.Deliver and pitch your topic in the best possible manner with this Sales Process Automation For Revenue Growth Dashboard Depicting Sales Kpis To Track Current Status Introduction PDF. Use them to share invaluable insights on Marketing Effectiveness, Forecast Accuracy, Pipeline Thickness and impress your audience. This template can be altered and modified as per your expectations. So, grab it now.
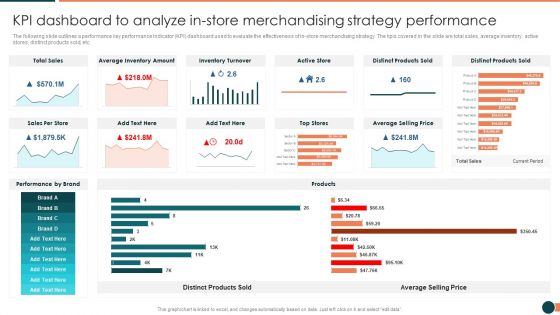
Developing Retail Marketing Strategies To Increase Revenue KPI Dashboard To Analyze Instore Information PDF
The following slide outlines a performance key performance indicator KPI dashboard used to evaluate the effectiveness of in store merchandising strategy. The kpis covered in the slide are total sales, average inventory, active stores, distinct products sold, etc.Deliver an awe inspiring pitch with this creative Developing Retail Marketing Strategies To Increase Revenue KPI Dashboard To Analyze Instore Information PDF bundle. Topics like Inventory Turnover, Distinct Products, Average Inventory can be discussed with this completely editable template. It is available for immediate download depending on the needs and requirements of the user.
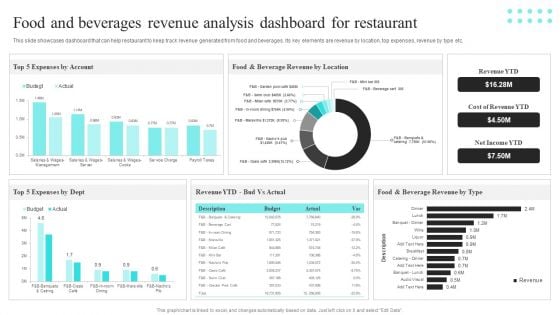
Strategic Promotional Guide For Restaurant Business Advertising Food And Beverages Revenue Analysis Dashboard Template PDF
This slide showcases dashboard that can help restaurant to keep track revenue generated from food and beverages. Its key elements are revenue by location, top expenses, revenue by type etc. This Strategic Promotional Guide For Restaurant Business Advertising Food And Beverages Revenue Analysis Dashboard Template PDF from Slidegeeks makes it easy to present information on your topic with precision. It provides customization options, so you can make changes to the colors, design, graphics, or any other component to create a unique layout. It is also available for immediate download, so you can begin using it right away. Slidegeeks has done good research to ensure that you have everything you need to make your presentation stand out. Make a name out there for a brilliant performance.
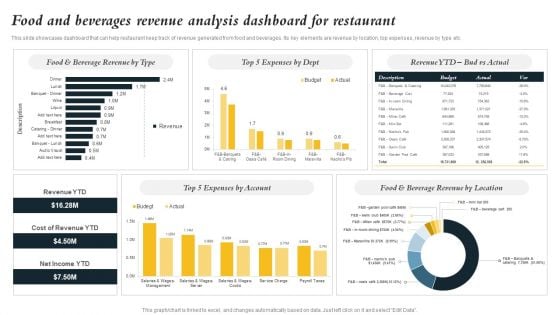
Marketing Initiatives To Promote Fast Food Cafe Food And Beverages Revenue Analysis Dashboard Demonstration PDF
This slide showcases dashboard that can help restaurant keep track of revenue generated from food and beverages. Its key elements are revenue by location, top expenses, revenue by type etc Are you in need of a template that can accommodate all of your creative concepts This one is crafted professionally and can be altered to fit any style. Use it with Google Slides or PowerPoint. Include striking photographs, symbols, depictions, and other visuals. Fill, move around, or remove text boxes as desired. Test out color palettes and font mixtures. Edit and save your work, or work with colleagues. Download Marketing Initiatives To Promote Fast Food Cafe Food And Beverages Revenue Analysis Dashboard Demonstration PDF and observe how to make your presentation outstanding. Give an impeccable presentation to your group and make your presentation unforgettable.
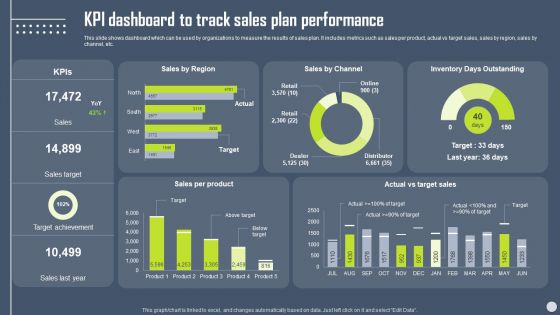
Boosting Yearly Business Revenue KPI Dashboard To Track Sales Plan Performance Topics PDF
This slide shows dashboard which can be used by organizations to measure the results of sales plan. It includes metrics such as sales per product, actual vs target sales, sales by region, sales by channel, etc. Boost your pitch with our creative Boosting Yearly Business Revenue KPI Dashboard To Track Sales Plan Performance Topics PDF. Deliver an awe-inspiring pitch that will mesmerize everyone. Using these presentation templates you will surely catch everyones attention. You can browse the ppts collection on our website. We have researchers who are experts at creating the right content for the templates. So you dont have to invest time in any additional work. Just grab the template now and use them.
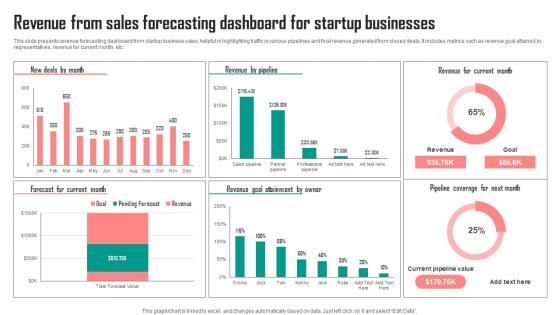
Revenue From Sales Forecasting Dashboard For Startup Businesses Graphics Pdf
This slide presents revenue forecasting dashboard from startup business sales, helpful in highlighting traffic in various pipelines and final revenue generated from closed deals. It includes metrics such as revenue goal attained by representatives, revenue for current month, etc. Showcasing this set of slides titled Revenue From Sales Forecasting Dashboard For Startup Businesses Graphics Pdf. The topics addressed in these templates are Owner, Current Month, Businesses. All the content presented in this PPT design is completely editable. Download it and make adjustments in color, background, font etc. as per your unique business setting. This slide presents revenue forecasting dashboard from startup business sales, helpful in highlighting traffic in various pipelines and final revenue generated from closed deals. It includes metrics such as revenue goal attained by representatives, revenue for current month, etc.
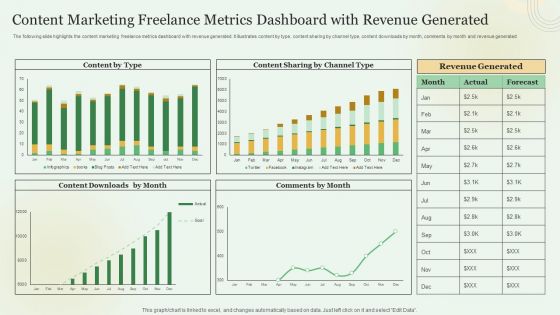
Content Marketing Freelance Metrics Dashboard With Revenue Generated Demonstration PDF
Showcasing this set of slides titled Content Marketing Freelance Metrics Dashboard With Revenue Generated Demonstration PDF. The topics addressed in these templates are Content Marketing, Freelance Metrics Dashboard, Revenue Generated. All the content presented in this PPT design is completely editable. Download it and make adjustments in color, background, font etc. as per your unique business setting.
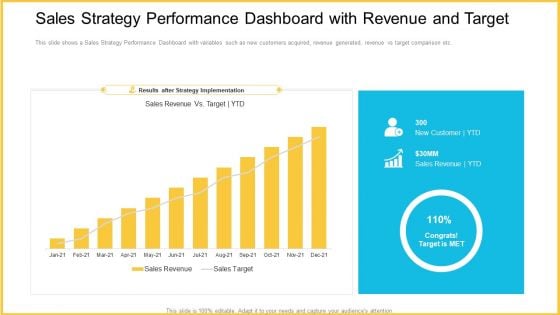
Sales Strategy Performance Dashboard With Revenue And Target Designs PDF
This slide shows a Sales Strategy Performance Dashboard with variables such as new customers acquired, revenue generated, revenue vs target comparison etc. Deliver and pitch your topic in the best possible manner with this sales strategy performance dashboard with revenue and target designs pdf. Use them to share invaluable insights on sales strategy performance dashboard with revenue and target and impress your audience. This template can be altered and modified as per your expectations. So, grab it now.
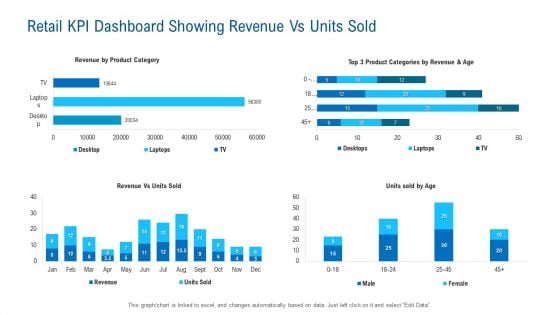
Retail KPI Dashboard Showing Revenue Vs Units Sold Microsoft PDF
Deliver an awe inspiring pitch with this creative retail kpi dashboard showing revenue vs units sold microsoft pdf bundle. Topics like product category, retail kpi dashboard showing revenue vs units sold can be discussed with this completely editable template. It is available for immediate download depending on the needs and requirements of the user.
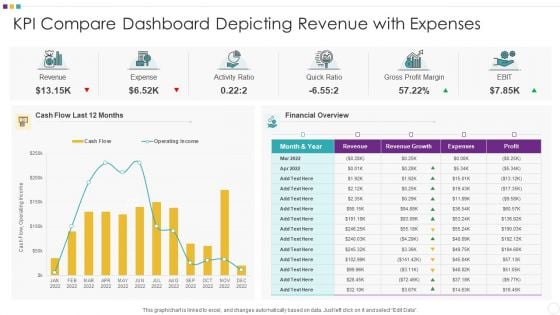
KPI Compare Dashboard Depicting Revenue With Expenses Information PDF
Showcasing this set of slides titled KPI Compare Dashboard Depicting Revenue With Expenses Information PDF The topics addressed in these templates are KPI Compare Dashboard Depicting Revenue With Expenses All the content presented in this PPT design is completely editable. Download it and make adjustments in color, background, font etc. as per your unique business setting.

 Home
Home