Revenue Graph
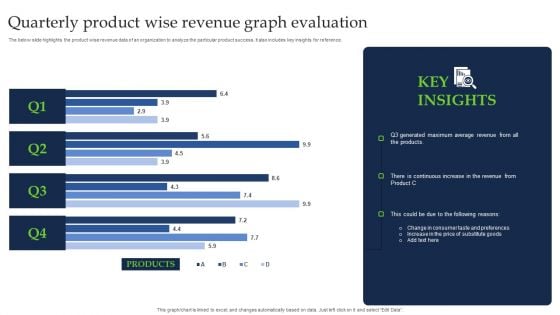
Quarterly Product Wise Revenue Graph Evaluation Brochure PDF
The below slide highlights the product wise revenue data of an organization to analyze the particular product success. It also includes key insights for reference. Pitch your topic with ease and precision using this Quarterly Product Wise Revenue Graph Evaluation Brochure PDF. This layout presents information on Products, Average Revenue. It is also available for immediate download and adjustment. So, changes can be made in the color, design, graphics or any other component to create a unique layout.
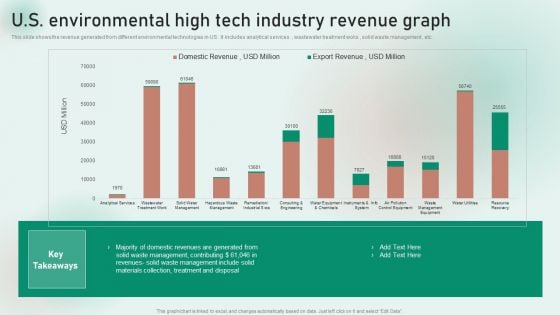
U S Environmental High Tech Industry Revenue Graph Professional PDF
This slide shows the revenue generated from different environmental technologies in US . It includes analytical services , wastewater treatment woks , solid waste management , etc. Showcasing this set of slides titled U S Environmental High Tech Industry Revenue Graph Professional PDF. The topics addressed in these templates are Management, Materials Collection, Revenues. All the content presented in this PPT design is completely editable. Download it and make adjustments in color, background, font etc. as per your unique business setting.
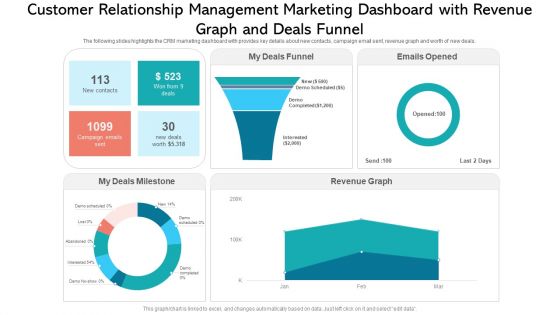
Customer Relationship Management Marketing Dashboard With Revenue Graph And Deals Funnel Ideas PDF
The following slides highlights the CRM marketing dashboard with provides key details about new contacts, campaign email sent, revenue graph and worth of new deals. Showcasing this set of slides titled customer relationship management marketing dashboard with revenue graph and deals funnel ideas pdf. The topics addressed in these templates are funnel, revenue graph, campaign. All the content presented in this PPT design is completely editable. Download it and make adjustments in color, background, font etc. as per your unique business setting.

Improving Business Revenue Bar Graph Ppt PowerPoint Presentation Infographic Template
This is a improving business revenue bar graph ppt powerpoint presentation infographic template. This is a six stage process. The stages in this process are graph, arrow, finance, percentage, success.
Target Revenue With Graph Icon Ppt PowerPoint Presentation Portfolio Elements
Presenting this set of slides with name target revenue with graph icon ppt powerpoint presentation portfolio elements. This is a one stage process. The stages in this process are target revenue, target dollar revenue, businessmen shows. This is a completely editable PowerPoint presentation and is available for immediate download. Download now and impress your audience.
Gross Revenue Margin Comparison Graph Icon Clipart PDF
Persuade your audience using this Gross Revenue Margin Comparison Graph Icon Clipart PDF. This PPT design covers three stages, thus making it a great tool to use. It also caters to a variety of topics including Gross Revenue Margin, Comparison Graph Icon. Download this PPT design now to present a convincing pitch that not only emphasizes the topic but also showcases your presentation skills.

Brand Revenue Comparative Analysis Graph With Key Insights Inspiration PDF
This slide illustrates graphical representation of sales revenue of three brands. It includes insights and facts and figures of these brands.Showcasing this set of slides titled Brand Revenue Comparative Analysis Graph With Key Insights Inspiration PDF. The topics addressed in these templates are Brand Revenue Comparative Analysis Graph With Key Insights. All the content presented in this PPT design is completely editable. Download it and make adjustments in color, background, font etc. as per your unique business setting.

Microsoft Corporations Revenue Growth Graph Microsoft Long Term Business Professional PDF
This slide represents graph which ca be used to calculate the revenue growth of Microsoft in last twenty years. Microsofts revenue has been growing continuously over the past 5 years since. Presenting this PowerPoint presentation, titled Microsoft Corporations Revenue Growth Graph Microsoft Long Term Business Professional PDF, with topics curated by our researchers after extensive research. This editable presentation is available for immediate download and provides attractive features when used. Download now and captivate your audience. Presenting this Microsoft Corporations Revenue Growth Graph Microsoft Long Term Business Professional PDF. Our researchers have carefully researched and created these slides with all aspects taken into consideration. This is a completely customizable Microsoft Corporations Revenue Growth Graph Microsoft Long Term Business Professional PDF that is available for immediate downloading. Download now and make an impact on your audience. Highlight the attractive features available with our PPTs. This slide represents graph which ca be used to calculate the revenue growth of Microsoft in last twenty years. Microsofts revenue has been growing continuously over the past 5 years since.

Microsoft Corporations Revenue Growth Graph Strategic Advancements By Microsofts Diagrams Pdf
This slide represents graph which ca be used to calculate the revenue growth of Microsoft in last twenty years. Microsofts revenue has been growing continuously over the past 5 years since. Presenting this PowerPoint presentation, titled Microsoft Corporations Revenue Growth Graph Strategic Advancements By Microsofts Diagrams Pdf, with topics curated by our researchers after extensive research. This editable presentation is available for immediate download and provides attractive features when used. Download now and captivate your audience. Presenting this Microsoft Corporations Revenue Growth Graph Strategic Advancements By Microsofts Diagrams Pdf. Our researchers have carefully researched and created these slides with all aspects taken into consideration. This is a completely customizable Microsoft Corporations Revenue Growth Graph Strategic Advancements By Microsofts Diagrams Pdf that is available for immediate downloading. Download now and make an impact on your audience. Highlight the attractive features available with our PPTs. This slide represents graph which ca be used to calculate the revenue growth of Microsoft in last twenty years. Microsofts revenue has been growing continuously over the past 5 years since.

Business Revenue Bar Graph With Business Operational Expenditure Details Summary PDF
This slide represents business revenue bar graph with OPEX details which can be referred by companies to earn more revenue by controlling expenditures. It also provides information about marketing and sales, research and development, administration, total revenue, etc. Pitch your topic with ease and precision using this Business Revenue Bar Graph With Business Operational Expenditure Details Summary PDF. This layout presents information on Cost Of Marketing, Sales, Highest Amount. It is also available for immediate download and adjustment. So, changes can be made in the color, design, graphics or any other component to create a unique layout.

Microsoft Strategic Plan To Become Market Leader Microsoft Corporations Revenue Growth Graph Portrait PDF
This slide represents graph which ca be used to calculate the revenue growth of Microsoft in last twenty years. Microsofts revenue has been growing continuously over the past 5 years since. Whether you have daily or monthly meetings, a brilliant presentation is necessary. Microsoft Strategic Plan To Become Market Leader Microsoft Corporations Revenue Growth Graph Portrait PDF can be your best option for delivering a presentation. Represent everything in detail using Microsoft Strategic Plan To Become Market Leader Microsoft Corporations Revenue Growth Graph Portrait PDF and make yourself stand out in meetings. The template is versatile and follows a structure that will cater to your requirements. All the templates prepared by Slidegeeks are easy to download and edit. Our research experts have taken care of the corporate themes as well. So, give it a try and see the results.

6 Year Revenue Declining Graph Ppt PowerPoint Presentation Outline Sample PDF
This slide shows the revenues of the company over the last years to have a clear idea of organization growth and financial status . It includes the 6 year 2017 to 2022 revenue earned by the company.Showcasing this set of slides titled 6 Year Revenue Declining Graph Ppt PowerPoint Presentation Outline Sample PDF. The topics addressed in these templates are Revenue Company, Highest Comparison, Conditions Restrictions. All the content presented in this PPT design is completely editable. Download it and make adjustments in color, background, font etc. as per your unique business setting.
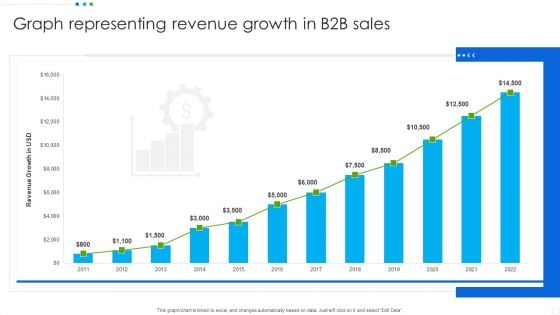
Graph Representing Revenue Growth In B2b Sales Background PDF
Pitch your topic with ease and precision using this Graph Representing Revenue Growth In B2b Sales Background PDF. This layout presents information on Graph Representing, Revenue Growth, Sales. It is also available for immediate download and adjustment. So, changes can be made in the color, design, graphics or any other component to create a unique layout.
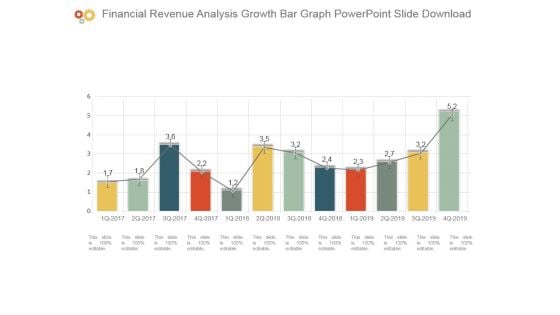
Financial Revenue Analysis Growth Bar Graph Powerpoint Slide Download
This is a financial revenue analysis growth bar graph powerpoint slide download. This is a twelve stage process. The stages in this process are bar graph, business, marketing, growth, success.

Revenue Growth For Bar Graph Ppt Examples Slides
This is a revenue growth for bar graph ppt examples slides. This is a five stage process. The stages in this process are bar graph, years, business, growth, marketing.
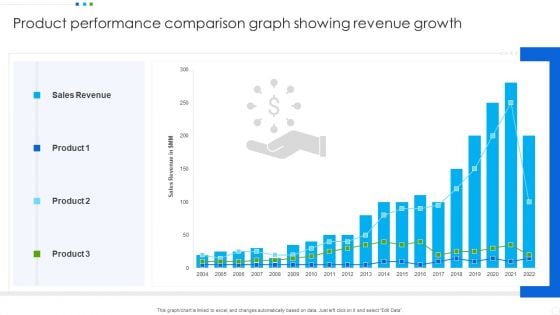
Product Performance Comparison Graph Showing Revenue Growth Portrait PDF
Showcasing this set of slides titled Product Performance Comparison Graph Showing Revenue Growth Portrait PDF. The topics addressed in these templates are Sales Revenue, Product. All the content presented in this PPT design is completely editable. Download it and make adjustments in color, background, font etc. as per your unique business setting.
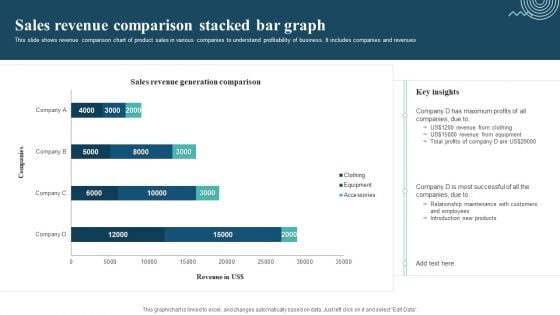
Sales Revenue Comparison Stacked Bar Graph Mockup PDF
This slide shows revenue comparison chart of product sales in various companies to understand profitability of business. It includes companies and revenues. Showcasing this set of slides titled Sales Revenue Comparison Stacked Bar Graph Mockup PDF. The topics addressed in these templates are Sales Revenue Comparison, Revenue From Clothing, Revenue From Equipment. All the content presented in this PPT design is completely editable. Download it and make adjustments in color, background, font etc. as per your unique business setting.
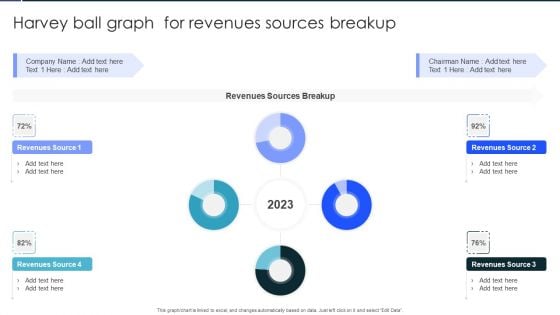
Harvey Ball Graph For Revenues Sources Breakup Infographics PDF
Showcasing this set of slides titled Harvey Ball Graph For Revenues Sources Breakup Infographics PDF. The topics addressed in these templates are Revenues Sources Breakup, Revenues, Sources Breakup. All the content presented in this PPT design is completely editable. Download it and make adjustments in color, background, font etc. as per your unique business setting.
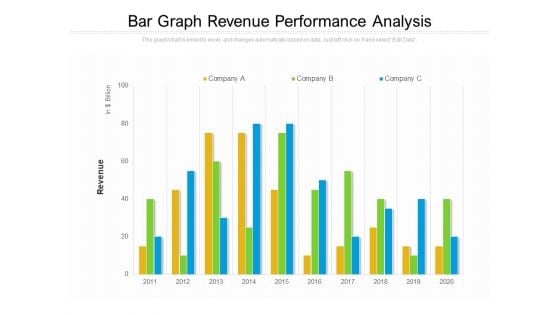
Bar Graph Revenue Performance Analysis Ppt PowerPoint Presentation Pictures Samples PDF
Presenting this set of slides with name bar graph revenue performance analysis ppt powerpoint presentation pictures samples pdf. The topics discussed in these slide is bar graph revenue performance analysis. This is a completely editable PowerPoint presentation and is available for immediate download. Download now and impress your audience.
Revenue Split Pie Graph Vector Icon Ppt PowerPoint Presentation Show Elements PDF
Showcasing this set of slides titled revenue split pie graph vector icon ppt powerpoint presentation show elements pdf. The topics addressed in these templates are revenue split pie graph vector icon. All the content presented in this PPT design is completely editable. Download it and make adjustments in color, background, font etc. as per your unique business setting.
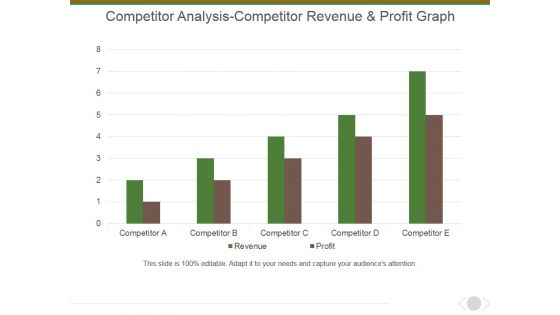
Competitor Analysis Competitor Revenue And Profit Graph Ppt PowerPoint Presentation Gallery Vector
This is a competitor analysis competitor revenue and profit graph ppt powerpoint presentation gallery vector. This is a five stage process. The stages in this process are bar graph, marketing, management, business, presentation.
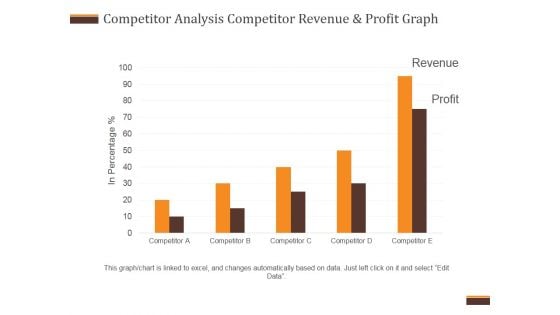
Competitor Analysis Competitor Revenue And Profit Graph Ppt PowerPoint Presentation Inspiration
This is a competitor analysis competitor revenue and profit graph ppt powerpoint presentation inspiration. This is a five stage process. The stages in this process are business, marketing, management, profit, revenue.
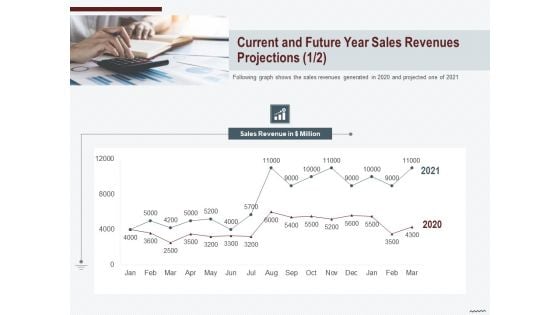
Cross Sell In Banking Industry Current And Future Year Sales Revenues Projections Graph Ppt Portfolio Design Ideas PDF
Deliver an awe inspiring pitch with this creative cross sell in banking industry current and future year sales revenues projections graph ppt portfolio design ideas pdf bundle. Topics like current and future year sales revenues projections can be discussed with this completely editable template. It is available for immediate download depending on the needs and requirements of the user.
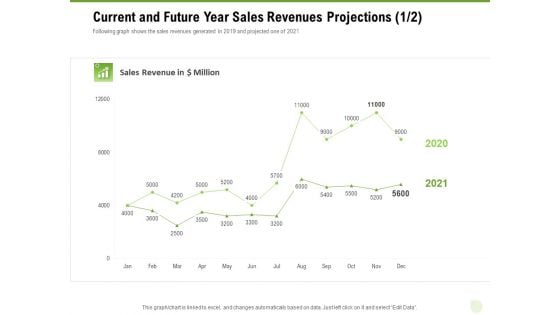
Cross Selling Of Retail Banking Products Current And Future Year Sales Revenues Projections Graph Ppt Visual Aids Backgrounds PDF
Deliver an awe inspiring pitch with this creative cross selling of retail banking products current and future year sales revenues projections graph ppt visual aids backgrounds pdf bundle. Topics like current and future year sales revenues projections can be discussed with this completely editable template. It is available for immediate download depending on the needs and requirements of the user.

Graph Showing Revenue Through Social Media Marketing Ppt PowerPoint Presentation Gallery Professional PDF
Presenting this set of slides with name graph showing revenue through social media marketing ppt powerpoint presentation gallery professional pdf. The topics discussed in these slide is graph showing revenue through social media marketing. This is a completely editable PowerPoint presentation and is available for immediate download. Download now and impress your audience.
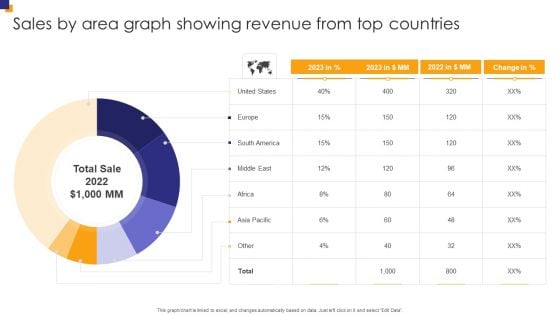
Sales By Area Graph Showing Revenue From Top Countries Inspiration PDF
Showcasing this set of slides titled Sales By Area Graph Showing Revenue From Top Countries Inspiration PDF. The topics addressed in these templates are Sales Area, Graph Showing, Revenue Countries. All the content presented in this PPT design is completely editable. Download it and make adjustments in color, background, font etc. as per your unique business setting.
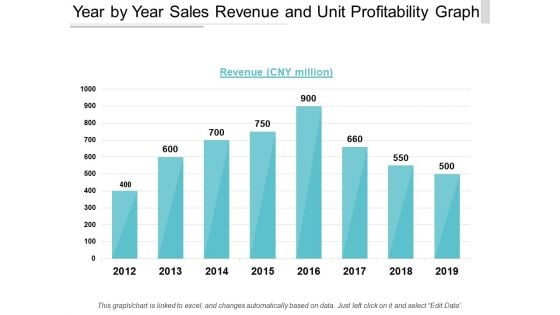
Year By Year Sales Revenue And Unit Profitability Graph Ppt PowerPoint Presentation Show Professional
This is a year by year sales revenue and unit profitability graph ppt powerpoint presentation show professional. This is a eight stage process. The stages in this process are business unit profitability, profitable organization, corporate unit profitability.
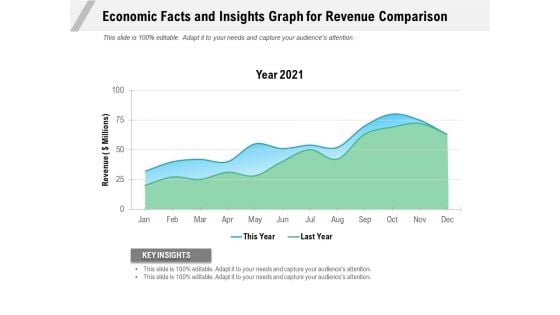
Economic Facts And Insights Graph For Revenue Comparison Ppt PowerPoint Presentation Gallery Portfolio PDF
Pitch your topic with ease and precision using this economic facts and insights graph for revenue comparison ppt powerpoint presentation gallery portfolio pdf. This layout presents information on year 2021, revenue, key insights. It is also available for immediate download and adjustment. So, changes can be made in the color, design, graphics or any other component to create a unique layout.
Gross And Net Revenue Comparison Shown By Graph Ppt PowerPoint Presentation File Icons PDF
Presenting this set of slides with name gross and net revenue comparison shown by graph ppt powerpoint presentation file icons pdf. The topics discussed in these slides are gross profit, net profit. This is a completely editable PowerPoint presentation and is available for immediate download. Download now and impress your audience.

Graph Showing Revenue And Profit From Operations Ppt PowerPoint Presentation File Information PDF
Presenting this set of slides with name graph showing revenue and profit from operations ppt powerpoint presentation file information pdf. The topics discussed in these slides are gross revenue, gross profit, sales cost. This is a completely editable PowerPoint presentation and is available for immediate download. Download now and impress your audience.
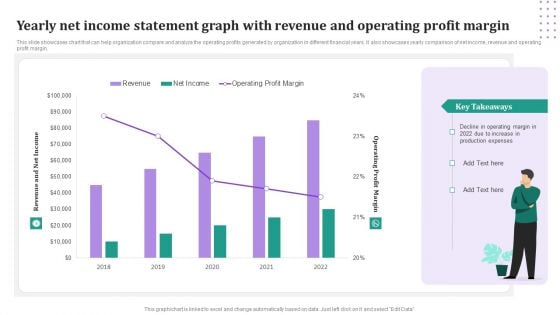
Yearly Net Income Statement Graph With Revenue And Operating Profit Margin Download PDF
This slide showcases chart that can help organization compare and analyze the operating profits generated by organization in different financial years. It also showcases yearly comparison of net income, revenue and operating profit margin. Pitch your topic with ease and precision using this Yearly Net Income Statement Graph With Revenue And Operating Profit Margin Download PDF. This layout presents information on Revenue, Net Income, Operating Profit Margin. It is also available for immediate download and adjustment. So, changes can be made in the color, design, graphics or any other component to create a unique layout.
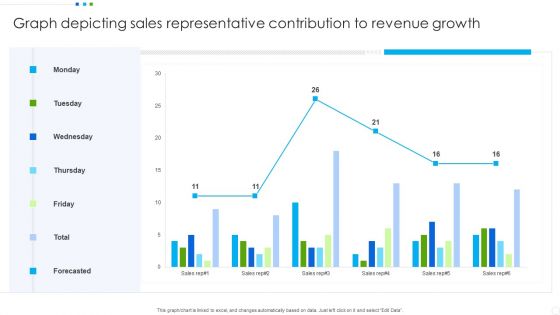
Graph Depicting Sales Representative Contribution To Revenue Growth Graphics PDF
Showcasing this set of slides titled Graph Depicting Sales Representative Contribution To Revenue Growth Graphics PDF. The topics addressed in these templates are Graph Depicting Sales, Revenue Growth. All the content presented in this PPT design is completely editable. Download it and make adjustments in color, background, font etc. as per your unique business setting.
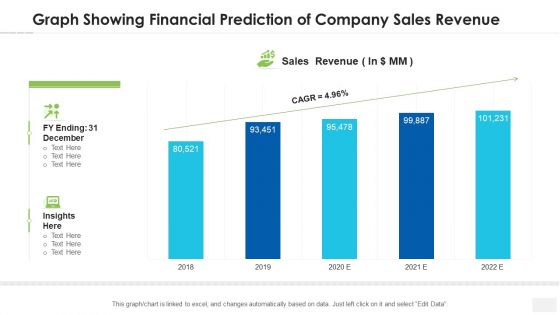
Graph Showing Financial Prediction Of Company Sales Revenue Topics PDF
Pitch your topic with ease and precision using this graph showing financial prediction of company sales revenue topics pdf. This layout presents information on graph showing financial prediction of company sales revenue. It is also available for immediate download and adjustment. So, changes can be made in the color, design, graphics or any other component to create a unique layout.
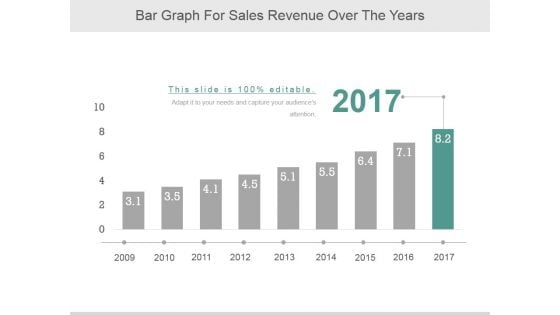
Bar Graph For Sales Revenue Over The Years Ppt PowerPoint Presentation Professional
This is a bar graph for sales revenue over the years ppt powerpoint presentation professional. This is a nine stage process. The stages in this process are business, marketing, growth, bar, years.

Bar Graph Showing Revenues Generated By Sales Department Ppt Portfolio Graphics Example PDF
This graph or chart is linked to excel, and changes automatically based on data. Just left click on it and select edit data. Showcasing this set of slides titled bar graph showing revenues generated by sales department ppt portfolio graphics example pdf. The topics addressed in these templates are yearly sales revenues, sales team, profits. All the content presented in this PPT design is completely editable. Download it and make adjustments in color, background, font etc. as per your unique business setting.

Bar Graph Depicting Business Sales Revenue With Cagr Value Ppt PowerPoint Presentation File Outline PDF
Showcasing this set of slides titled bar graph depicting business sales revenue with cagr value ppt powerpoint presentation file outline pdf. The topics addressed in these templates are bar graph depicting business sales revenue with cagr value. All the content presented in this PPT design is completely editable. Download it and make adjustments in color, background, font etc. as per your unique business setting.
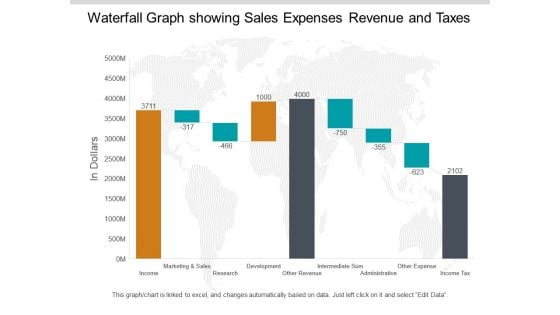
Waterfall Graph Showing Sales Expenses Revenue And Taxes Ppt PowerPoint Presentation Pictures Summary
This is a waterfall graph showing sales expenses revenue and taxes ppt powerpoint presentation pictures summary. This is a three stage process. The stages in this process are profit and loss, balance sheet, income statement, benefit and loss.
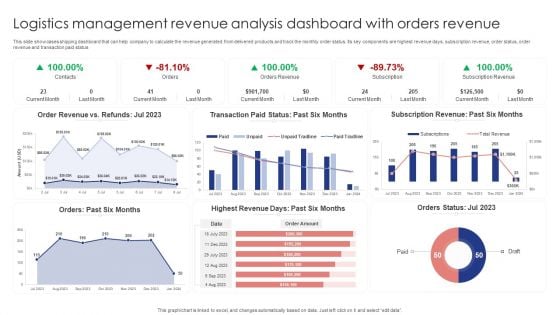
Logistics Management Revenue Analysis Dashboard With Orders Revenue Brochure PDF
This slide showcases shipping dashboard that can help company to calculate the revenue generated from delivered products and track the monthly order status. Its key components are highest revenue days, subscription revenue, order status, order revenue and transaction paid status. Showcasing this set of slides titled Logistics Management Revenue Analysis Dashboard With Orders Revenue Brochure PDF. The topics addressed in these templates are Order Revenue, Transaction Paid, Subscription Revenue. All the content presented in this PPT design is completely editable. Download it and make adjustments in color, background, font etc. as per your unique business setting.
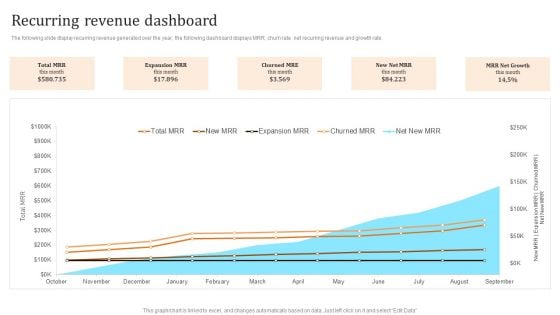
Membership Based Revenue Plan Recurring Revenue Dashboard Pictures PDF
The following slide display recurring revenue generated over the year, the following dashboard displays MRR, churn rate net recurring revenue and growth rate. Formulating a presentation can take up a lot of effort and time, so the content and message should always be the primary focus. The visuals of the PowerPoint can enhance the presenters message, so our Membership Based Revenue Plan Recurring Revenue Dashboard Pictures PDF was created to help save time. Instead of worrying about the design, the presenter can concentrate on the message while our designers work on creating the ideal templates for whatever situation is needed. Slidegeeks has experts for everything from amazing designs to valuable content, we have put everything into Membership Based Revenue Plan Recurring Revenue Dashboard Pictures PDF
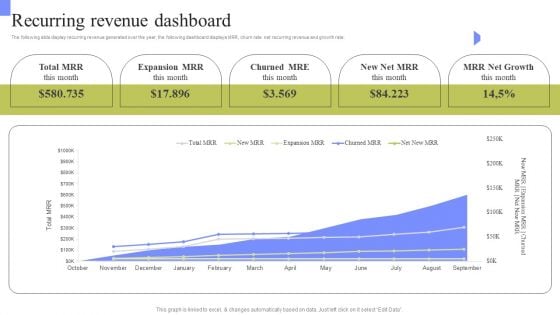
Periodic Revenue Model Recurring Revenue Dashboard Infographics PDF
The following slide display recurring revenue generated over the year, the following dashboard displays MRR, churn rate net recurring revenue and growth rate. Slidegeeks is one of the best resources for PowerPoint templates. You can download easily and regulate Periodic Revenue Model Recurring Revenue Dashboard Infographics PDF for your personal presentations from our wonderful collection. A few clicks is all it takes to discover and get the most relevant and appropriate templates. Use our Templates to add a unique zing and appeal to your presentation and meetings. All the slides are easy to edit and you can use them even for advertisement purposes.
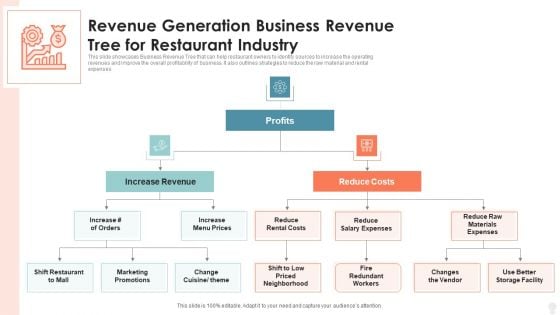
Revenue Generation Business Revenue Tree For Restaurant Industry Formats PDF
This slide showcases Business Revenue Tree that can help restaurant owners to identify sources to increase the operating revenues and improve the overall profitability of business. It also outlines strategies to reduce the raw material and rental expenses. Presenting revenue generation business revenue tree for restaurant industry formats pdf to dispense important information. This template comprises four stages. It also presents valuable insights into the topics including increase revenue, marketing promotions, profits. This is a completely customizable PowerPoint theme that can be put to use immediately. So, download it and address the topic impactfully.
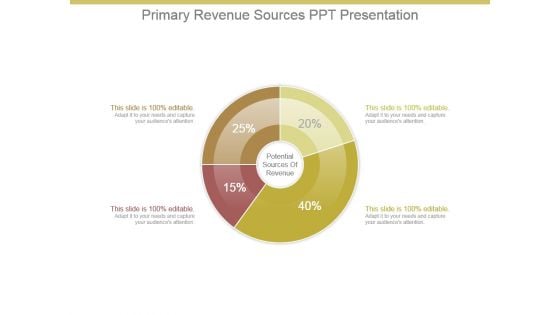
Primary Revenue Sources Ppt Presentation
This is a primary revenue sources ppt presentation. This is a four stage process. The stages in this process are potential sources of revenue.
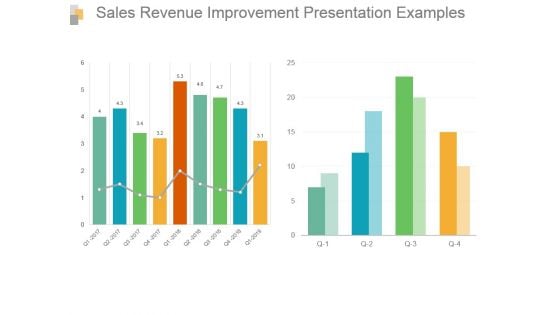
Sales Revenue Improvement Presentation Examples
This is a sales revenue improvement presentation examples. This is a two stage process. The stages in this process are bar graph, growth, sales, data, analysis.

Yearly Selling Forecasts Revenue Chart Summary PDF
This slide covers projections for yearly revenue generation from product sales. It includes forecasted revenue for different years and a graph depicting the projected sales revenue growth. Showcasing this set of slides titled Yearly Selling Forecasts Revenue Chart Summary PDF. The topics addressed in these templates are Project Sales Revenue, Forecasts Revenue Chart. All the content presented in this PPT design is completely editable. Download it and make adjustments in color, background, font etc. as per your unique business setting.
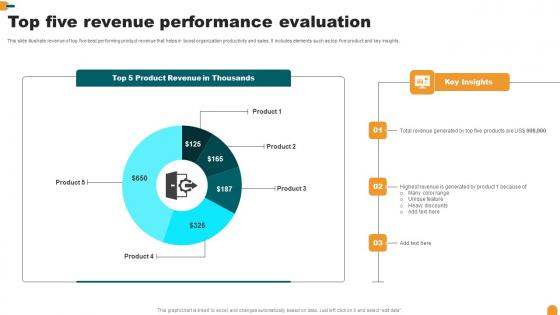
Top Five Revenue Performance Evaluation Template Pdf
This slide illustrate revenue of top five best performing product revenue that helps in boost organization productivity and sales. It includes elements such as top five product and key insights.Showcasing this set of slides titled Top Five Revenue Performance Evaluation Template Pdf The topics addressed in these templates are Unique Feature, Heavy Discounts, Revenue Generated All the content presented in this PPT design is completely editable. Download it and make adjustments in color, background, font etc. as per your unique business setting. This slide illustrate revenue of top five best performing product revenue that helps in boost organization productivity and sales. It includes elements such as top five product and key insights.

Revenue Talent Recruitment Company Outline Summary Pdf
The slide showcases company revenue for last six years along with forecasted revenue for 4F Y22. It also depicts CAGR and key insights for revenue analysis. Formulating a presentation can take up a lot of effort and time, so the content and message should always be the primary focus. The visuals of the PowerPoint can enhance the presenters message, so our Revenue Talent Recruitment Company Outline Summary Pdf was created to help save time. Instead of worrying about the design, the presenter can concentrate on the message while our designers work on creating the ideal templates for whatever situation is needed. Slidegeeks has experts for everything from amazing designs to valuable content, we have put everything into Revenue Talent Recruitment Company Outline Summary Pdf The slide showcases company revenue for last six years along with forecasted revenue for Q4F Y22. It also depicts CAGR and key insights for revenue analysis.
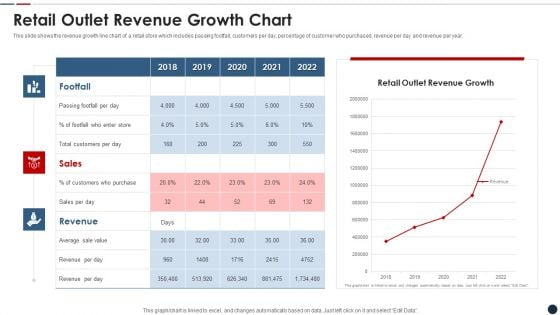
Retail Outlet Revenue Growth Chart Mockup PDF
This slide shows the revenue growth line chart of a retail store which includes passing footfall, customers per day, percentage of customer who purchased, revenue per day and revenue per year. Pitch your topic with ease and precision using this retail outlet revenue growth chart mockup pdf This layout presents information on Retail outlet revenue growth chart It is also available for immediate download and adjustment. So, changes can be made in the color, design, graphics or any other component to create a unique layout.

Two Consecutive Years Revenue Comparison Topics PDF
This slide showcases profitability comparison with the help of a trend chart. It represents revenue, cost of goods sold, gross profit, net profit, etc. Pitch your topic with ease and precision using this Two Consecutive Years Revenue Comparison Topics PDF. This layout presents information on Revenue, Gross Profit, Net Income. It is also available for immediate download and adjustment. So, changes can be made in the color, design, graphics or any other component to create a unique layout.
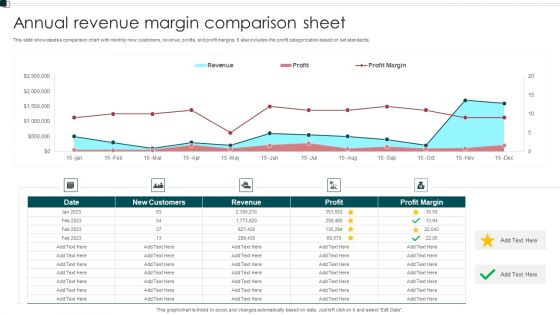
Annual Revenue Margin Comparison Sheet Information PDF
This slide showcases a comparison chart with monthly new customers, revenue, profits, and profit margins. It also includes the profit categorization based on set standards. Showcasing this set of slides titled Annual Revenue Margin Comparison Sheet Information PDF. The topics addressed in these templates are Customers, Revenue, Profit Margin. All the content presented in this PPT design is completely editable. Download it and make adjustments in color, background, font etc. as per your unique business setting.
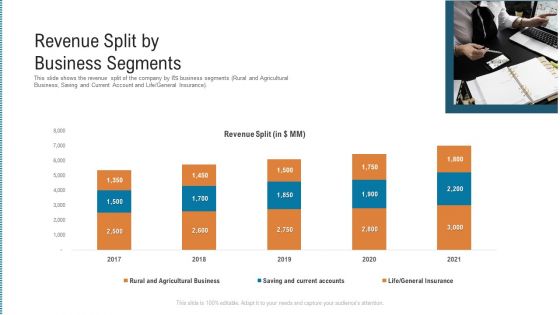
Revenue Split By Business Segments Elements PDF
This slide shows the revenue split of the company by its business segments Rural and Agricultural Business, Saving and Current Account and Life or General Insurance. Deliver an awe-inspiring pitch with this creative revenue split by business segments elements pdf. bundle. Topics like revenue split by business segments can be discussed with this completely editable template. It is available for immediate download depending on the needs and requirements of the user.
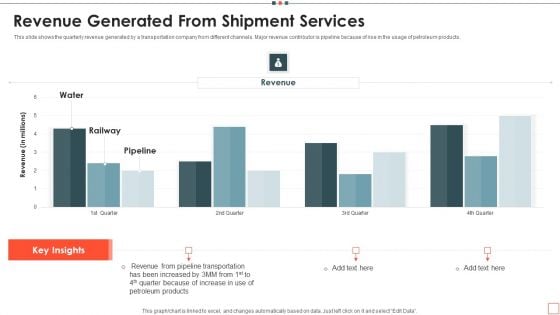
Revenue Generated From Shipment Services Topics PDF
This slide shows the quarterly revenue generated by a transportation company from different channels. Major revenue contributor is pipeline because of rise in the usage of petroleum products. Pitch your topic with ease and precision using this Shipment Services Company Monthly Dashboard Designs PDF. This layout presents information on Revenue Generated From Shipment Services. It is also available for immediate download and adjustment. So, changes can be made in the color, design, graphics or any other component to create a unique layout.
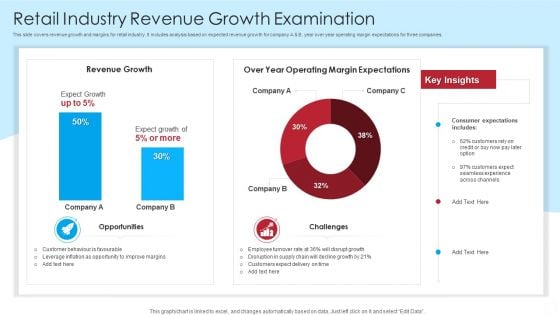
Retail Industry Revenue Growth Examination Slides PDF
This slide covers revenue growth and margins for retail industry. It includes analysis based on expected revenue growth for company A B, year over year operating margin expectations for three companies.Showcasing this set of slides titled Retail Industry Revenue Growth Examination Slides PDF. The topics addressed in these templates are Expect Growth, Consumer Expectations, Leverage Inflation. All the content presented in this PPT design is completely editable. Download it and make adjustments in color, background, font etc. as per your unique business setting.
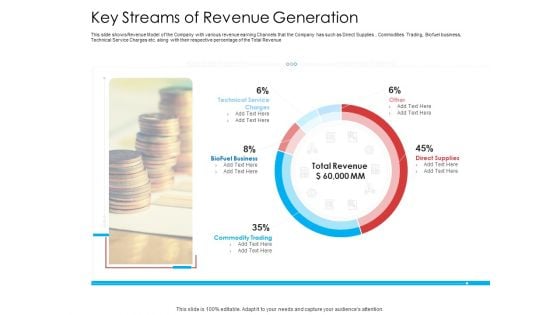
Key Streams Of Revenue Generation Clipart PDF
This slide shows Revenue Model of the Company with various revenue earning Channels that the Company has such as Direct Supplies, Commodities Trading, Biofuel business, Technical Service Charges etc. along with their respective percentage of the Total Revenue. Deliver and pitch your topic in the best possible manner with this key streams of revenue generation clipart pdf. Use them to share invaluable insights on direct supplies, commodity trading, technical service charges and impress your audience. This template can be altered and modified as per your expectations. So, grab it now.
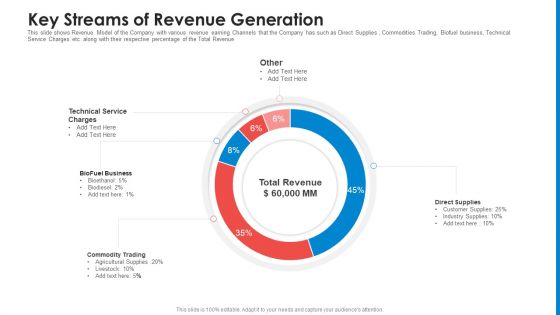
Key Streams Of Revenue Generation Guidelines PDF
This slide shows Revenue Model of the Company with various revenue earning Channels that the Company has such as Direct Supplies, Commodities Trading, Biofuel business, Technical Service Charges etc. along with their respective percentage of the Total Revenue Deliver an awe inspiring pitch with this creative key streams of revenue generation guidelines pdf. bundle. Topics like dirct supplies, commodity trading, biofuel business can be discussed with this completely editable template. It is available for immediate download depending on the needs and requirements of the user.
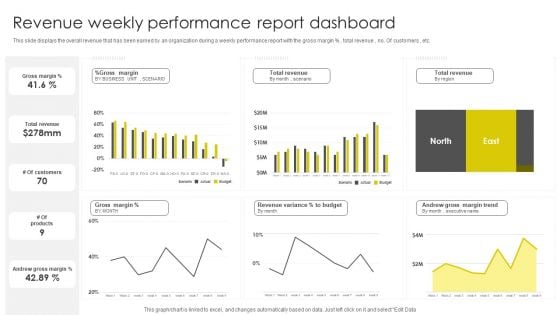
Revenue Weekly Performance Report Dashboard Topics PDF
This slide displays the overall revenue that has been earned by an organization during a weekly performance report with the gross margin percent , total revenue , no. Of customers , etc. Showcasing this set of slides titled Revenue Weekly Performance Report Dashboard Topics PDF. The topics addressed in these templates are Gross Margin, Total Revenue, Customers. All the content presented in this PPT design is completely editable. Download it and make adjustments in color, background, font etc. as per your unique business setting.
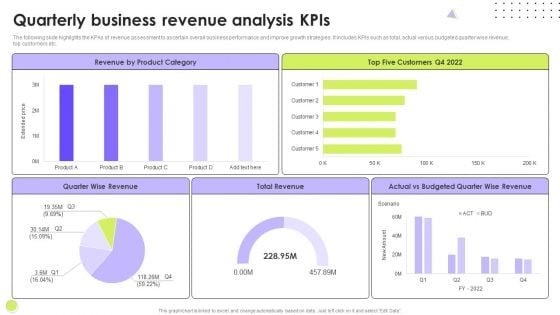
Quarterly Business Revenue Analysis Kpis Slides PDF
The following slide highlights the KPAs of revenue assessment to ascertain overall business performance and improve growth strategies. It includes KPIs such as total, actual versus budgeted quarter wise revenue, top customers etc. Showcasing this set of slides titled Quarterly Business Revenue Analysis Kpis Slides PDF. The topics addressed in these templates are Quarter Wise Revenue, Customers, Budgeted Quarter. All the content presented in this PPT design is completely editable. Download it and make adjustments in color, background, font etc. as per your unique business setting.
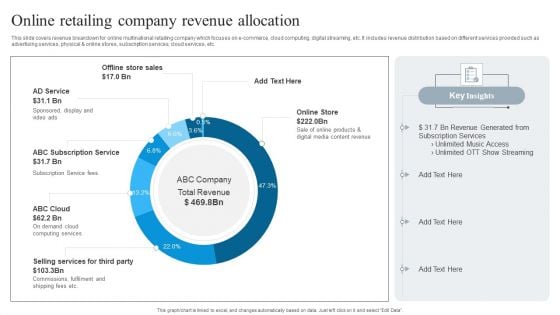
Online Retailing Company Revenue Allocation Rules PDF
This slide covers revenue breakdown for online multinational retailing company which focuses on e-commerce, cloud computing, digital streaming, etc. It includes revenue distribution based on different services provided such as advertising services, physical and online stores, subscription services, cloud services, etc. bShowcasing this set of slides titled Online Retailing Company Revenue Allocation Rules PDF. The topics addressed in these templates are Online Retailing, Company Revenue Allocation. All the content presented in this PPT design is completely editable. Download it and make adjustments in color, background, font etc. as per your unique business setting.
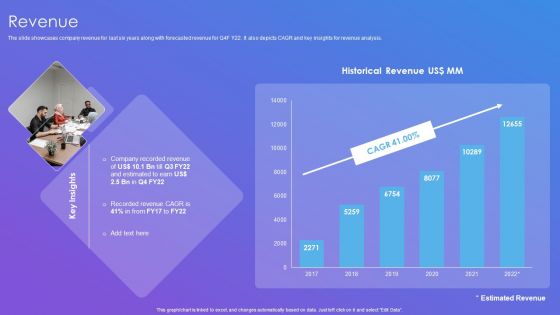
Linkedin Company Outline Revenue Designs PDF
Deliver and pitch your topic in the best possible manner with this Linkedin Company Outline Revenue Designs PDF. Use them to share invaluable insights on Company Recorded, Estimated To Earn, Recorded Revenue and impress your audience. This template can be altered and modified as per your expectations. So, grab it now.
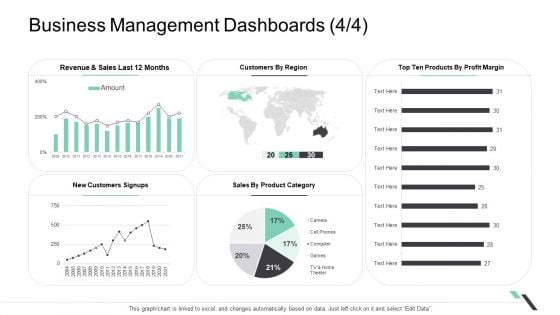
Business Management Dashboards Revenue Designs PDF
Deliver and pitch your topic in the best possible manner with this business management dashboards revenue designs pdf. Use them to share invaluable insights on revenue and sales, sales by product category and impress your audience. This template can be altered and modified as per your expectations. So, grab it now.
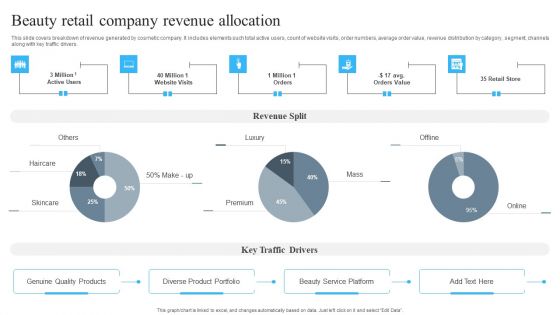
Beauty Retail Company Revenue Allocation Pictures PDF
Showcasing this set of slides titled Beauty Retail Company Revenue Allocation Pictures PDF. The topics addressed in these templates are Beauty Retail, Company Revenue Allocation. All the content presented in this PPT design is completely editable. Download it and make adjustments in color, background, font etc. as per your unique business setting.

 Home
Home