Revenue Graph
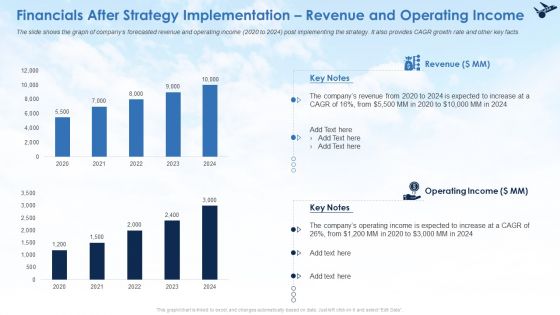
Financials After Strategy Implementation Revenue And Operating Income Elements PDF
The slide shows the graph of companys forecasted revenue and operating income 2020 to 2024 post implementing the strategy. It also provides CAGR growth rate and other key facts. Deliver and pitch your topic in the best possible manner with this financials after strategy implementation revenue and operating income elements pdf. Use them to share invaluable insights on revenue, operating income and impress your audience. This template can be altered and modified as per your expectations. So, grab it now.
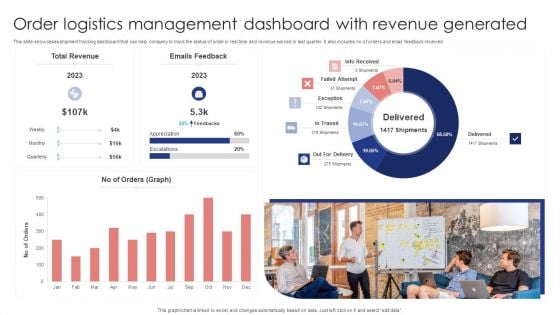
Order Logistics Management Dashboard With Revenue Generated Slides PDF
This slide showcases shipment tracking dashboard that can help company to track the status of order in real time and revenue earned in last quarter. It also includes no of orders and email feedback received. Showcasing this set of slides titled Order Logistics Management Dashboard With Revenue Generated Slides PDF. The topics addressed in these templates are Total Revenue, Emails Feedback, Orders Graph. All the content presented in this PPT design is completely editable. Download it and make adjustments in color, background, font etc. as per your unique business setting.
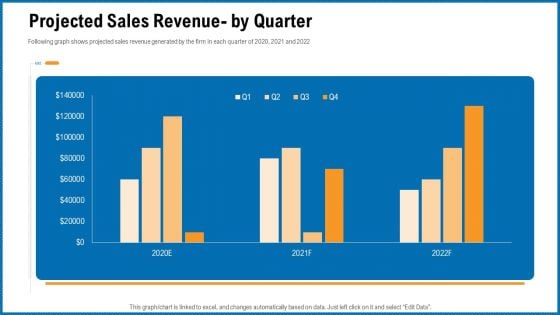
Building Corporate Monopoly Projected Sales Revenue By Quarter Summary PDF
Following graph shows projected sales revenue generated by the firm in each quarter of 2020, 2021 and 2022. Deliver an awe inspiring pitch with this creative building corporate monopoly projected sales revenue by quarter summary pdf bundle. Topics like projected sales revenue by quarter can be discussed with this completely editable template. It is available for immediate download depending on the needs and requirements of the user.
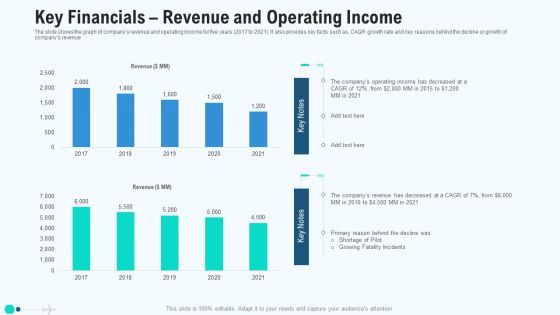
Key Financials Revenue And Operating Income Graphics PDF
The slide shows the graph of companys revenue and operating income for five years 2017 to 2021. It also provides key facts such as, CAGR growth rate and key reasons behind the decline or growth of companys revenue. Deliver an awe inspiring pitch with this creative key financials revenue and operating income graphics pdf bundle. Topics like key financials revenue and operating income can be discussed with this completely editable template. It is available for immediate download depending on the needs and requirements of the user.
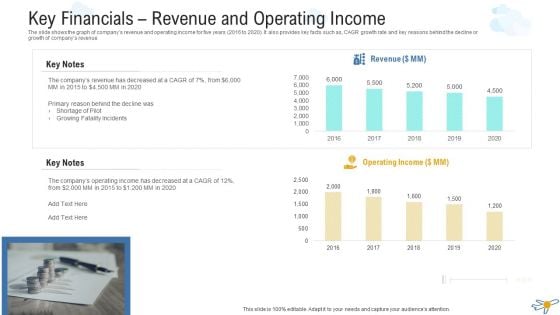
Key Financials Revenue And Operating Income Topics PDF
The slide shows the graph of companys revenue and operating income for five years 2016 to 2020. It also provides key facts such as, CAGR growth rate and key reasons behind the decline or growth of companys revenue. Deliver and pitch your topic in the best possible manner with this key financials revenue and operating income topics pdf. Use them to share invaluable insights on revenue, operating income, key notes and impress your audience. This template can be altered and modified as per your expectations. So, grab it now.
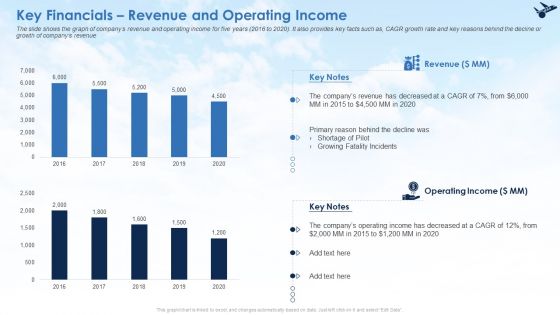
Key Financials Revenue And Operating Income Ppt Ideas Show PDF
The slide shows the graph of companys revenue and operating income for five years 2016 to 2020. It also provides key facts such as, CAGR growth rate and key reasons behind the decline or growth of companys revenue. Deliver and pitch your topic in the best possible manner with this key financials revenue and operating income ppt ideas show pdf. Use them to share invaluable insights on revenue, operating income and impress your audience. This template can be altered and modified as per your expectations. So, grab it now.
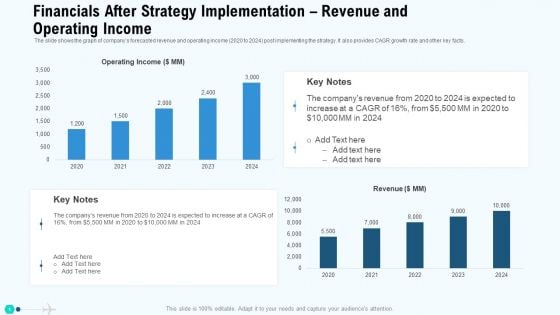
Financials After Strategy Implementation Revenue And Operating Income Themes PDF
The slide shows the graph of companys forecasted revenue and operating income 2020 to 2024 post implementing the strategy. It also provides CAGR growth rate and other key facts. Deliver and pitch your topic in the best possible manner with this financials after strategy implementation revenue and operating income themes pdf. Use them to share invaluable insights on financials after strategy implementation revenue and operating income and impress your audience. This template can be altered and modified as per your expectations. So, grab it now.
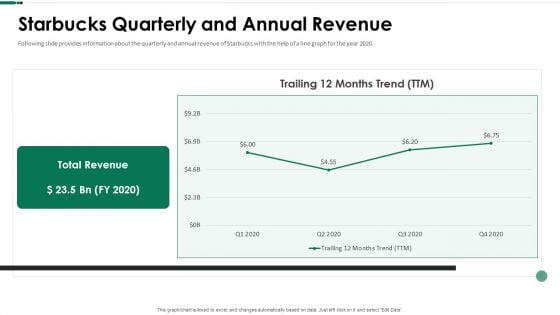
Starbucks Quarterly And Annual Revenue Ppt Slides Introduction PDF
Following slide provides information about the quarterly and annual revenue of Starbucks with the help of a line graph for the year 2020. Deliver and pitch your topic in the best possible manner with this starbucks quarterly and annual revenue ppt slides introduction pdf. Use them to share invaluable insights on starbucks quarterly and annual revenue and impress your audience. This template can be altered and modified as per your expectations. So, grab it now.
Economic Graph PowerPoint Icon C
economic graph blue background for business and finance Our Economic Graph PowerPoint Icon C will cause a celebration. Put your audience in a festive mood.
Economic Graph PowerPoint Icon S
economic graph blue background for business and finance Educate them on the basics of fatherhood . Prepare them well with our Economic Graph PowerPoint Icon S.
Dollar Graph PowerPoint Icon S
3d yellow graph showing rise in dollar benefits or earnings Get enticed by the look of our Dollar Graph PowerPoint Icon S. They creare a captivating aura.

Graph Business PowerPoint Template 1010
Business graph. Red arrow and cubes with texture of the dollar isolated on white background. High quality 3d render. Educate teams with our Graph Business PowerPoint Template 1010. Download without worries with our money back guaranteee.
Dollar Graph PowerPoint Icon C
3d yellow graph showing rise in dollar benefits or earnings With our Dollar Graph PowerPoint Icon C you will surely fare well. They take your address to a higher level.
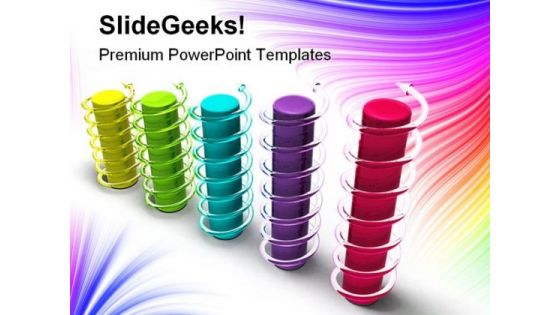
Graph Business PowerPoint Template 0910
Business 3d graph multi colored with spiral arrows around bars. Get the break you have been waiting for. Earn it with the help of our Graph Business PowerPoint Template 0910.

Business Graph PowerPoint Template 0910
Abstract background with blue arrow on blue background Achieve strong & sustainable financial gains with our Business Graph PowerPoint Template 0910. They will make you look good.
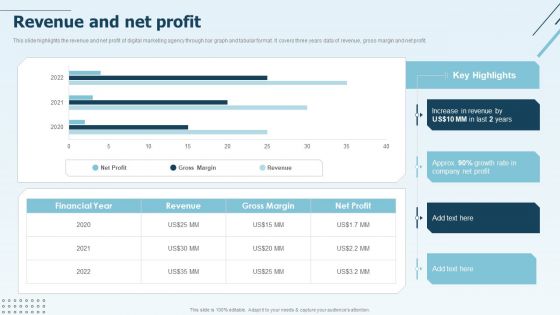
Digital Marketing Company Profile Revenue And Net Profit Download PDF
This slide highlights the revenue and net profit of digital marketing agency through bar graph and tabular format. It covers three years data of revenue, gross margin and net profit.Deliver an awe inspiring pitch with this creative Digital Marketing Company Profile Revenue And Net Profit Download PDF bundle. Topics like Increase Revenue, Gross Margin, Net Profit can be discussed with this completely editable template. It is available for immediate download depending on the needs and requirements of the user.
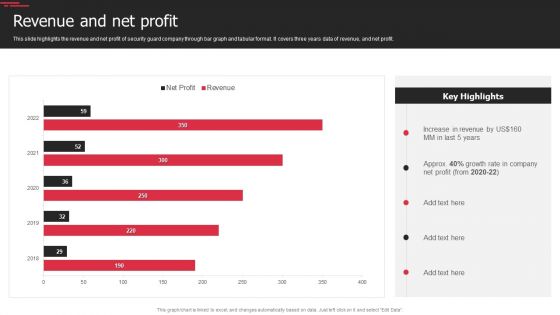
Security Agency Business Profile Revenue And Net Profit Structure PDF
This slide highlights the revenue and net profit of security guard company through bar graph and tabular format. It covers three years data of revenue, and net profit. Deliver and pitch your topic in the best possible manner with this Security Agency Business Profile Revenue And Net Profit Structure PDF. Use them to share invaluable insights on Growth Rate, Net Profit, Revenue and impress your audience. This template can be altered and modified as per your expectations. So, grab it now.
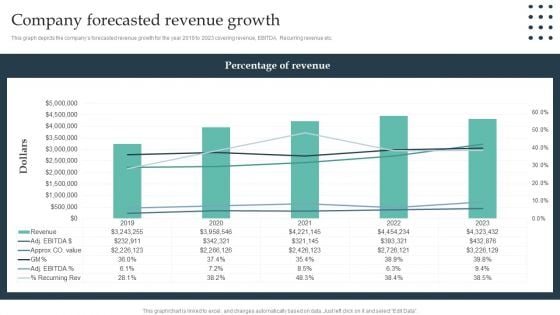
Enterprise Consumer Technology Management Company Forecasted Revenue Growth Template PDF
This graph depicts the companys forecasted revenue growth for the year 2019 to 2023 covering revenue, EBITDA, Recurring revenue etc. Presenting this PowerPoint presentation, titled Enterprise Consumer Technology Management Company Forecasted Revenue Growth Template PDF, with topics curated by our researchers after extensive research. This editable presentation is available for immediate download and provides attractive features when used. Download now and captivate your audience. Presenting this Enterprise Consumer Technology Management Company Forecasted Revenue Growth Template PDF. Our researchers have carefully researched and created these slides with all aspects taken into consideration. This is a completely customizable Enterprise Consumer Technology Management Company Forecasted Revenue Growth Template PDF that is available for immediate downloading. Download now and make an impact on your audience. Highlight the attractive features available with our PPTs.
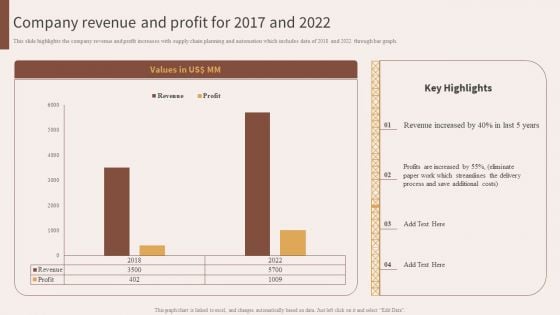
Company Revenue And Profit For 2017 And 2022 Structure PDF
This slide highlights the company revenue and profit increases with supply chain planning and automation which includes data of 2018 and 2022 through bar graph. Boost your pitch with our creative Company Revenue And Profit For 2017 And 2022 Structure PDF. Deliver an awe-inspiring pitch that will mesmerize everyone. Using these presentation templates you will surely catch everyones attention. You can browse the ppts collection on our website. We have researchers who are experts at creating the right content for the templates. So you do not have to invest time in any additional work. Just grab the template now and use them.
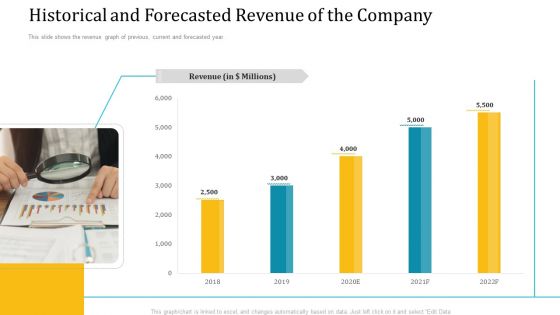
Historical And Forecasted Revenue Of The Company Ppt Pictures Graphics PDF
this slide shows the revenue graph of previous, current and forecasted year. Deliver an awe-inspiring pitch with this creative historical and forecasted revenue of the company ppt pictures graphics pdf bundle. Topics like historical and forecasted revenue of the company can be discussed with this completely editable template. It is available for immediate download depending on the needs and requirements of the user.
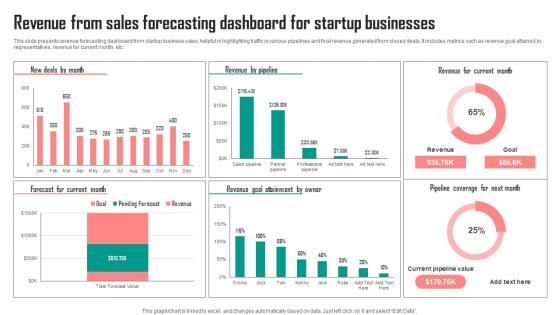
Revenue From Sales Forecasting Dashboard For Startup Businesses Graphics Pdf
This slide presents revenue forecasting dashboard from startup business sales, helpful in highlighting traffic in various pipelines and final revenue generated from closed deals. It includes metrics such as revenue goal attained by representatives, revenue for current month, etc. Showcasing this set of slides titled Revenue From Sales Forecasting Dashboard For Startup Businesses Graphics Pdf. The topics addressed in these templates are Owner, Current Month, Businesses. All the content presented in this PPT design is completely editable. Download it and make adjustments in color, background, font etc. as per your unique business setting. This slide presents revenue forecasting dashboard from startup business sales, helpful in highlighting traffic in various pipelines and final revenue generated from closed deals. It includes metrics such as revenue goal attained by representatives, revenue for current month, etc.
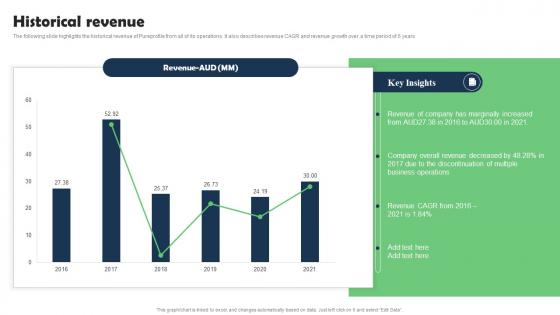
Historical Revenue Marketing Research Services Management Business Slides Pdf
The following slide highlights the historical revenue of Pureprofile from all of its operations. It also describes revenue CAGR and revenue growth over a time period of 6 years. Formulating a presentation can take up a lot of effort and time, so the content and message should always be the primary focus. The visuals of the PowerPoint can enhance the presenters message, so our Historical Revenue Marketing Research Services Management Business Slides Pdf was created to help save time. Instead of worrying about the design, the presenter can concentrate on the message while our designers work on creating the ideal templates for whatever situation is needed. Slidegeeks has experts for everything from amazing designs to valuable content, we have put everything into Historical Revenue Marketing Research Services Management Business Slides Pdf The following slide highlights the historical revenue of Pureprofile from all of its operations. It also describes revenue CAGR and revenue growth over a time period of 6 years.
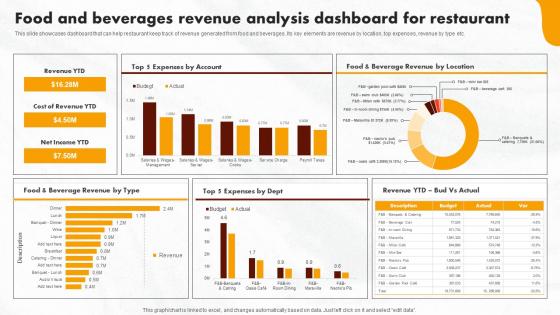
Online Promotional Activities Food And Beverages Revenue Background Pdf
This slide showcases dashboard that can help restaurant keep track of revenue generated from food and beverages. Its key elements are revenue by location, top expenses, revenue by type etc. Make sure to capture your audiences attention in your business displays with our gratis customizable Online Promotional Activities Food And Beverages Revenue Background Pdf. These are great for business strategies, office conferences, capital raising or task suggestions. If you desire to acquire more customers for your tech business and ensure they stay satisfied, create your own sales presentation with these plain slides. This slide showcases dashboard that can help restaurant keep track of revenue generated from food and beverages. Its key elements are revenue by location, top expenses, revenue by type etc.
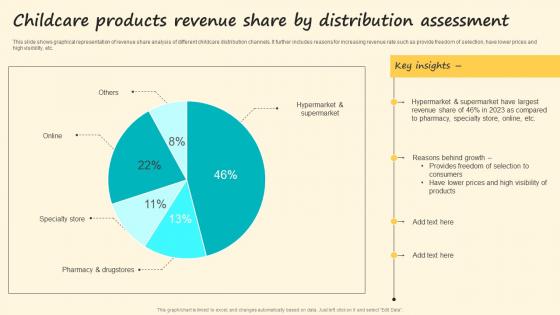
Childcare Products Revenue Share By Distribution Assessment Summary Pdf
This slide shows graphical representation of revenue share analysis of different childcare distribution channels. It further includes reasons for increasing revenue rate such as provide freedom of selection, have lower prices and high visibility, etc. Showcasing this set of slides titled Childcare Products Revenue Share By Distribution Assessment Summary Pdf The topics addressed in these templates are Childcare Products, Revenue Share, Distribution Assessment All the content presented in this PPT design is completely editable. Download it and make adjustments in color, background, font etc. as per your unique business setting. This slide shows graphical representation of revenue share analysis of different childcare distribution channels. It further includes reasons for increasing revenue rate such as provide freedom of selection, have lower prices and high visibility, etc.
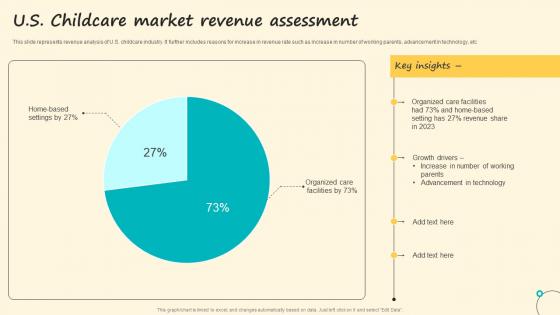
U S Childcare Market Revenue Assessment Microsoft Pdf
This slide represents revenue analysis of U.S. childcare industry. It further includes reasons for increase in revenue rate such as increase in number of working parents, advancement in technology, etc Pitch your topic with ease and precision using this U S Childcare Market Revenue Assessment Microsoft Pdf This layout presents information on U S Childcare, Market Revenue Assessment It is also available for immediate download and adjustment. So, changes can be made in the color, design, graphics or any other component to create a unique layout. This slide represents revenue analysis of U.S. childcare industry. It further includes reasons for increase in revenue rate such as increase in number of working parents, advancement in technology, etc
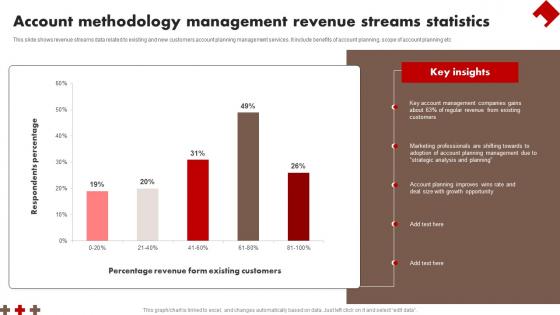
Account Methodology Management Revenue Streams Statistics Professional Pdf
This slide shows revenue streams data related to existing and new customers account planning management services. It include benefits of account planning, scope of account planning etc Pitch your topic with ease and precision using this Account Methodology Management Revenue Streams Statistics Professional Pdf This layout presents information on Account Methodology, Management Revenue, Streams Statistics It is also available for immediate download and adjustment. So, changes can be made in the color, design, graphics or any other component to create a unique layout. This slide shows revenue streams data related to existing and new customers account planning management services. It include benefits of account planning, scope of account planning etc
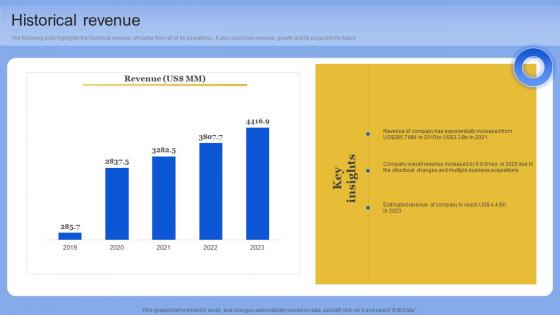
Historical Revenue Data Analytics Company Outline Information PDF
The following slide highlights the historical revenue of Kantar from all of its operations. It also describes revenue growth and its projection for future. This modern and well-arranged Historical Revenue Data Analytics Company Outline Information PDF provides lots of creative possibilities. It is very simple to customize and edit with the Powerpoint Software. Just drag and drop your pictures into the shapes. All facets of this template can be edited with Powerpoint, no extra software is necessary. Add your own material, put your images in the places assigned for them, adjust the colors, and then you can show your slides to the world, with an animated slide included. The following slide highlights the historical revenue of Kantar from all of its operations. It also describes revenue growth and its projection for future
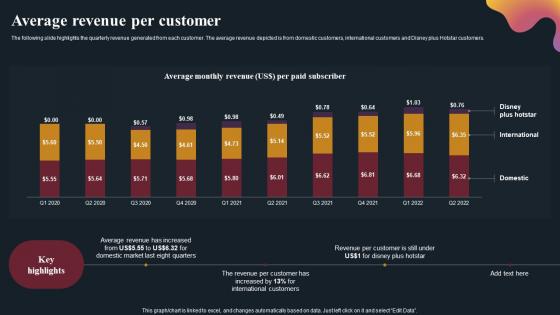
Average Revenue Per Customer OTT Platform Company Outline Portrait Pdf
The following slide highlights the quarterly revenue generated from each customer. The average revenue depicted is from domestic customers, international customers and Disney plus Hotstar customers. Boost your pitch with our creative Average Revenue Per Customer OTT Platform Company Outline Portrait Pdf Deliver an awe-inspiring pitch that will mesmerize everyone. Using these presentation templates you will surely catch everyones attention. You can browse the ppts collection on our website. We have researchers who are experts at creating the right content for the templates. So you do not have to invest time in any additional work. Just grab the template now and use them. The following slide highlights the quarterly revenue generated from each customer. The average revenue depicted is from domestic customers, international customers and Disney plus Hotstar customers.
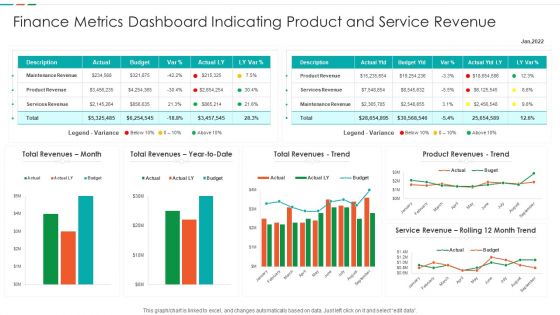
Finance Metrics Dashboard Indicating Product And Service Revenue Designs PDF
This graph or chart is linked to excel, and changes automatically based on data. Just left click on it and select edit data. Showcasing this set of slides titled Finance Metrics Dashboard Indicating Product And Service Revenue Designs PDF. The topics addressed in these templates are Maintenance Revenue Product, Revenue Product Revenues, Service Revenue Rolling. All the content presented in this PPT design is completely editable. Download it and make adjustments in color, background, font etc. as per your unique business setting.
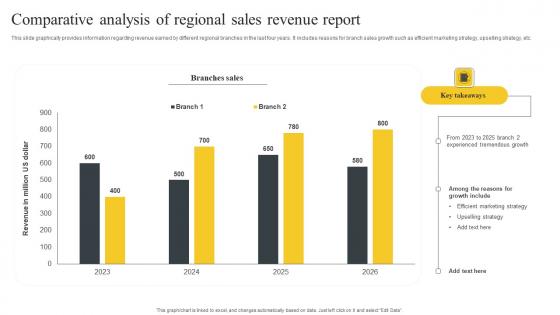
Comparative Analysis Of Regional Sales Revenue Report Inspiration Pdf
This slide graphically provides information regarding revenue earned by different regional branches in the last four years. It includes reasons for branch sales growth such as efficient marketing strategy, upselling strategy, etc. Showcasing this set of slides titled Comparative Analysis Of Regional Sales Revenue Report Inspiration Pdf. The topics addressed in these templates are Sales Revenue Report. All the content presented in this PPT design is completely editable. Download it and make adjustments in color, background, font etc. as per your unique business setting. This slide graphically provides information regarding revenue earned by different regional branches in the last four years. It includes reasons for branch sales growth such as efficient marketing strategy, upselling strategy, etc.
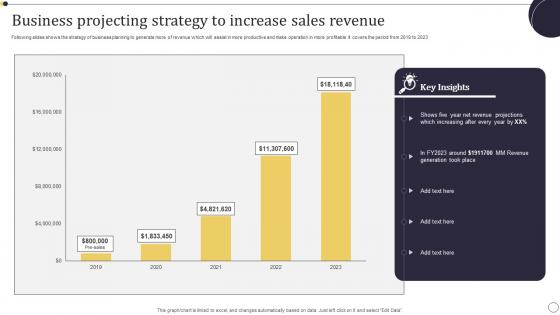
Business Projecting Strategy To Increase Sales Revenue Background Pdf
Following slides shows the strategy of business planning to generate more of revenue which will assist in more productive and make operation in more profitable .It covers the period from 2019 to 2023 Pitch your topic with ease and precision using this Business Projecting Strategy To Increase Sales Revenue Background Pdf. This layout presents information on Key Insights, Revenue Projections, Business Projecting Strategy. It is also available for immediate download and adjustment. So, changes can be made in the color, design, graphics or any other component to create a unique layout. Following slides shows the strategy of business planning to generate more of revenue which will assist in more productive and make operation in more profitable .It covers the period from 2019 to 2023
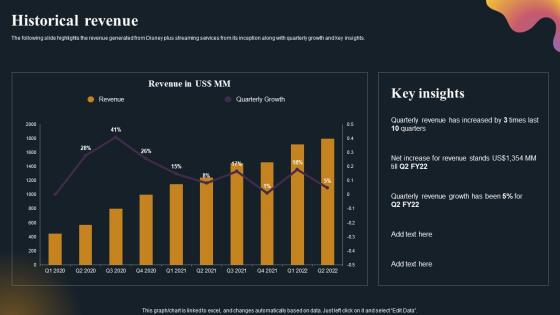
Historical Revenue OTT Platform Company Outline Diagrams Pdf
The following slide highlights the revenue generated from Disney plus streaming services from its inception along with quarterly growth and key insights. If you are looking for a format to display your unique thoughts, then the professionally designed Historical Revenue OTT Platform Company Outline Diagrams Pdf is the one for you. You can use it as a Google Slides template or a PowerPoint template. Incorporate impressive visuals, symbols, images, and other charts. Modify or reorganize the text boxes as you desire. Experiment with shade schemes and font pairings. Alter, share or cooperate with other people on your work. Download Historical Revenue OTT Platform Company Outline Diagrams Pdf and find out how to give a successful presentation. Present a perfect display to your team and make your presentation unforgettable. The following slide highlights the revenue generated from Disney plus streaming services from its inception along with quarterly growth and key insights.
Company Product Analysis Revenue Multinational Organization Customer Goods Icons Pdf
This slide highlights the Company Products Analysis with different segments which includes grooming, beauty care, home care and health care which showcases product revenue growth and return on assets. Whether you have daily or monthly meetings, a brilliant presentation is necessary. Company Product Analysis Revenue Multinational Organization Customer Goods Icons Pdf can be your best option for delivering a presentation. Represent everything in detail using Company Product Analysis Revenue Multinational Organization Customer Goods Icons Pdf and make yourself stand out in meetings. The template is versatile and follows a structure that will cater to your requirements. All the templates prepared by Slidegeeks are easy to download and edit. Our research experts have taken care of the corporate themes as well. So, give it a try and see the results. This slide highlights the Company Products Analysis with different segments which includes grooming, beauty care, home care and health care which showcases product revenue growth and return on assets.
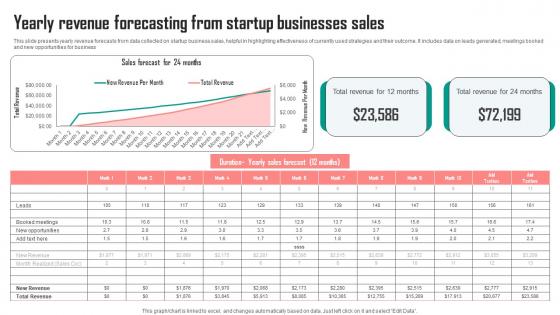
Yearly Revenue Forecasting From Startup Businesses Sales Graphics Pdf
This slide presents yearly revenue forecasts from data collected on startup business sales, helpful in highlighting effectiveness of currently used strategies and their outcome. It includes data on leads generated, meetings booked and new opportunities for business Pitch your topic with ease and precision using this Yearly Revenue Forecasting From Startup Businesses Sales Graphics Pdf. This layout presents information on Sales, Total Revenue, Months. It is also available for immediate download and adjustment. So, changes can be made in the color, design, graphics or any other component to create a unique layout. This slide presents yearly revenue forecasts from data collected on startup business sales, helpful in highlighting effectiveness of currently used strategies and their outcome. It includes data on leads generated, meetings booked and new opportunities for business
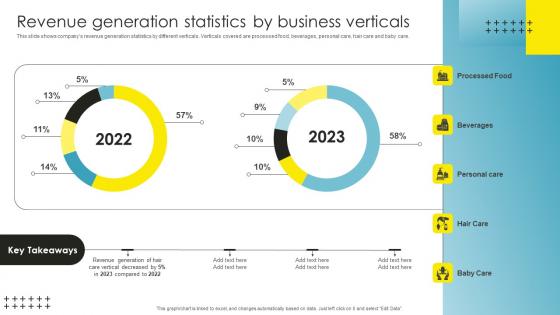
Revenue Generation Statistics Strategic Brand Management Background Pdf
This slide shows companys revenue generation statistics by different verticals. Verticals covered are processed food, beverages, personal care, hair care and baby care. Coming up with a presentation necessitates that the majority of the effort goes into the content and the message you intend to convey. The visuals of a PowerPoint presentation can only be effective if it supplements and supports the story that is being told. Keeping this in mind our experts created Revenue Generation Statistics Strategic Brand Management Background Pdf to reduce the time that goes into designing the presentation. This way, you can concentrate on the message while our designers take care of providing you with the right template for the situation. This slide shows companys revenue generation statistics by different verticals. Verticals covered are processed food, beverages, personal care, hair care and baby care.
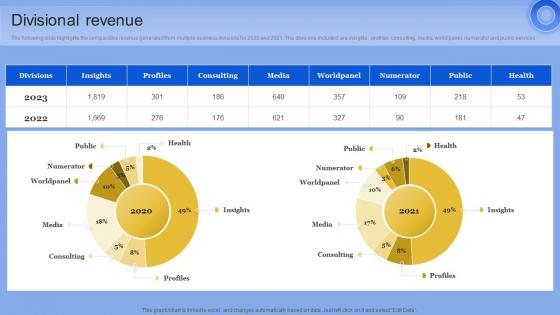
Divisional Revenue Data Analytics Company Outline Pictures PDF
The following slide highlights the comparative revenue generated from multiple business divisions for 2020 and 2021. The divisions included are insights, profiles, consulting, media, world panel, numerator and public services From laying roadmaps to briefing everything in detail, our templates are perfect for you. You can set the stage with your presentation slides. All you have to do is download these easy-to-edit and customizable templates. Divisional Revenue Data Analytics Company Outline Pictures PDF will help you deliver an outstanding performance that everyone would remember and praise you for. Do download this presentation today. The following slide highlights the comparative revenue generated from multiple business divisions for 2020 and 2021. The divisions included are insights, profiles, consulting, media, world panel, numerator and public services
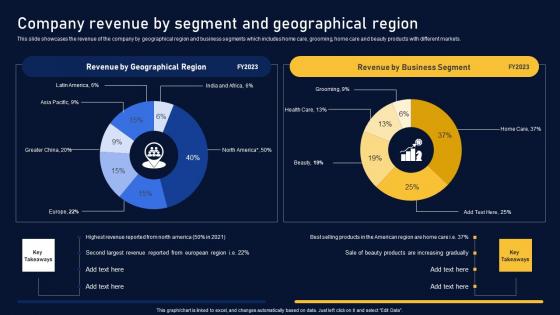
Company Revenue By Segment Multinational Organization Customer Goods Inspiration Pdf
This slide showcases the revenue of the company by geographical region and business segments which includes home care, grooming, home care and beauty products with different markets. If your project calls for a presentation, then Slidegeeks is your go to partner because we have professionally designed, easy to edit templates that are perfect for any presentation. After downloading, you can easily edit Company Revenue By Segment Multinational Organization Customer Goods Inspiration Pdf and make the changes accordingly. You can rearrange slides or fill them with different images. Check out all the handy templates This slide showcases the revenue of the company by geographical region and business segments which includes home care, grooming, home care and beauty products with different markets.
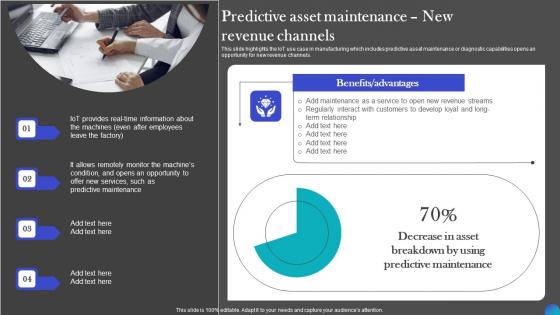
Predictive Asset Maintenance New Revenue IOT Adoption Manufacturing Themes PDF
This slide highlights the IoT use case in manufacturing which includes predictive asset maintenance or diagnostic capabilities opens an opportunity for new revenue channels. This Predictive Asset Maintenance New Revenue IOT Adoption Manufacturing Themes PDF from Slidegeeks makes it easy to present information on your topic with precision. It provides customization options, so you can make changes to the colors, design, graphics, or any other component to create a unique layout. It is also available for immediate download, so you can begin using it right away. Slidegeeks has done good research to ensure that you have everything you need to make your presentation stand out. Make a name out there for a brilliant performance. This slide highlights the IoT use case in manufacturing which includes predictive asset maintenance or diagnostic capabilities opens an opportunity for new revenue channels.
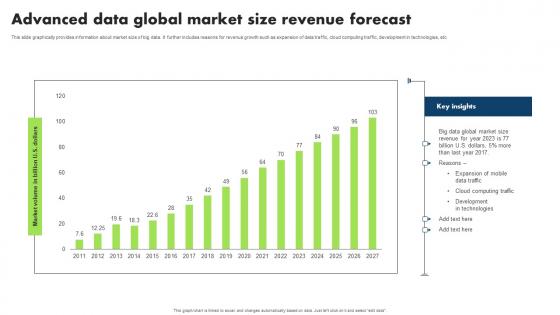
Advanced Data Global Market Size Revenue Forecast Microsoft Pdf
This slide graphically provides information about market size of big data. It further includes reasons for revenue growth such as expansion of data traffic, cloud computing traffic, development in technologies, etc Showcasing this set of slides titled Advanced Data Global Market Size Revenue Forecast Microsoft Pdf. The topics addressed in these templates are Expansion Mobile Data Traffic, Cloud Computing Traffic, Development Technologies. All the content presented in this PPT design is completely editable. Download it and make adjustments in color, background, font etc. as per your unique business setting. This slide graphically provides information about market size of big data. It further includes reasons for revenue growth such as expansion of data traffic, cloud computing traffic, development in technologies, etc
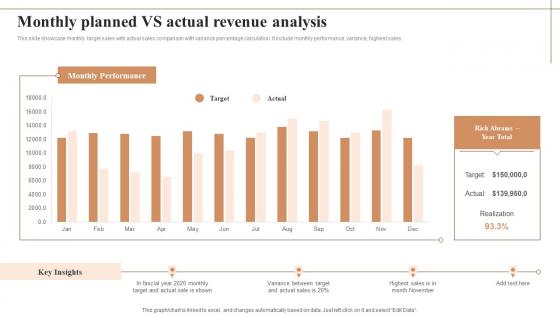
Monthly Planned Vs Actual Revenue Analysis Professional Pdf
This slide showcase monthly target sales with actual sales comparison with variance percentage calculation. It include monthly performance, variance, highest sales. Showcasing this set of slides titled Monthly Planned Vs Actual Revenue Analysis Professional Pdf The topics addressed in these templates are Monthly Planned, Actual Revenue Analysis All the content presented in this PPT design is completely editable. Download it and make adjustments in color, background, font etc. as per your unique business setting. This slide showcase monthly target sales with actual sales comparison with variance percentage calculation. It include monthly performance, variance, highest sales.
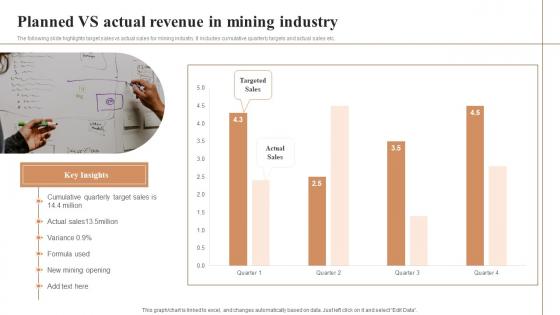
Planned Vs Actual Revenue In Mining Industry Slides Pdf
The following slide highlights target sales vs actual sales for mining industry. It includes cumulative quarterly targets and actual sales etc. Pitch your topic with ease and precision using this Planned Vs Actual Revenue In Mining Industry Slides Pdf This layout presents information on Targeted Sales, Actual Sales, Revenue In Mining Industry It is also available for immediate download and adjustment. So, changes can be made in the color, design, graphics or any other component to create a unique layout. The following slide highlights target sales vs actual sales for mining industry. It includes cumulative quarterly targets and actual sales etc.
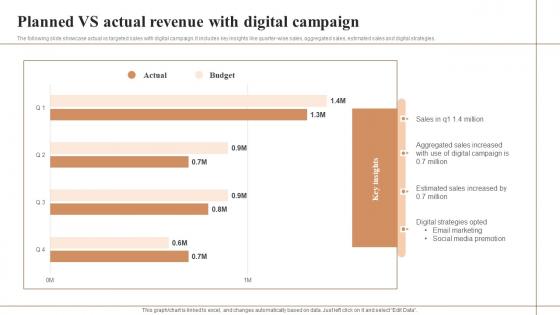
Planned Vs Actual Revenue With Digital Campaign Mockup Pdf
The following slide showcase actual vs targeted sales with digital campaign. It includes key insights like quarter-wise sales, aggregated sales, estimated sales and digital strategies. Pitch your topic with ease and precision using this Planned Vs Actual Revenue With Digital Campaign Mockup Pdf This layout presents information on Planned VS Actual, Revenue With Digital Campaign It is also available for immediate download and adjustment. So, changes can be made in the color, design, graphics or any other component to create a unique layout. The following slide showcase actual vs targeted sales with digital campaign. It includes key insights like quarter-wise sales, aggregated sales, estimated sales and digital strategies.
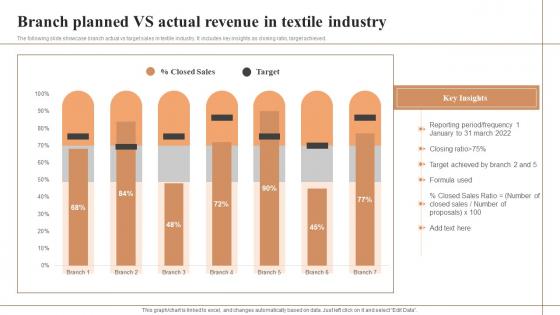
Branch Planned Vs Actual Revenue In Textile Industry Formats Pdf
The following slide showcase branch actual vs target sales in textile industry. It includes key insights as closing ratio, target achieved. Showcasing this set of slides titled Branch Planned Vs Actual Revenue In Textile Industry Formats Pdf The topics addressed in these templates are Branch Planned, Actual Revenue, Textile Industry All the content presented in this PPT design is completely editable. Download it and make adjustments in color, background, font etc. as per your unique business setting. The following slide showcase branch actual vs target sales in textile industry. It includes key insights as closing ratio, target achieved.
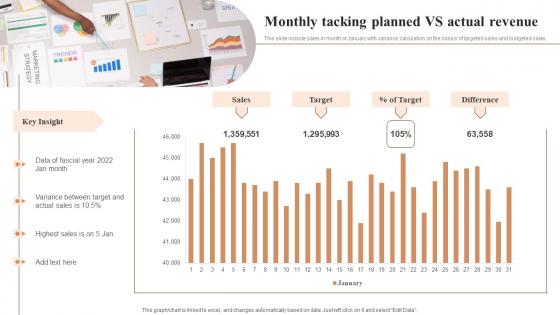
Monthly Tacking Planned Vs Actual Revenue Slides Pdf
This slide include sales in month of January with variance calculation on the basics of targeted sales and budgeted sales. Pitch your topic with ease and precision using this Monthly Tacking Planned Vs Actual Revenue Slides Pdf This layout presents information on Monthly Tacking Planned, Actual Revenue It is also available for immediate download and adjustment. So, changes can be made in the color, design, graphics or any other component to create a unique layout. This slide include sales in month of January with variance calculation on the basics of targeted sales and budgeted sales.
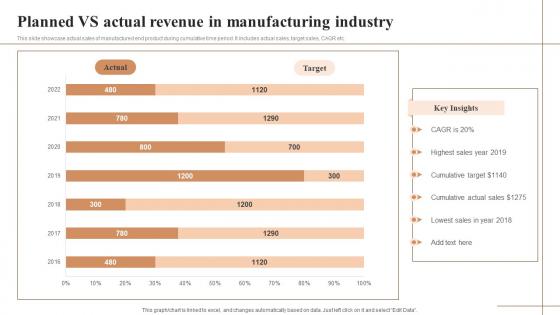
Planned Vs Actual Revenue In Manufacturing Industry Graphics Pdf
This slide showcase actual sales of manufactured end product during cumulative time period. It includes actual sales, target sales, CAGR etc. Showcasing this set of slides titled Planned Vs Actual Revenue In Manufacturing Industry Graphics Pdf The topics addressed in these templates are Planned VS Actual, Revenue In Manufacturing, Industry All the content presented in this PPT design is completely editable. Download it and make adjustments in color, background, font etc. as per your unique business setting. This slide showcase actual sales of manufactured end product during cumulative time period. It includes actual sales, target sales, CAGR etc.
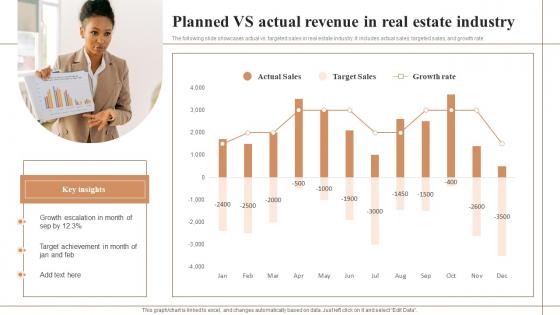
Planned Vs Actual Revenue In Real Estate Industry Inspiration Pdf
The following slide showcases actual vs. targeted sales in real estate industry. It includes actual sales, targeted sales, and growth rate. Showcasing this set of slides titled Planned Vs Actual Revenue In Real Estate Industry Inspiration Pdf The topics addressed in these templates are Planned VS Actual, Revenue, Real Estate Industry All the content presented in this PPT design is completely editable. Download it and make adjustments in color, background, font etc. as per your unique business setting. The following slide showcases actual vs. targeted sales in real estate industry. It includes actual sales, targeted sales, and growth rate.
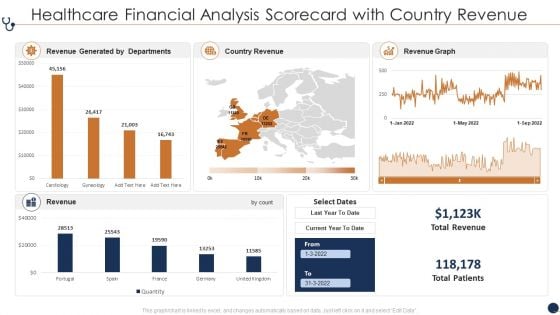
Healthcare Financial Analysis Scorecard With Country Revenue Ppt Layouts PDF
This graph or chart is linked to excel, and changes automatically based on data. Just left click on it and select Edit Data. Deliver an awe inspiring pitch with this creative Healthcare Financial Analysis Scorecard With Country Revenue Ppt Layouts PDF bundle. Topics like Revenue Generated Departments, Country Revenue Current can be discussed with this completely editable template. It is available for immediate download depending on the needs and requirements of the user.
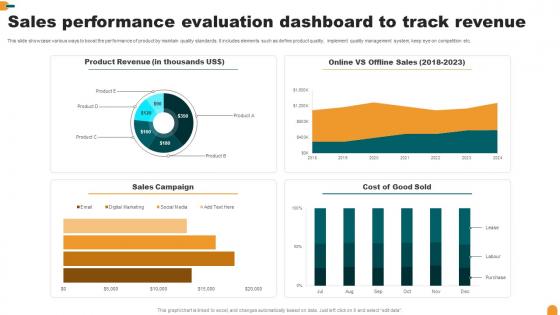
Sales Performance Evaluation Dashboard To Track Revenue Summary Pdf
This slide showcase various ways to boost the performance of product by maintain quality standards. It includes elements such as define product quality, implement quality management system, keep eye on competition etc.Pitch your topic with ease and precision using this Sales Performance Evaluation Dashboard To Track Revenue Summary Pdf This layout presents information on Sales Campaign, Product Revenue, Cost Good Sold It is also available for immediate download and adjustment. So, changes can be made in the color, design, graphics or any other component to create a unique layout. This slide showcase various ways to boost the performance of product by maintain quality standards. It includes elements such as define product quality, implement quality management system, keep eye on competition etc.
Investor Deck Procure Funds Bridging Loan Historical And Forecasted Revenue Of The Company Icons PDF
This slide shows the revenue graph of previous, current and forecasted year. Deliver an awe-inspiring pitch with this creative investor deck procure funds bridging loan historical and forecasted revenue of the company icons pdf bundle. Topics like historical and forecasted revenue of the company can be discussed with this completely editable template. It is available for immediate download depending on the needs and requirements of the user.
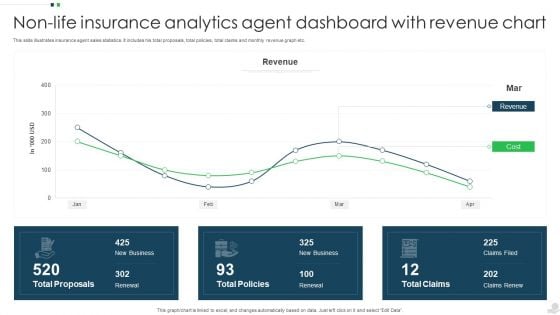
Non Life Insurance Analytics Agent Dashboard With Revenue Chart Infographics PDF
This slide illustrates insurance agent sales statistics. It includes his total proposals, total policies, total claims and monthly revenue graph etc. Showcasing this set of slides titled Non Life Insurance Analytics Agent Dashboard With Revenue Chart Infographics PDF. The topics addressed in these templates are Revenue, Cost, Total Proposals. All the content presented in this PPT design is completely editable. Download it and make adjustments in color, background, font etc. as per your unique business setting.
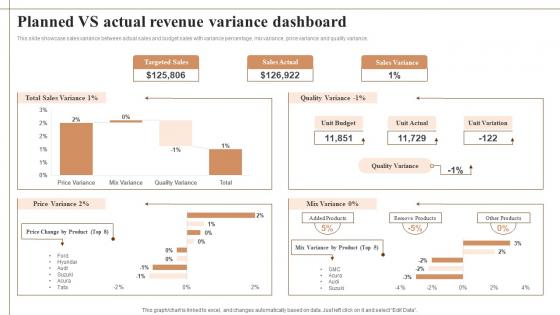
Planned Vs Actual Revenue Variance Dashboard Background Pdf
This slide showcase sales variance between actual sales and budget sales with variance percentage, mix variance, price variance and quality variance. Showcasing this set of slides titled Planned Vs Actual Revenue Variance Dashboard Background Pdf The topics addressed in these templates are Targeted Sales, Sales Actual, Sales Variance All the content presented in this PPT design is completely editable. Download it and make adjustments in color, background, font etc. as per your unique business setting. This slide showcase sales variance between actual sales and budget sales with variance percentage, mix variance, price variance and quality variance.
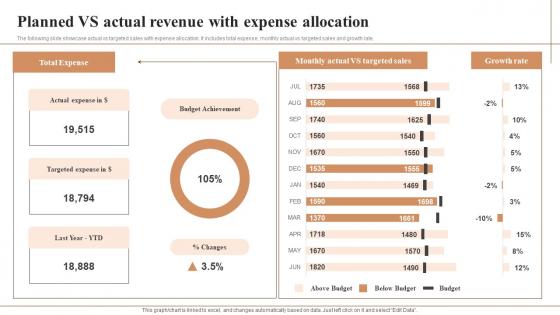
Planned Vs Actual Revenue With Expense Allocation Professional Pdf
The following slide showcase actual vs targeted sales with expense allocation. It includes total expense, monthly actual vs targeted sales and growth rate. Showcasing this set of slides titled Planned Vs Actual Revenue With Expense Allocation Professional Pdf The topics addressed in these templates are Targeted Sales, Growth Rate, Budget Achievement All the content presented in this PPT design is completely editable. Download it and make adjustments in color, background, font etc. as per your unique business setting. The following slide showcase actual vs targeted sales with expense allocation. It includes total expense, monthly actual vs targeted sales and growth rate.
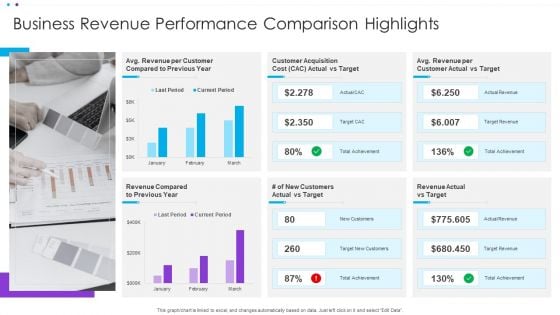
Business Revenue Performance Comparison Highlights Ppt Summary Rules PDF
This graph or chart is linked to excel, and changes automatically based on data. Just left click on it and select Edit Data. Showcasing this set of slides titled Business Revenue Performance Comparison Highlights Ppt Summary Rules PDF. The topics addressed in these templates are Customer Acquisition, Customer Actual, Revenue Compared. All the content presented in this PPT design is completely editable. Download it and make adjustments in color, background, font etc. as per your unique business setting.

Revenue Projections Analysis For Progress Report Information Pdf
This slide depicts progress report of sales analysis which helps manager to generate achievable sales goals and maximize utilization of resources. It include elements such as starting, monthly forecast and cumulative. Pitch your topic with ease and precision using this Revenue Projections Analysis For Progress Report Information Pdf This layout presents information on Cumulative, Forecast Analysis, Progress Report It is also available for immediate download and adjustment. So, changes can be made in the color, design, graphics or any other component to create a unique layout. This slide depicts progress report of sales analysis which helps manager to generate achievable sales goals and maximize utilization of resources. It include elements such as starting, monthly forecast and cumulative.
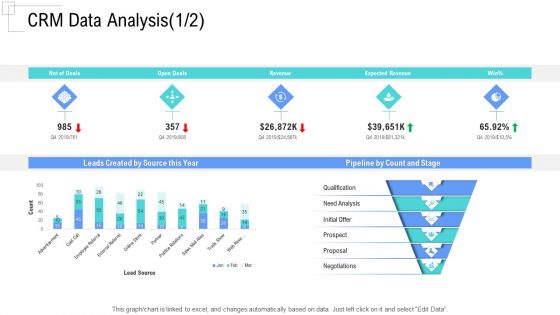
Managing Customer Experience CRM Data Analysis Revenue Designs PDF
This graph or chart is linked to excel, and changes automatically based on data. Just left click on it and select Edit Data.Deliver an awe-inspiring pitch with this creative managing customer experience crm data analysis revenue designs pdf bundle. Topics like leads created by source this year, pipeline by count and stage, qualification, need analysis, initial offer can be discussed with this completely editable template. It is available for immediate download depending on the needs and requirements of the user.
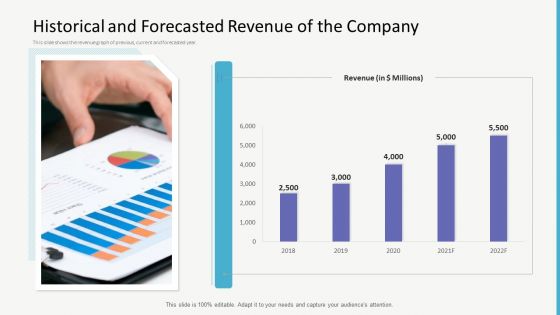
Investor Gap Financing Historical And Forecasted Revenue Of The Company Slides PDF
This slide shows the revenue graph of previous, current and forecasted year. Deliver and pitch your topic in the best possible manner with this investor gap financing historical and forecasted revenue of the company slides pdf. Use them to share invaluable insights on historical and forecasted revenue of the company and impress your audience. This template can be altered and modified as per your expectations. So, grab it now.
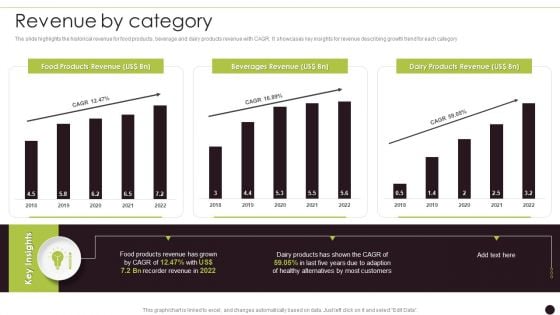
Canned Food Company Profile Revenue By Category Template PDF
The slide highlights the historical revenue for food products, beverage and dairy products revenue with CAGR. It showcases key insights for revenue describing growth trend for each categoryDeliver and pitch your topic in the best possible manner with this Canned Food Company Profile Revenue By Category Template PDF Use them to share invaluable insights on Food Products, Beverages Revenue, Products Revenue and impress your audience. This template can be altered and modified as per your expectations. So, grab it now.
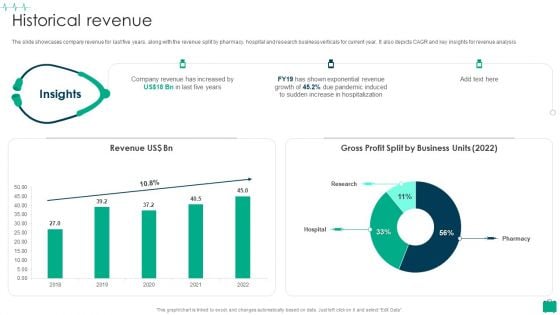
Healthcare Services Company Profile Historical Revenue Brochure PDF
The slide showcases company revenue for last five years, along with the revenue split by pharmacy, hospital and research business verticals for current year. It also depicts CAGR and key insights for revenue analysis.Deliver an awe inspiring pitch with this creative Healthcare Services Company Profile Historical Revenue Brochure PDF bundle. Topics like Revenue Increased, Exponential Revenue, Increase Hospitalization can be discussed with this completely editable template. It is available for immediate download depending on the needs and requirements of the user.
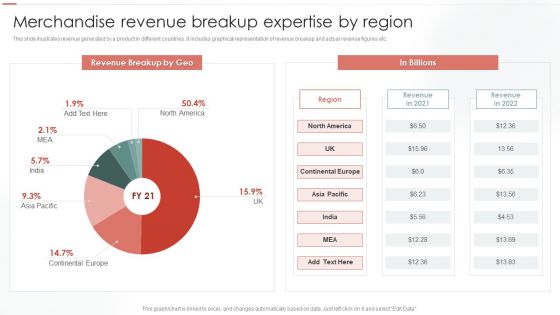
Merchandise Revenue Breakup Expertise By Region Ppt Slides Download PDF
This slide illustrates revenue generated by a product in different countries. It includes graphical representation of revenue breakup and actual revenue figures etc. Deliver and pitch your topic in the best possible manner with this Merchandise Revenue Breakup Expertise By Region Ppt Slides Download PDF. Use them to share invaluable insights on Revenue Breakup, Revenue 2021, Continental Europe and impress your audience. This template can be altered and modified as per your expectations. So, grab it now.
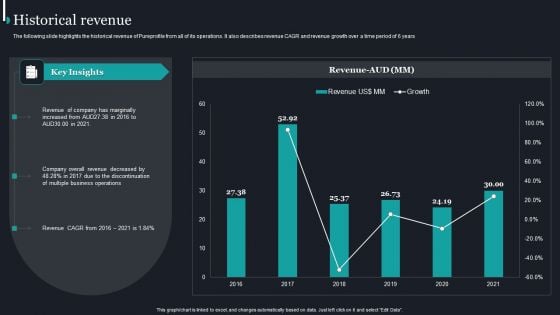
Pureprofile Business Overview Historical Revenue Ppt Summary Background Images PDF
The following slide highlights the historical revenue of Pureprofile from all of its operations. It also describes revenue CAGR and revenue growth over a time period of 6 years. Deliver an awe inspiring pitch with this creative Pureprofile Business Overview Historical Revenue Ppt Summary Background Images PDF bundle. Topics like Revenue Company, Company Overall, Revenue Decreased, Business Operations can be discussed with this completely editable template. It is available for immediate download depending on the needs and requirements of the user.

 Home
Home