Revenue Graph
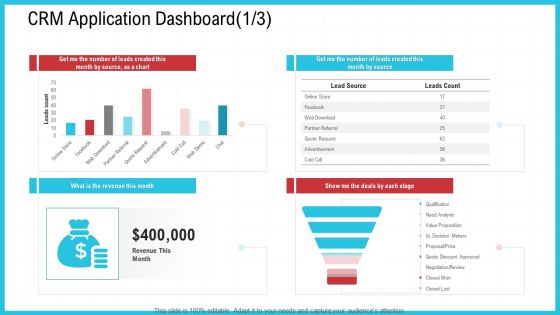
CRM Application Dashboard Revenue Ppt Infographics Example File PDF
Deliver and pitch your topic in the best possible manner with this crm application dashboard revenue ppt infographics example file pdf. Use them to share invaluable insights on source, analysis, price and impress your audience. This template can be altered and modified as per your expectations. So, grab it now.
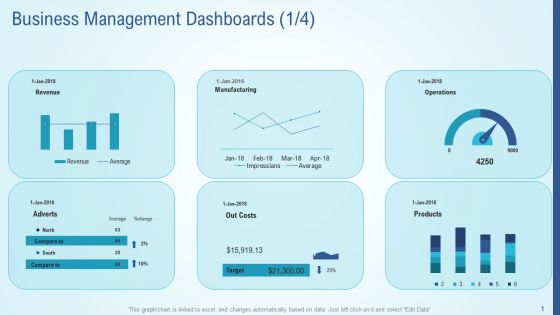
Business Strategy Development Process Business Management Dashboards Revenue Download PDF
Deliver an awe inspiring pitch with this creative business strategy development process business management dashboards revenue download pdf bundle. Topics like business management dashboards can be discussed with this completely editable template. It is available for immediate download depending on the needs and requirements of the user.
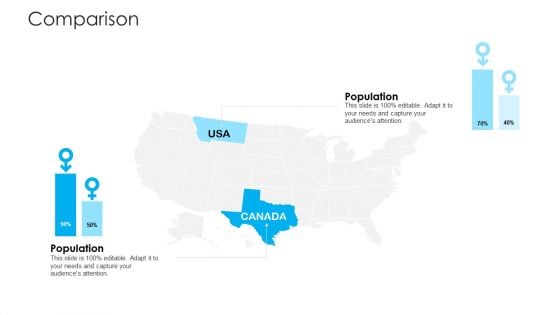
How To Build A Revenue Funnel Comparison Rules PDF
Deliver an awe inspiring pitch with this creative how to build a revenue funnel comparison rules pdf bundle. Topics like comparison can be discussed with this completely editable template. It is available for immediate download depending on the needs and requirements of the user.

Budget Variance Analysis Revenue Ppt Outline Vector PDF
Deliver an awe-inspiring pitch with this creative budget variance analysis revenue ppt outline vector pdf. bundle. Topics like 2021 proposed budget comparison, proposed budget, projected can be discussed with this completely editable template. It is available for immediate download depending on the needs and requirements of the user.
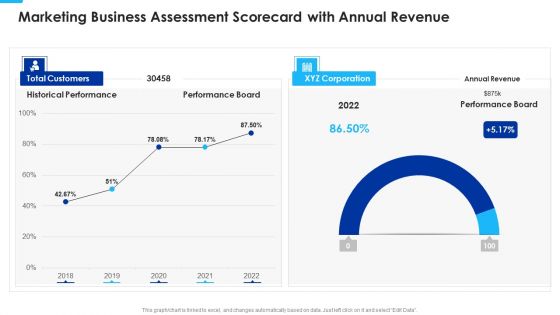
Marketing Business Assessment Scorecard With Annual Revenue Professional PDF
Deliver an awe inspiring pitch with this creative Marketing Business Assessment Scorecard With Annual Revenue Professional PDF bundle. Topics like Historical Performance, Total Customers, Performance Board can be discussed with this completely editable template. It is available for immediate download depending on the needs and requirements of the user.
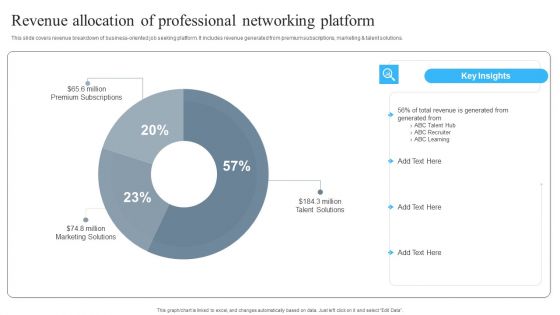
Revenue Allocation Of Professional Networking Platform Formats PDF
Showcasing this set of slides titled Revenue Allocation Of Professional Networking Platform Formats PDF. The topics addressed in these templates are Professional, Networking Platform. All the content presented in this PPT design is completely editable. Download it and make adjustments in color, background, font etc. as per your unique business setting.
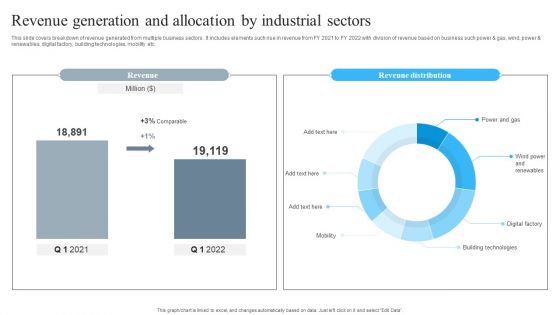
Revenue Generation And Allocation By Industrial Sectors Themes PDF
Pitch your topic with ease and precision using this Revenue Generation And Allocation By Industrial Sectors Themes PDF. This layout presents information on Allocation, Industrial Sectors. It is also available for immediate download and adjustment. So, changes can be made in the color, design, graphics or any other component to create a unique layout.

Monthly Financial Metrics Dashboard With Revenue And Expenditure Rules PDF
This slide showcases KPI dashboard for monitoring financial health of business to ensure smooth flow of business operations. It includes details such as COGS, net profit, cost breakdown, etc. Showcasing this set of slides titled Monthly Financial Metrics Dashboard With Revenue And Expenditure Rules PDF. The topics addressed in these templates are Net Profit, Costs, Expenditure. All the content presented in this PPT design is completely editable. Download it and make adjustments in color, background, font etc. as per your unique business setting.
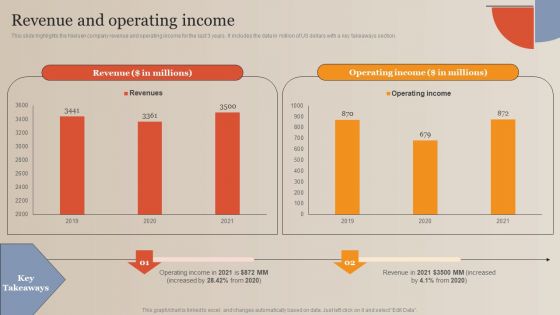
Market Study Company Outline Revenue And Operating Income Themes PDF
This slide highlights the Nielsen company revenue and operating income for the last 3 years. It includes the data in million of US dollars with a key takeaways section. Slidegeeks is here to make your presentations a breeze with Market Study Company Outline Revenue And Operating Income Themes PDF With our easy to use and customizable templates, you can focus on delivering your ideas rather than worrying about formatting. With a variety of designs to choose from, you are sure to find one that suits your needs. And with animations and unique photos, illustrations, and fonts, you can make your presentation pop. So whether you are giving a sales pitch or presenting to the board, make sure to check out Slidegeeks first.

Information Analytics Company Outline Revenue By Customer Fy2023 Topics PDF
This slide highlights the revenue by customer which includes financial service, direct to consumer, health, retail, automotive, insurance, government, and public sector, media and technology. Slidegeeks is here to make your presentations a breeze with Information Analytics Company Outline Revenue By Customer Fy2023 Topics PDF With our easy to use and customizable templates, you can focus on delivering your ideas rather than worrying about formatting. With a variety of designs to choose from, you are sure to find one that suits your needs. And with animations and unique photos, illustrations, and fonts, you can make your presentation pop. So whether you are giving a sales pitch or presenting to the board, make sure to check out Slidegeeks first.
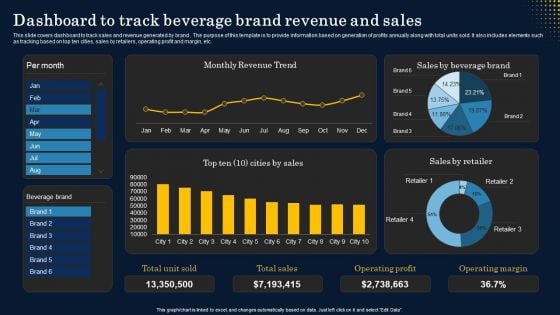
Dashboard To Track Beverage Brand Revenue And Sales Structure PDF
This slide covers dashboard to track sales and revenue generated by brand . The purpose of this template is to provide information based on generation of profits annually along with total units sold. It also includes elements such as tracking based on top ten cities, sales by retailers, operating profit and margin, etc. Are you in need of a template that can accommodate all of your creative concepts This one is crafted professionally and can be altered to fit any style. Use it with Google Slides or PowerPoint. Include striking photographs, symbols, depictions, and other visuals. Fill, move around, or remove text boxes as desired. Test out color palettes and font mixtures. Edit and save your work, or work with colleagues. Download Dashboard To Track Beverage Brand Revenue And Sales Structure PDF and observe how to make your presentation outstanding. Give an impeccable presentation to your group and make your presentation unforgettable.
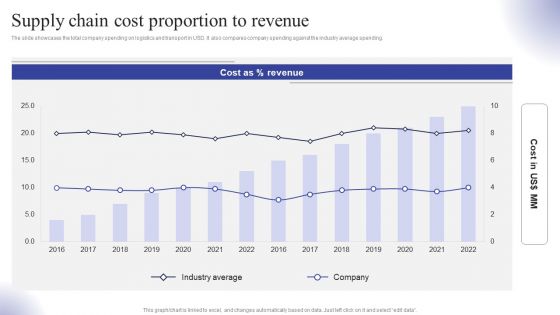
Supply Chain Cost Proportion To Revenue Ppt Pictures Outline PDF
The slide showcases the total company spending on logistics and transport in USD. It also compares company spending against the industry average spending. Find highly impressive Supply Chain Cost Proportion To Revenue Ppt Pictures Outline PDF on Slidegeeks to deliver a meaningful presentation. You can save an ample amount of time using these presentation templates. No need to worry to prepare everything from scratch because Slidegeeks experts have already done a huge research and work for you. You need to download Supply Chain Cost Proportion To Revenue Ppt Pictures Outline PDF for your upcoming presentation. All the presentation templates are 100 percent editable and you can change the color and personalize the content accordingly. Download now
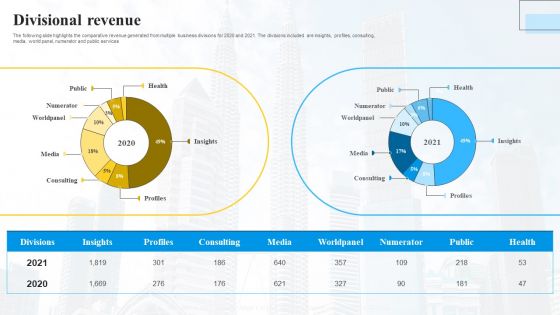
Marketing Insights Company Profile Divisional Revenue Demonstration PDF
The following slide highlights the comparative revenue generated from multiple business divisions for 2020 and 2021. The divisions included are insights, profiles, consulting, media, world panel, numerator and public services Retrieve professionally designed Marketing Insights Company Profile Divisional Revenue Demonstration PDF to effectively convey your message and captivate your listeners. Save time by selecting pre made slideshows that are appropriate for various topics, from business to educational purposes. These themes come in many different styles, from creative to corporate, and all of them are easily adjustable and can be edited quickly. Access them as PowerPoint templates or as Google Slides themes. You do not have to go on a hunt for the perfect presentation because Slidegeeks got you covered from everywhere.
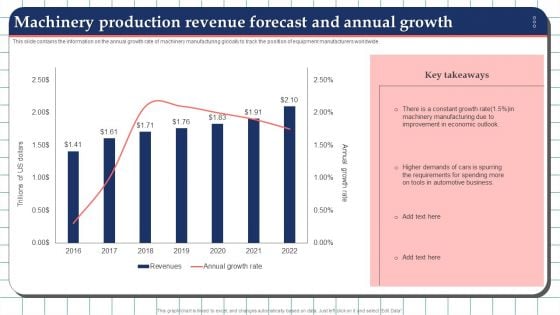
Machinery Production Revenue Forecast And Annual Growth Template PDF
This slide contains the information on the annual growth rate of machinery manufacturing globally to track the position of equipment manufacturers worldwide. Showcasing this set of slides titled Machinery Production Revenue Forecast And Annual Growth Template PDF. The topics addressed in these templates are Manufacturing, Economic, Growth Rate. All the content presented in this PPT design is completely editable. Download it and make adjustments in color, background, font etc. as per your unique business setting.
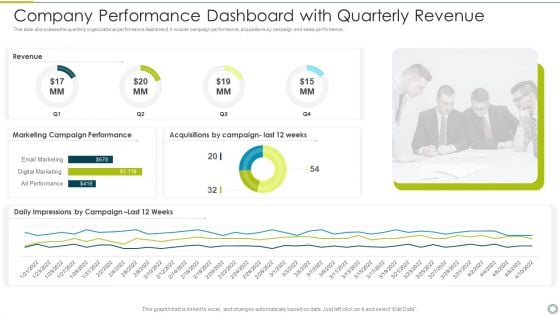
Company Performance Dashboard With Quarterly Revenue Download PDF
This slide showcases the quarterly organizational performance dashboard. It include campaign performance, acquisitions by campaign and sales performance. Showcasing this set of slides titled company performance dashboard with quarterly revenue download pdf. The topics addressed in these templates are marketing, performance. All the content presented in this PPT design is completely editable. Download it and make adjustments in color, background, font etc. as per your unique business setting.
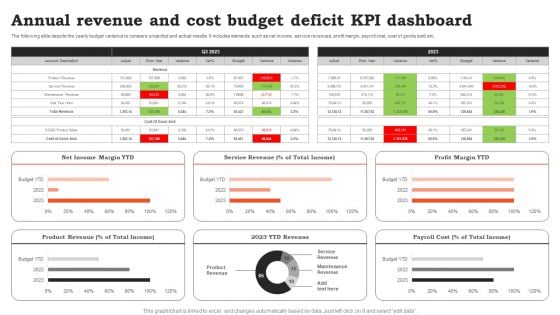
Annual Revenue And Cost Budget Deficit KPI Dashboard Ideas PDF
The following slide depicts the yearly budget variance to compare projected and actual results. It includes elements such as net income, service revenues, profit margin, payroll cost, cost of goods sold etc. Showcasing this set of slides titled Annual Revenue And Cost Budget Deficit KPI Dashboard Ideas PDF. The topics addressed in these templates are Cost Budget, Deficit KPI Dashboard. All the content presented in this PPT design is completely editable. Download it and make adjustments in color, background, font etc. as per your unique business setting.
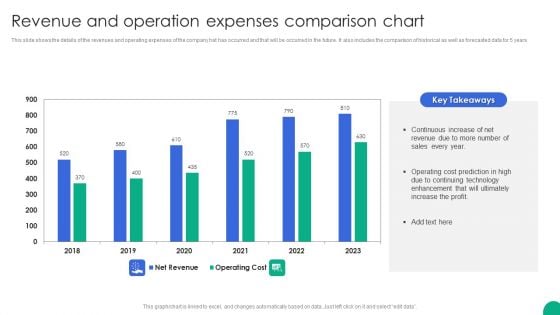
Revenue And Operation Expenses Comparison Chart Slides PDF
This slide shows the details of the revenues and operating expenses of the company hat has occurred and that will be occurred in the future. It also includes the comparison of historical as well as forecasted data for 5 years.Showcasing this set of slides titled Revenue And Operation Expenses Comparison Chart Slides PDF. The topics addressed in these templates are Continuous Increase, Operating Cost, Enhancement Ultimately. All the content presented in this PPT design is completely editable. Download it and make adjustments in color, background, font etc. as per your unique business setting.
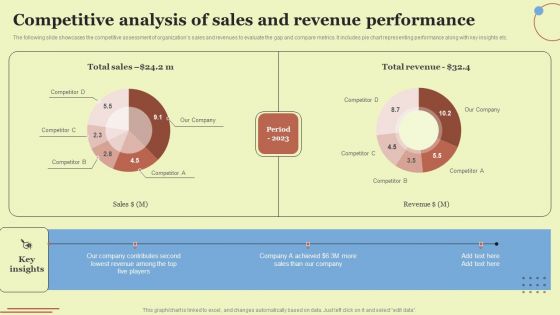
Competitive Analysis Of Sales And Revenue Performance Elements PDF
The following slide showcases the competitive assessment of organizations sales and revenues to evaluate the gap and compare metrics. It includes pie chart representing performance along with key insights etc. Take your projects to the next level with our ultimate collection of Competitive Analysis Of Sales And Revenue Performance Elements PDF. Slidegeeks has designed a range of layouts that are perfect for representing task or activity duration, keeping track of all your deadlines at a glance. Tailor these designs to your exact needs and give them a truly corporate look with your own brand colors they will make your projects stand out from the rest.
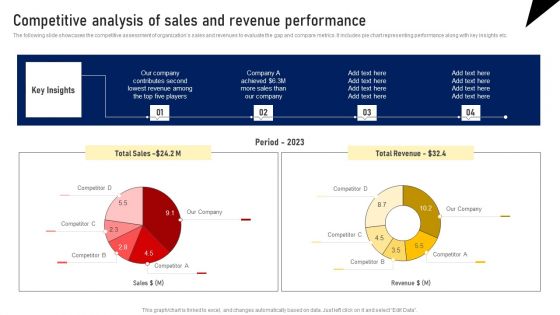
Competitive Analysis Of Sales And Revenue Performance Designs PDF
The following slide showcases the competitive assessment of organizations sales and revenues to evaluate the gap and compare metrics. It includes pie chart representing performance along with key insights etc. Take your projects to the next level with our ultimate collection of Competitive Analysis Of Sales And Revenue Performance Designs PDF. Slidegeeks has designed a range of layouts that are perfect for representing task or activity duration, keeping track of all your deadlines at a glance. Tailor these designs to your exact needs and give them a truly corporate look with your own brand colors they will make your projects stand out from the rest.
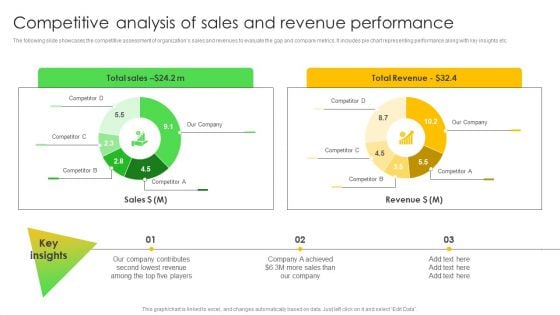
Competitive Analysis Of Sales And Revenue Performance Information PDF
The following slide showcases the competitive assessment of organizations sales and revenues to evaluate the gap and compare metrics. It includes pie chart representing performance along with key insights etc. Slidegeeks is one of the best resources for PowerPoint templates. You can download easily and regulate Competitive Analysis Of Sales And Revenue Performance Information PDF for your personal presentations from our wonderful collection. A few clicks is all it takes to discover and get the most relevant and appropriate templates. Use our Templates to add a unique zing and appeal to your presentation and meetings. All the slides are easy to edit and you can use them even for advertisement purposes.

Monthly Financials Metrics With Revenue And Gross Profit Professional PDF
This slide displays P and L variance analysis to closely monitor key financial parameters of the company. It includes details about sales, discounts allowed, freight income, customer finance charges, etc. Showcasing this set of slides titled Monthly Financials Metrics With Revenue And Gross Profit Professional PDF. The topics addressed in these templates are Amount, Current Month, Profit. All the content presented in this PPT design is completely editable. Download it and make adjustments in color, background, font etc. as per your unique business setting.
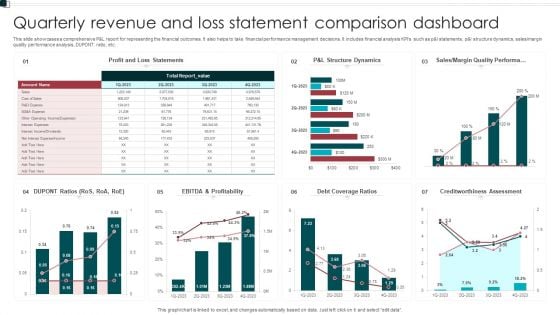
Quarterly Revenue And Loss Statement Comparison Dashboard Portrait PDF
This slide showcases a comprehensive P and L report for representing the financial outcomes. It also helps to take financial performance management decisions. It includes financial analysis KPIs such as p and l statements, p and l structure dynamics, sales or margin quality performance analysis, DUPONT ratio, etc. Showcasing this set of slides titled Quarterly Revenue And Loss Statement Comparison Dashboard Portrait PDF. The topics addressed in these templates are Profitability, Debt Coverage Ratios, Margin Quality Performa. All the content presented in this PPT design is completely editable. Download it and make adjustments in color, background, font etc. as per your unique business setting.
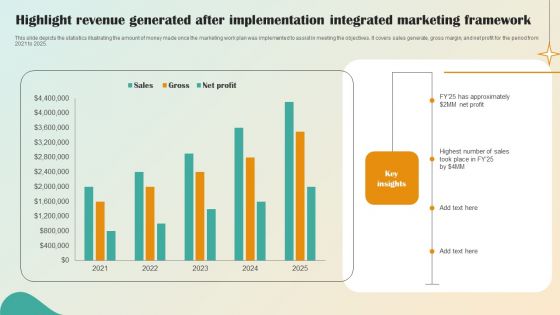
Highlight Revenue Generated After Implementation Integrated Marketing Framework Professional PDF
This slide depicts the statistics illustrating the amount of money made once the marketing work plan was implemented to assist in meeting the objectives. It covers sales generate, gross margin, and net profit for the period from 2021 to 2025.Showcasing this set of slides titled Highlight Revenue Generated After Implementation Integrated Marketing Framework Professional PDF. The topics addressed in these templates are Highest Number, Sales Took. All the content presented in this PPT design is completely editable. Download it and make adjustments in color, background, font etc. as per your unique business setting.
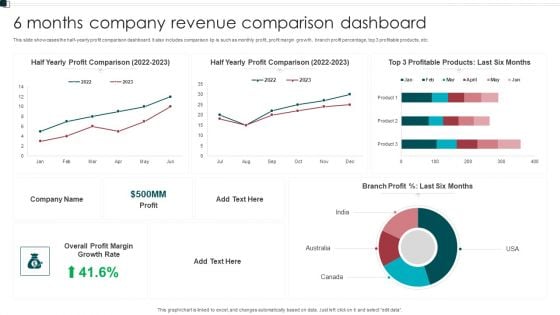
6 Months Company Revenue Comparison Dashboard Graphics PDF
This slide showcases the half yearly profit comparison dashboard. It also includes comparison kp is such as monthly profit, profit margin growth, branch profit percentage, top 3 profitable products, etc. Showcasing this set of slides titled 6 Months Company Revenue Comparison Dashboard Graphics PDF. The topics addressed in these templates are Growth Rate, Overall Profit Margin, Branch Profit. All the content presented in this PPT design is completely editable. Download it and make adjustments in color, background, font etc. as per your unique business setting.
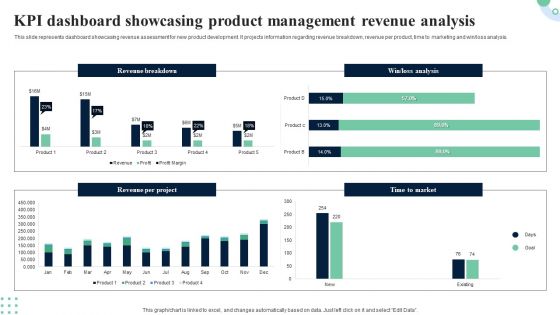
KPI Dashboard Showcasing Product Management Revenue Analysis Portrait PDF
This slide provides dashboard showcasing product development project overview with completion status. It provides information regarding cash flow statements, completion progress, project overview and product approval status. Pitch your topic with ease and precision using this KPI Dashboard Showcasing Product Management Revenue Analysis Portrait PDF. This layout presents information on Completion Progress, Product Approval Status, Cash Flow Statements. It is also available for immediate download and adjustment. So, changes can be made in the color, design, graphics or any other component to create a unique layout.
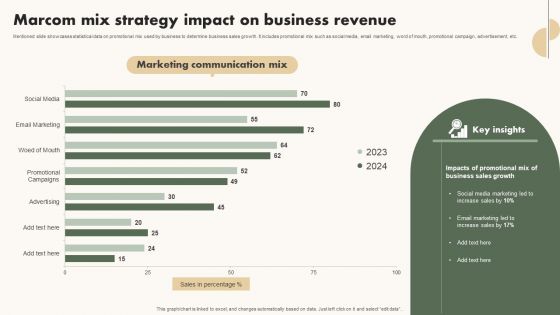
Marcom Mix Strategy Impact On Business Revenue Themes PDF
Mentioned slide showcases statistical data on promotional mix used by business to determine business sales growth. It includes promotional mix such as social media, email marketing, word of mouth, promotional campaign, advertisement, etc. Showcasing this set of slides titled Marcom Mix Strategy Impact On Business Revenue Themes PDF. The topics addressed in these templates are Social Media Marketing Led, Increase Sales, Email Marketing Led. All the content presented in this PPT design is completely editable. Download it and make adjustments in color, background, font etc. as per your unique business setting.
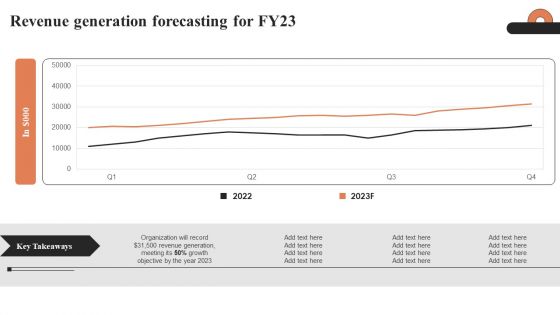
Revenue Generation Forecasting For Fy23 Ppt Portfolio Gallery PDF
Coming up with a presentation necessitates that the majority of the effort goes into the content and the message you intend to convey. The visuals of a PowerPoint presentation can only be effective if it supplements and supports the story that is being told. Keeping this in mind our experts created Revenue Generation Forecasting For Fy23 Ppt Portfolio Gallery PDF to reduce the time that goes into designing the presentation. This way, you can concentrate on the message while our designers take care of providing you with the right template for the situation.
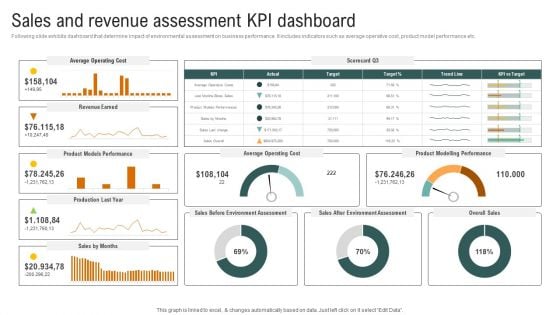
Sales And Revenue Assessment Kpi Dashboard Brochure PDF
Following slide exhibits dashboard that determine impact of environmental assessment on business performance. It includes indicators such as average operative cost, product model performance etc. If your project calls for a presentation, then Slidegeeks is your go-to partner because we have professionally designed, easy-to-edit templates that are perfect for any presentation. After downloading, you can easily edit Sales And Revenue Assessment Kpi Dashboard Brochure PDF and make the changes accordingly. You can rearrange slides or fill them with different images. Check out all the handy templates
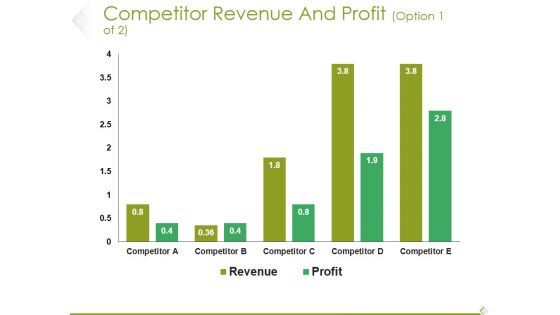
Competitor Revenue And Profit Template 2 Ppt PowerPoint Presentation Infographic Template Format Ideas
This is a competitor revenue and profit template 2 ppt powerpoint presentation infographic template format ideas. This is a five stage process. The stages in this process are competitor, revenue, profit, graph, growth.
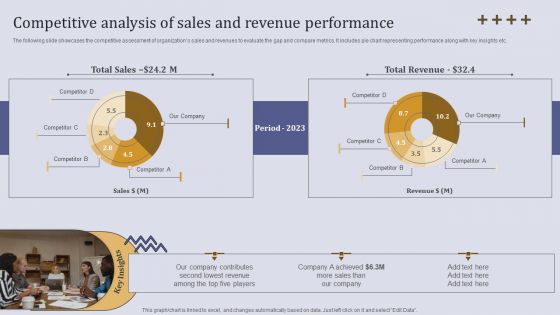
Competitive Analysis Of Sales And Revenue Performance Ppt Introduction PDF
The following slide showcases the competitive assessment of organizations sales and revenues to evaluate the gap and compare metrics. It includes pie chart representing performance along with key insights etc. This modern and well arranged Competitive Analysis Of Sales And Revenue Performance Ppt Introduction PDF provides lots of creative possibilities. It is very simple to customize and edit with the Powerpoint Software. Just drag and drop your pictures into the shapes. All facets of this template can be edited with Powerpoint no extra software is necessary. Add your own material, put your images in the places assigned for them, adjust the colors, and then you can show your slides to the world, with an animated slide included.
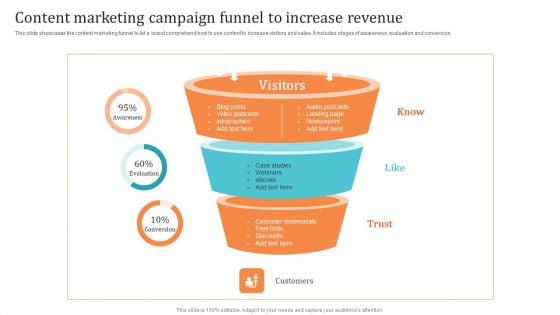
Content Marketing Campaign Funnel To Increase Revenue Themes PDF
This slide showcases the content marketing funnel to let a brand comprehend how to use content to increase visitors and sales. It includes stages of awareness, evaluation and conversion. Present like a pro with Content Marketing Campaign Funnel To Increase Revenue Themes PDF Create beautiful presentations together with your team, using our easy to use presentation slides. Share your ideas in real time and make changes on the fly by downloading our templates. So whether you are in the office, on the go, or in a remote location, you can stay in sync with your team and present your ideas with confidence. With Slidegeeks presentation got a whole lot easier. Grab these presentations today.
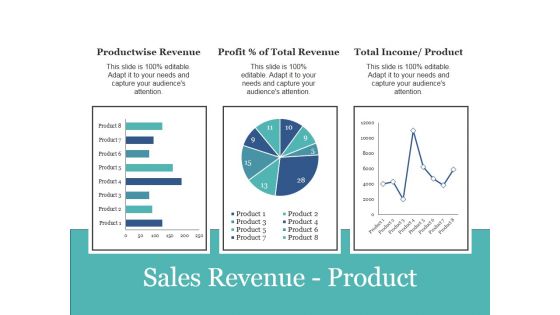
Sales Revenue Product Ppt PowerPoint Presentation Infographic Template Backgrounds
This is a sales revenue product ppt powerpoint presentation infographic template backgrounds. This is a three stage process. The stages in this process are product wise revenue, profit percent of total revenue, total income product.
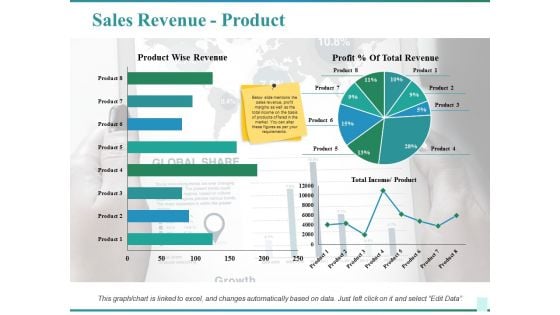
Sales Revenue Product Ppt PowerPoint Presentation Outline Portfolio
This is a sales revenue product ppt powerpoint presentation outline portfolio. This is a three stage process. The stages in this process are total income product, total revenue, product wise revenue, sales, business.
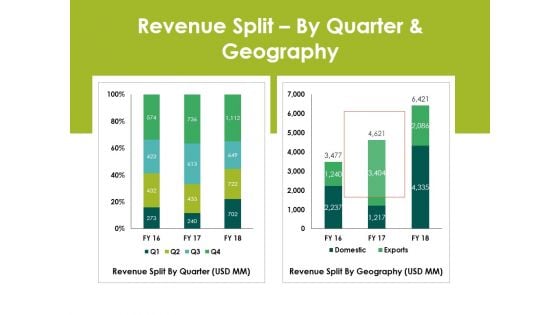
Revenue Splitby Quarter And Geography Ppt PowerPoint Presentation Layout
This is a revenue splitby quarter and geography ppt powerpoint presentation layout. This is a two stage process. The stages in this process are revenue split by quarter, revenue split by geography.
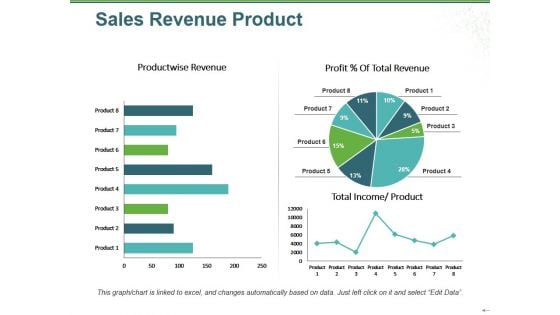
Sales Revenue Product Ppt PowerPoint Presentation Infographic Template Infographic Template
This is a sales revenue product ppt powerpoint presentation infographic template infographic template. This is a three stage process. The stages in this process are product wise revenue, total income, product, profit total revenue, pie.
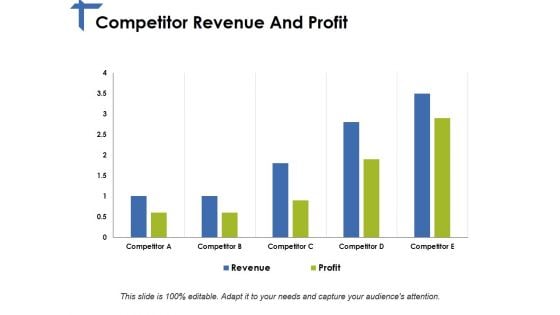
Competitor Revenue And Profit Ppt PowerPoint Presentation Pictures Good
This is a competitor revenue and profit ppt powerpoint presentation pictures good. This is a five stage process. The stages in this process are competitor, revenue, profit.
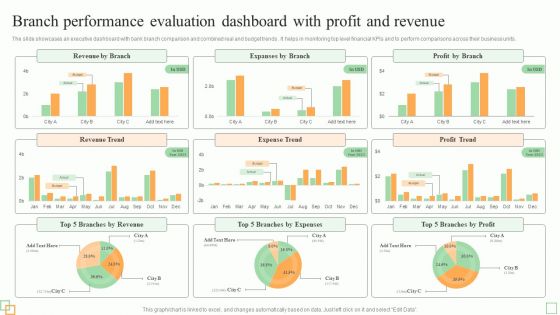
Branch Performance Evaluation Dashboard With Profit And Revenue Diagrams PDF
The slides showcases tips for enhancing branchs workforce performance and efficiency. It covers utilize transaction analysis data, schedule idle time, incent staff for efficiency, get bottom support and use part-time staff.Persuade your audience using this Best Practices To Improve Branch Workforce Performance Evaluation And Efficiency Introduction PDF. This PPT design covers five stages, thus making it a great tool to use. It also caters to a variety of topics including Market Opportunities, Customer Branch, Unnecessary Labor. Download this PPT design now to present a convincing pitch that not only emphasizes the topic but also showcases your presentation skills.
Competitor Revenue And Profit Ppt PowerPoint Presentation Icon Slide Download
This is a competitor revenue and profit ppt powerpoint presentation icon slide download. This is a five stage process. The stages in this process are revenue, profit, finance, marketing, strategy, analysis, business.
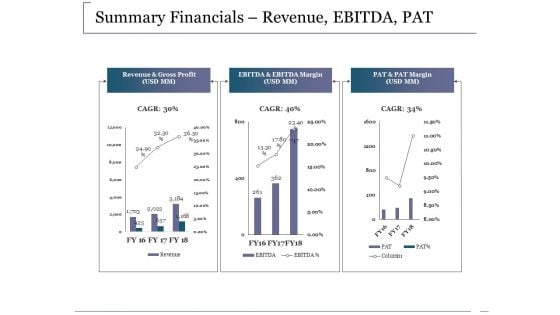
Summary Financials Revenue Ebitda Pat Ppt PowerPoint Presentation Outline Infographics
This is a summary financials revenue ebitda pat ppt powerpoint presentation outline infographics. This is a three stage process. The stages in this process are revenue and gross profit, ebitda and ebitda margin, pat and pat margin, business, marketing.
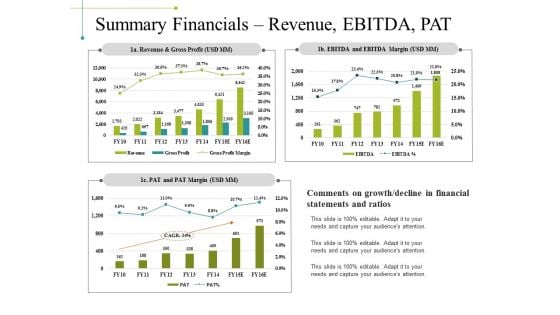
Summary Financials Revenue Ebitda Pat Ppt PowerPoint Presentation Inspiration Templates
This is a summary financials revenue ebitda pat ppt powerpoint presentation inspiration templates. This is a three stage process. The stages in this process are revenue and gross profit, pat and pat margin, ebitda and ebitda margin, business, marketing.
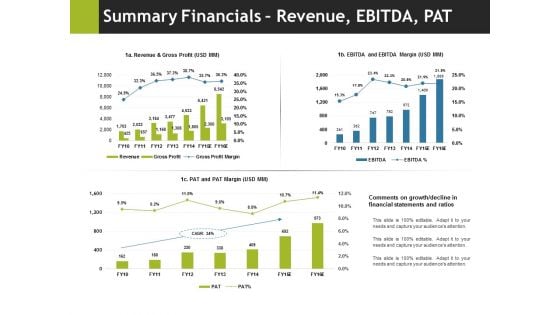
Summary Financials Revenue Ebitda Pat Ppt PowerPoint Presentation Pictures Outline
This is a summary financials revenue ebitda pat ppt powerpoint presentation pictures outline. This is a three stage process. The stages in this process are business, marketing, pat and pat margin, ebitda and ebitda margin, revenue and gross profit.
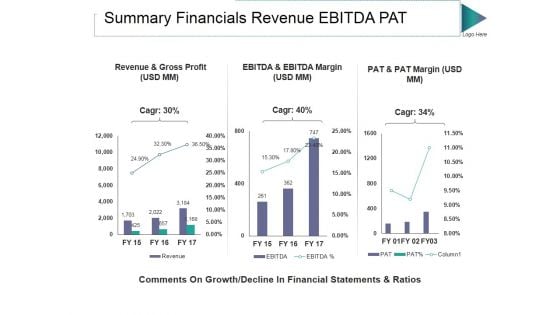
Summary Financials Revenue Ebitda Pat Ppt PowerPoint Presentation Visuals
This is a summary financials revenue ebitda pat ppt powerpoint presentation visuals. This is a three stage process. The stages in this process are revenue and gross profit, pat and pat margin, ebitda and ebitda margin.
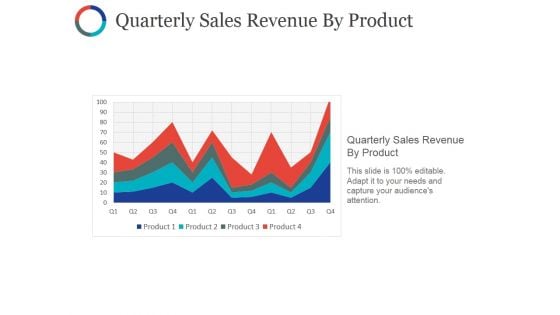
Quarterly Sales Revenue By Product Ppt PowerPoint Presentation Styles Slides
This is a quarterly sales revenue by product ppt powerpoint presentation styles slides. This is a four stage process. The stages in this process are quarterly sales revenue by product, charts, sales, business, success.
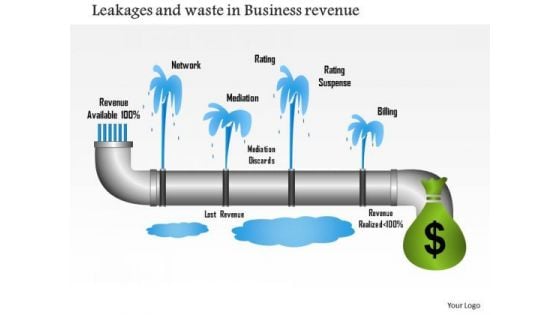
Business Framework Leakages And Waste In Business Revenue PowerPoint Presentation
Above diagram displays framework for leakages and waste in business revenue. This slide contains the graphic of pipeline with leakage points. Display the revenue generation from leakage and wastage in any presentations by using this business diagram.
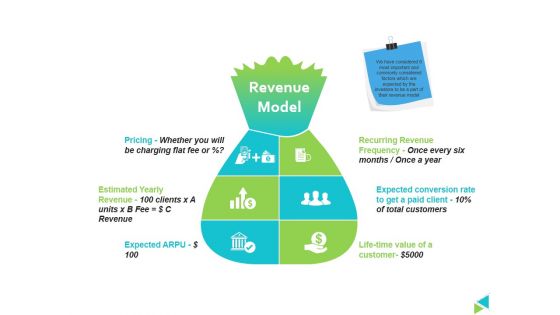
Revenue Model Ppt PowerPoint Presentation File Designs Download
This is a revenue model ppt powerpoint presentation file designs download. This is a six stage process. The stages in this process are pricing, estimated yearly revenue, life time value of a customer, recurring revenue frequency once every six months once a year.
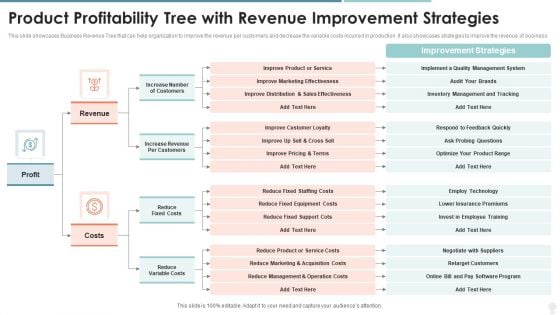
Product Profitability Tree With Revenue Improvement Strategies Microsoft PDF
This slide showcases Business Revenue Tree that can help organization to improve the revenue per customers and decrease the variable costs incurred in production. It also showcases strategies to improve the revenue of business. Persuade your audience using this product profitability tree with revenue improvement strategies microsoft pdf. This PPT design covers two stages, thus making it a great tool to use. It also caters to a variety of topics including product profitability tree with revenue improvement strategies. Download this PPT design now to present a convincing pitch that not only emphasizes the topic but also showcases your presentation skills.
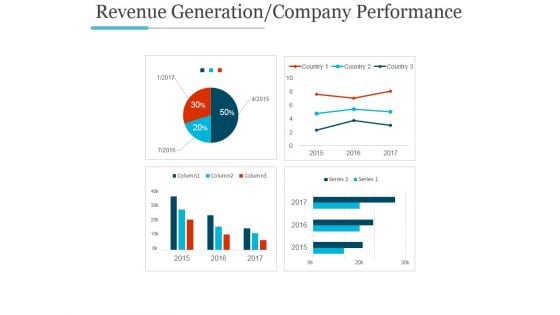
Revenue Generation Company Performance Ppt PowerPoint Presentation Inspiration
This is a revenue generation company performance ppt powerpoint presentation inspiration. This is a four stage process. The stages in this process are graph, growth, success, business, marketing.
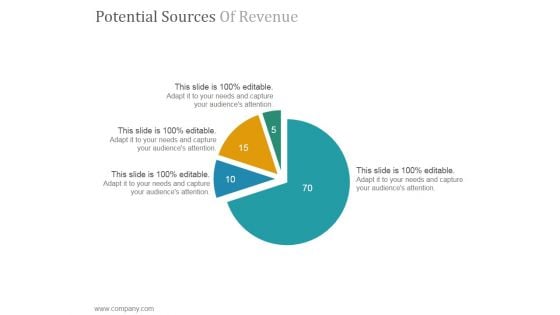
Potential Sources Of Revenue Ppt PowerPoint Presentation Sample
This is a potential sources of revenue ppt powerpoint presentation sample. This is a four stage process. The stages in this process are pie, division, business, market, operation.
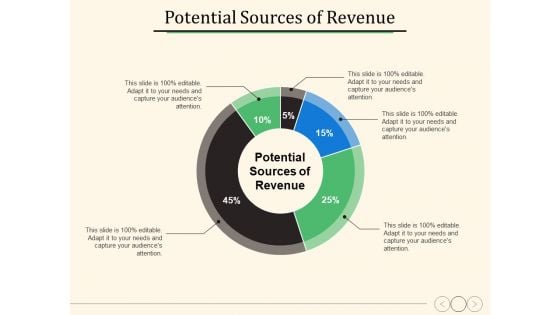
Potential Sources Of Revenue Ppt PowerPoint Presentation Show Information
This is a potential sources of revenue ppt powerpoint presentation show information. This is a five stage process. The stages in this process are percentage, product, management, business.
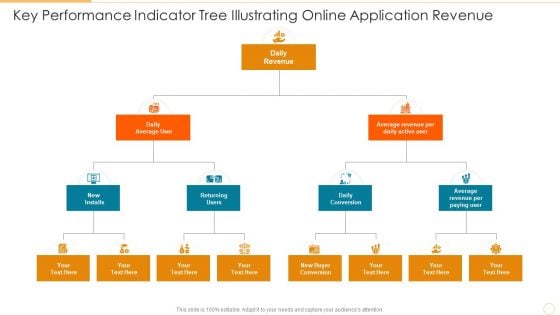
Key Performance Indicator Tree Illustrating Online Application Revenue Download PDF
Presenting key performance indicator tree illustrating online application revenue download pdf to dispense important information. This template comprises three stages. It also presents valuable insights into the topics including daily conversion, returning users, daily revenue. This is a completely customizable PowerPoint theme that can be put to use immediately. So, download it and address the topic impactfully.
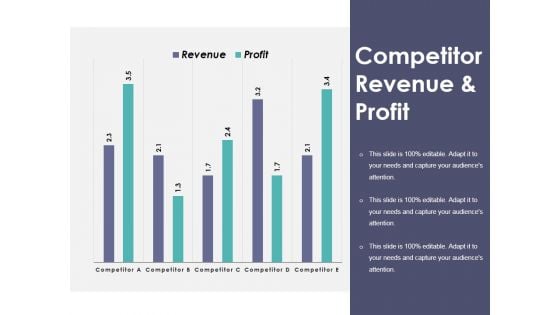
Competitor Revenue And Profit Ppt PowerPoint Presentation Outline Elements
This is a competitor revenue and profit ppt powerpoint presentation outline elements. This is a five stage process. The stages in this process are bar graph, marketing, strategy, finance, planning.
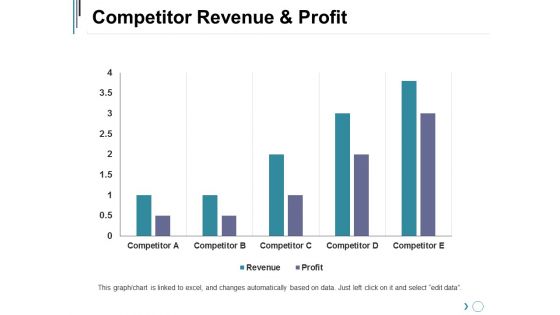
Competitor Revenue And Profit Ppt PowerPoint Presentation Professional Graphics Pictures
This is a competitor revenue and profit ppt powerpoint presentation professional graphics pictures. This is a five stage process. The stages in this process are business, marketing, strategy, graph, finance.
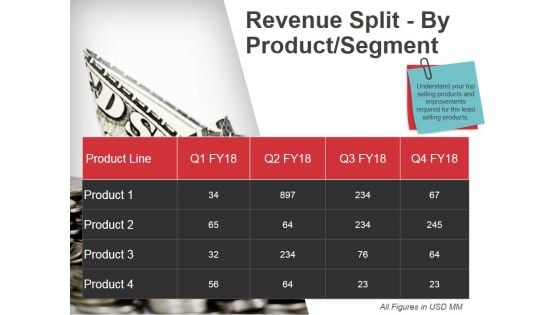
Revenue Split By Product Segment Ppt PowerPoint Presentation Ideas Graphics
This is a revenue split by product segment ppt powerpoint presentation ideas graphics. This is a four stage process. The stages in this process are business, marketing, bar graph, success.
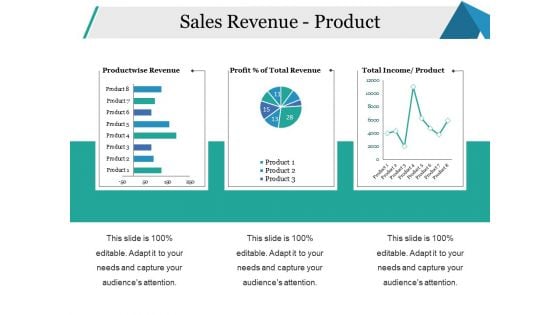
Sales Revenue Product Ppt PowerPoint Presentation Styles Skills
This is a sales revenue product ppt powerpoint presentation styles skills. This is a three stage process. The stages in this process are productwise revenue, income product, business, percentage, strategy.
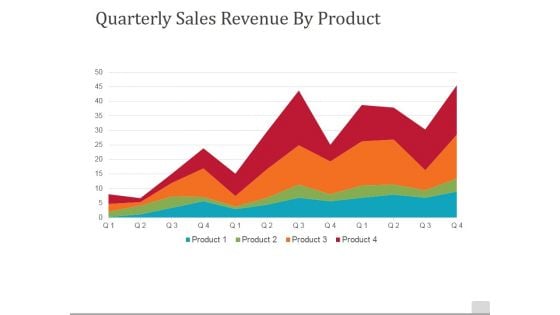
Quarterly Sales Revenue By Product Ppt PowerPoint Presentation File Background
This is a quarterly sales revenue by product ppt powerpoint presentation file background. This is a four stage process. The stages in this process are quarterly, sales revenue by product, business, marketing, success.
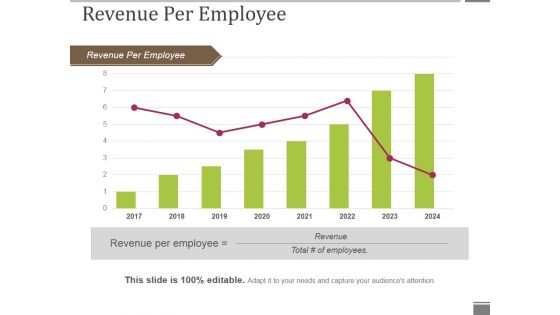
Revenue Per Employee Ppt PowerPoint Presentation Inspiration Objects
This is a revenue per employee ppt powerpoint presentation inspiration objects. This is a eight stage process. The stages in this process are revenue per employee, growth, marketing, business, planning.
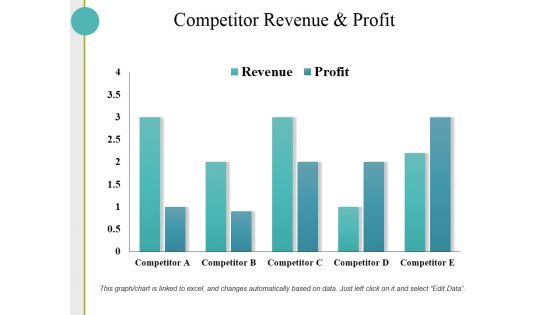
Competitor Revenue And Profit Ppt PowerPoint Presentation Inspiration Slide Portrait
This is a competitor revenue and profit ppt powerpoint presentation inspiration slide portrait. This is a five stage process. The stages in this process are business, finance, analysis, growth, investment.
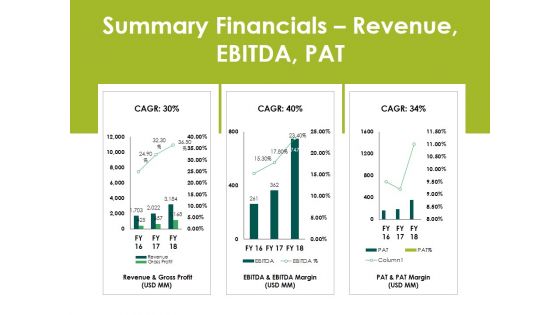
Summary Financials Revenue Ebitda Pat Ppt PowerPoint Presentation Infographics Ideas
This is a summary financials revenue ebitda pat ppt powerpoint presentation infographics ideas. This is a three stage process. The stages in this process are business, finance, analysis, marketing, strategy.
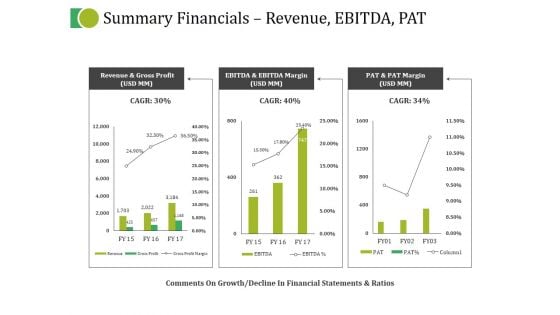
Summary Financials Revenue Ebitda Pat Ppt PowerPoint Presentation Infographics Inspiration
This is a summary financials revenue ebitda pat ppt powerpoint presentation infographics inspiration. This is a three stage process. The stages in this process are business, marketing, strategy, planning, finance.
Revenue Generation Company Performance Ppt PowerPoint Presentation Styles Icon
This is a revenue generation company performance ppt powerpoint presentation styles icon. This is a four stage process. The stages in this process are business, marketing, success, financials, management.

 Home
Home