Sales Dashboard
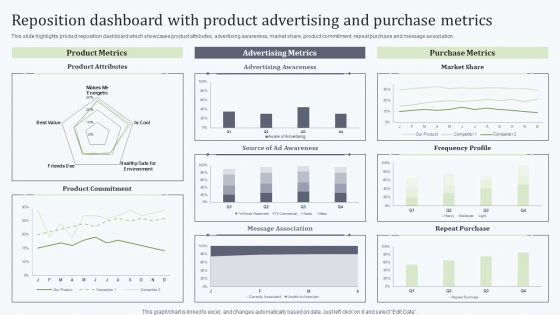
Deploying Revitalization Strategy Enhance Product And Service Sales Reposition Dashboard With Product Slides PDF
This slide highlights product reposition dashboard which showcases product attributes, advertising awareness, market share, product commitment, repeat purchase and message association. If your project calls for a presentation, then Slidegeeks is your go to partner because we have professionally designed, easy to edit templates that are perfect for any presentation. After downloading, you can easily edit Deploying Revitalization Strategy Enhance Product And Service Sales Reposition Dashboard With Product Slides PDF and make the changes accordingly. You can rearrange slides or fill them with different images. Check out all the handy templates
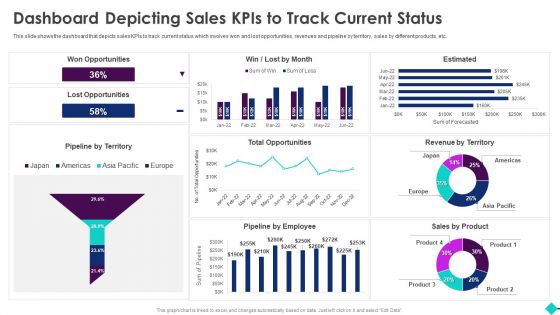
Sales Process Automation For Revenue Growth Dashboard Depicting Sales Kpis To Track Current Status Introduction PDF
This slide shows the dashboard that depicts sales KPIs to track current status which involves won and lost opportunities, revenues and pipeline by territory, sales by different products, etc.Deliver and pitch your topic in the best possible manner with this Sales Process Automation For Revenue Growth Dashboard Depicting Sales Kpis To Track Current Status Introduction PDF. Use them to share invaluable insights on Marketing Effectiveness, Forecast Accuracy, Pipeline Thickness and impress your audience. This template can be altered and modified as per your expectations. So, grab it now.
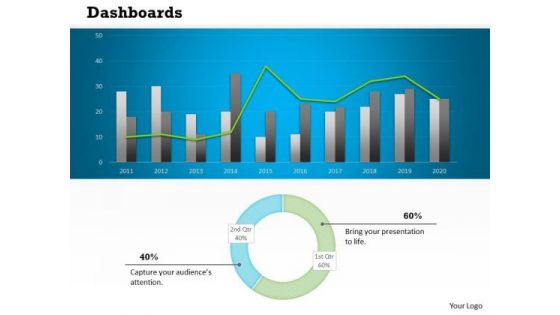
Sales Diagram Business Charts Dashboard Design Strategic Management
Put In A Dollop Of Our Sales Diagram Business Charts Dashboard Design Strategic Management Powerpoint Templates. Give Your Thoughts A Distinctive Flavor.

New Product Sales Strategy And Marketing KPI Dashboard To Monitor Sales Performance Information PDF
This slide shows sales performance monitoring dashboard. Metrics included in the dashboard are sales revenue, sales growth, average revenue per unit, customer lifetime value and customer acquisition cost. Deliver an awe inspiring pitch with this creative New Product Sales Strategy And Marketing KPI Dashboard To Monitor Sales Performance Information PDF bundle. Topics like Sales Revenue, Monthly Sales Growth, Sales Country Performance can be discussed with this completely editable template. It is available for immediate download depending on the needs and requirements of the user.
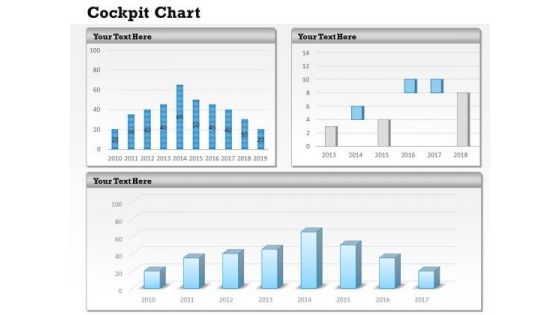
Marketing Diagram Business Intelligence Dashboard Design Sales Diagram
Our Marketing Diagram Business Intelligence Dashboard Design Sales Diagram Powerpoint Templates Team Are A Dogged Lot. They Keep At It Till They Get It Right.
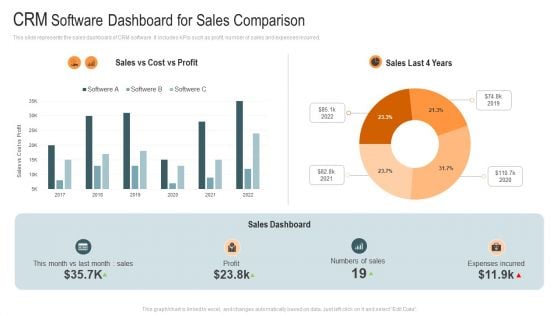
CRM Software Dashboard For Sales Comparison Mockup PDF
This slide represents the sales dashboard of CRM software. It includes KPIs such as profit, number of sales and expenses incurred. Pitch your topic with ease and precision using this CRM Software Dashboard For Sales Comparison Mockup PDF. This layout presents information on Profit, Sales Dashboard, Expenses Incurred. It is also available for immediate download and adjustment. So, changes can be made in the color, design, graphics or any other component to create a unique layout.
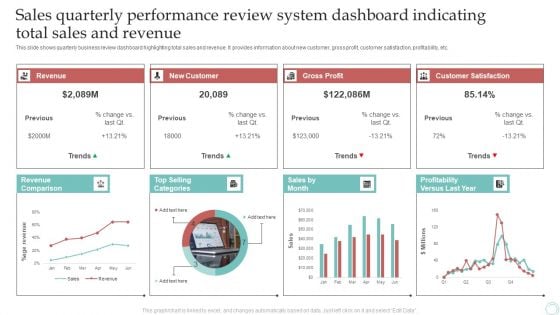
Sales Quarterly Performance Review System Dashboard Indicating Total Sales And Revenue Download PDF
This slide shows quarterly business review dashboard highlighting total sales and revenue. It provides information about new customer, gross profit, customer satisfaction, profitability, etc. Pitch your topic with ease and precision using this Sales Quarterly Performance Review System Dashboard Indicating Total Sales And Revenue Download PDF. This layout presents information on Revenue, New Customer, Gross Profit. It is also available for immediate download and adjustment. So, changes can be made in the color, design, graphics or any other component to create a unique layout.
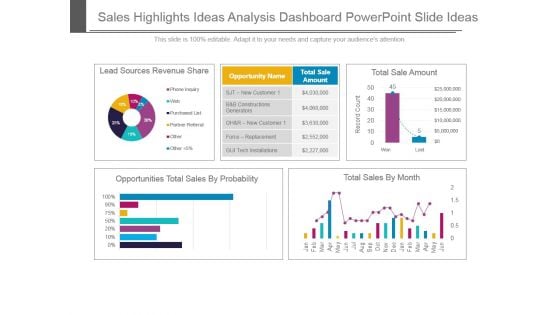
Sales Highlights Ideas Analysis Dashboard Powerpoint Slide Ideas
This is a sales highlights ideas analysis dashboard powerpoint slide ideas. This is a four stage process. The stages in this process are lead sources revenue share, opportunities total sales by probability, total sale amount, total sales by month, opportunity name, total sale amount.
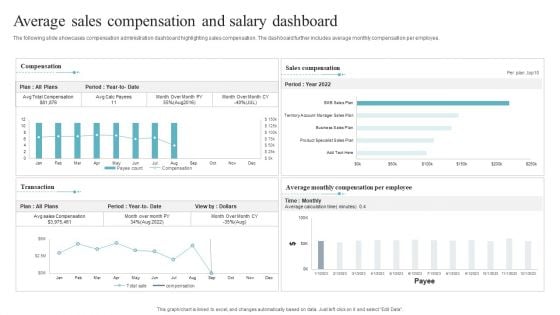
Average Sales Compensation And Salary Dashboard Introduction PDF
The following slide showcases compensation administration dashboard highlighting sales compensation. The dashboard further includes average monthly compensation per employee. Pitch your topic with ease and precision using this Average Sales Compensation And Salary Dashboard Introduction PDF. This layout presents information on Salary Dashboard, Average Sales Compensation. It is also available for immediate download and adjustment. So, changes can be made in the color, design, graphics or any other component to create a unique layout.
Monthly Sales Report Performance Monitoring Dashboard Icon Infographics PDF
This is a Monthly Sales Report Performance Monitoring Dashboard Icon Infographics PDF template with various stages. Focus and dispense information on four stages using this creative set, that comes with editable features. It contains large content boxes to add your information on topics like Monthly Sales, Dashboard Icon, Report Performance. You can also showcase facts, figures, and other relevant content using this PPT layout. Grab it now.
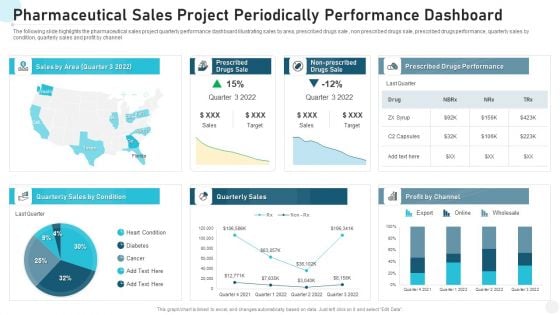
Pharmaceutical Sales Project Periodically Performance Dashboard Brochure PDF
The following slide highlights the pharmaceutical sales project quarterly performance dashboard illustrating sales by area, prescribed drugs sale , non prescribed drugs sale, prescribed drugs performance, quarterly sales by condition, quarterly sales and profit by channel Showcasing this set of slides titled pharmaceutical sales project periodically performance dashboard brochure pdf. The topics addressed in these templates are pharmaceutical sales project periodically performance dashboard. All the content presented in this PPT design is completely editable. Download it and make adjustments in color, background, font etc. as per your unique business setting.
B2B Sales Representatives Performance Tracking Dashboard Elements PDF
This slide provides information regarding B2B sales representatives performance tracking dashboard to measure leads by region, revenue breakdown, top performers by leads, revenues, etc. Deliver an awe inspiring pitch with this creative B2B Sales Representatives Performance Tracking Dashboard Elements PDF bundle. Topics like Revenue Actual, Sales Representatives Performance, Tracking Dashboard can be discussed with this completely editable template. It is available for immediate download depending on the needs and requirements of the user.
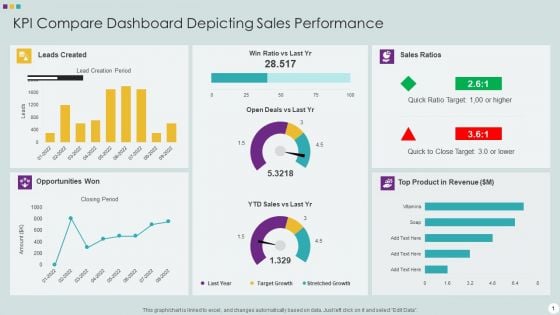
KPI Compare Dashboard Depicting Sales Performance Summary PDF
Pitch your topic with ease and precision using this KPI Compare Dashboard Depicting Sales Performance Summary PDF This layout presents information on KPI Compare Dashboard Depicting Sales Performance It is also available for immediate download and adjustment. So, changes can be made in the color, design, graphics or any other component to create a unique layout.
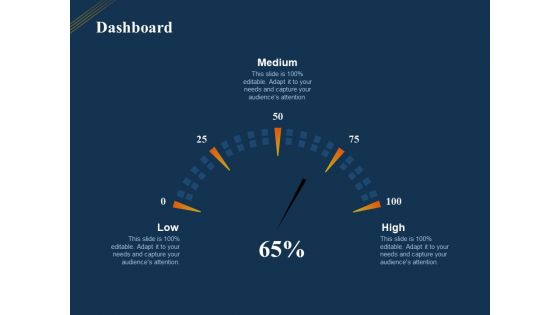
Product Distribution Sales And Marketing Channels Dashboard Ppt Example PDF
Presenting this set of slides with name product distribution sales and marketing channels dashboard ppt example pdf. The topics discussed in these slides are low, medium, high. This is a completely editable PowerPoint presentation and is available for immediate download. Download now and impress your audience.
Sales Key Performance Indicators Dashboard Ppt PowerPoint Presentation Icon PDF
Presenting this set of slides with name sales key performance indicators dashboard ppt powerpoint presentation icon pdf. The topics discussed in these slides are current ticket volume, sales key performance, indicators dashboard. This is a completely editable PowerPoint presentation and is available for immediate download. Download now and impress your audience.
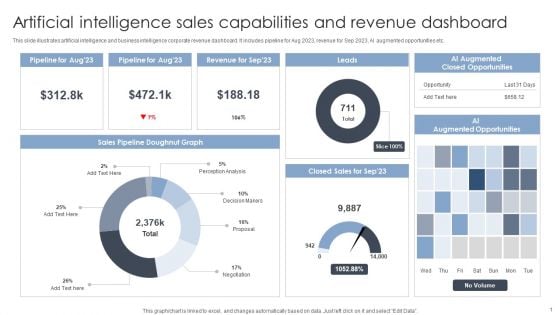
Artificial Intelligence Sales Capabilities And Revenue Dashboard Portrait PDF
This slide illustrates artificial intelligence and business intelligence corporate revenue dashboard. It includes pipeline for Aug 2023, revenue for Sep 2023, AI augmented opportunities etc. Pitch your topic with ease and precision using this Artificial Intelligence Sales Capabilities And Revenue Dashboard Portrait PDF. This layout presents information on Sales Capabilities, Revenue Dashboard. It is also available for immediate download and adjustment. So, changes can be made in the color, design, graphics or any other component to create a unique layout.
Manpower Sales And Productivity Analytics Dashboard Icon Download PDF
Presenting Manpower Sales And Productivity Analytics Dashboard Icon Download PDF to dispense important information. This template comprises four stages. It also presents valuable insights into the topics including Manpower, Sales And Productivity, Analytics Dashboard, Icon. This is a completely customizable PowerPoint theme that can be put to use immediately. So, download it and address the topic impactfully.
Sales And Retail Expenditure Dashboard Icon Diagrams PDF
Persuade your audience using this Sales And Retail Expenditure Dashboard Icon Diagrams PDF. This PPT design covers three stages, thus making it a great tool to use. It also caters to a variety of topics including Sales And Retail, Expenditure Dashboard Icon. Download this PPT design now to present a convincing pitch that not only emphasizes the topic but also showcases your presentation skills.
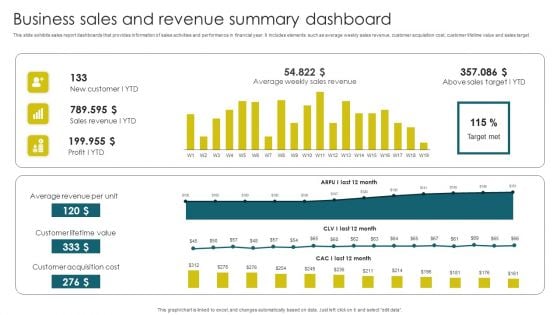
Business Sales And Revenue Summary Dashboard Brochure PDF
This slide exhibits sales report dashboards that provides information of sales activities and performance in financial year. It includes elements such as average weekly sales revenue, customer acquisition cost, customer lifetime value and sales target. Pitch your topic with ease and precision using this Business Sales And Revenue Summary Dashboard Brochure PDF. This layout presents information on Average Revenue, Customer Lifetime, Customer Acquisition. It is also available for immediate download and adjustment. So, changes can be made in the color, design, graphics or any other component to create a unique layout.
Market Penetration Dashboard With Sales Metrics Ppt Icon Examples PDF
This slide shows market penetration dashboard for sales team. It provides information about regions, emerging markets, planned sales, actual sales, revenue, gender wise sales, etc. Pitch your topic with ease and precision using this Market Penetration Dashboard With Sales Metrics Ppt Icon Examples PDF. This layout presents information on Emerging Markets, Sales Gender, Actual Sales. It is also available for immediate download and adjustment. So, changes can be made in the color, design, graphics or any other component to create a unique layout.
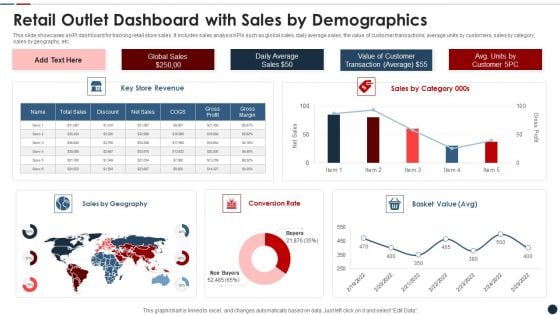
Retail Outlet Dashboard With Sales By Demographics Slides PDF
This slide showcases a KPI dashboard for tracking retail store sales. It includes sales analysis KPIs such as global sales, daily average sales, the value of customer transactions, average units by customers, sales by category, sales by geography, etc. Showcasing this set of slides titled retail outlet dashboard with sales by demographics slides pdf The topics addressed in these templates are Retail outlet dashboard with sales by demographics All the content presented in this PPT design is completely editable. Download it and make adjustments in color, background, font etc. as per your unique business setting.
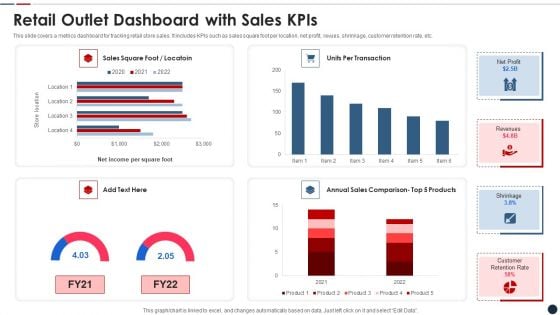
Retail Outlet Dashboard With Sales Kpis Clipart PDF
This slide covers a metrics dashboard for tracking retail store sales. It includes KPIs such as sales square foot per location, net profit, revues, shrinkage, customer retention rate, etc. Pitch your topic with ease and precision using this retail outlet dashboard with sales kpis clipart pdf This layout presents information on Retail outlet dashboard with sales kpis It is also available for immediate download and adjustment. So, changes can be made in the color, design, graphics or any other component to create a unique layout.
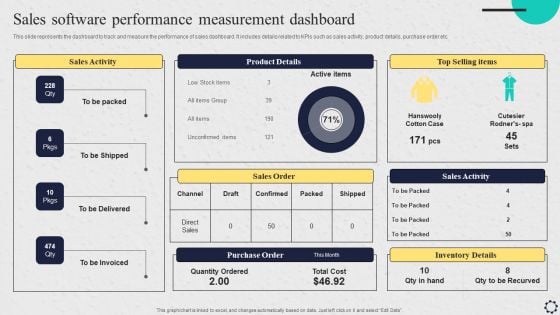
Software Implementation Strategy Sales Software Performance Measurement Dashboard Template PDF
This slide represents the dashboard to track and measure the performance of sales dashboard. It includes details related to KPIs such as sales activity, product details, purchase order etc. Coming up with a presentation necessitates that the majority of the effort goes into the content and the message you intend to convey. The visuals of a PowerPoint presentation can only be effective if it supplements and supports the story that is being told. Keeping this in mind our experts created Software Implementation Strategy Sales Software Performance Measurement Dashboard Template PDF to reduce the time that goes into designing the presentation. This way, you can concentrate on the message while our designers take care of providing you with the right template for the situation.
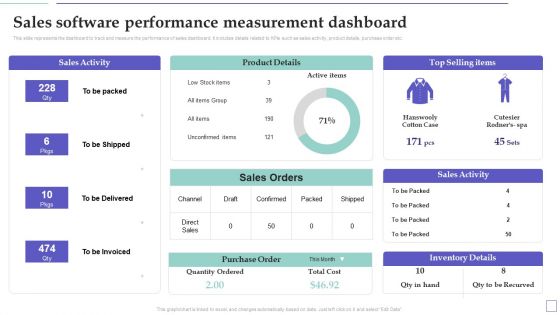
System Deployment Project Sales Software Performance Measurement Dashboard Summary PDF
This slide represents the dashboard to track and measure the performance of sales dashboard. It includes details related to KPIs such as sales activity, product details, purchase order etc. Welcome to our selection of the System Deployment Project Sales Software Performance Measurement Dashboard Summary PDF. These are designed to help you showcase your creativity and bring your sphere to life. Planning and Innovation are essential for any business that is just starting out. This collection contains the designs that you need for your everyday presentations. All of our PowerPoints are 100 percent editable, so you can customize them to suit your needs. This multi-purpose template can be used in various situations. Grab these presentation templates today.
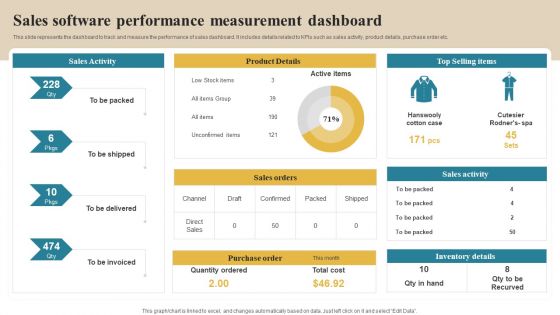
Software Implementation Technique Sales Software Performance Measurement Dashboard Slides PDF
This slide represents the dashboard to track and measure the performance of sales dashboard. It includes details related to KPIs such as sales activity, product details, purchase order etc. This modern and well arranged Software Implementation Technique Sales Software Performance Measurement Dashboard Slides PDF provides lots of creative possibilities. It is very simple to customize and edit with the Powerpoint Software. Just drag and drop your pictures into the shapes. All facets of this template can be edited with Powerpoint no extra software is necessary. Add your own material, put your images in the places assigned for them, adjust the colors, and then you can show your slides to the world, with an animated slide included.
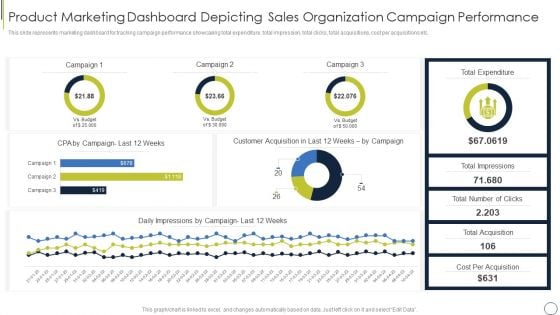
Product Marketing Dashboard Depicting Sales Organization Campaign Performance Themes PDF
This slide represents marketing dashboard for tracking campaign performance showcasing total expenditure, total impression, total clicks, total acquisitions, cost per acquisitions etc. Pitch your topic with ease and precision using this product marketing dashboard depicting sales organization campaign performance themes pdf. This layout presents information on product marketing dashboard depicting sales organization campaign performance. It is also available for immediate download and adjustment. So, changes can be made in the color, design, graphics or any other component to create a unique layout.
B2B Sales Representatives Performance Tracking Dashboard Pictures PDF
This slide provides information regarding B2B sales representatives performance tracking dashboard to measure leads by region, revenue breakdown, top performers by leads, revenues, etc. Deliver and pitch your topic in the best possible manner with this b2b sales representatives performance tracking dashboard pictures pdf Use them to share invaluable insights on b2b prospects performance measurement dashboard and impress your audience. This template can be altered and modified as per your expectations. So, grab it now.
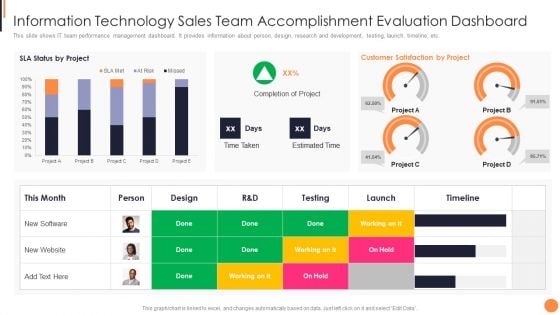
Information Technology Sales Team Accomplishment Evaluation Dashboard Rules PDF
This slide shows IT team performance management dashboard. It provides information about person, design, research and development, testing, launch, timeline, etc.Showcasing this set of slides titled information technology sales team accomplishment evaluation dashboard rules pdf The topics addressed in these templates are information technology sales team accomplishment evaluation dashboard All the content presented in this PPT design is completely editable. Download it and make adjustments in color, background, font etc. as per your unique business setting.
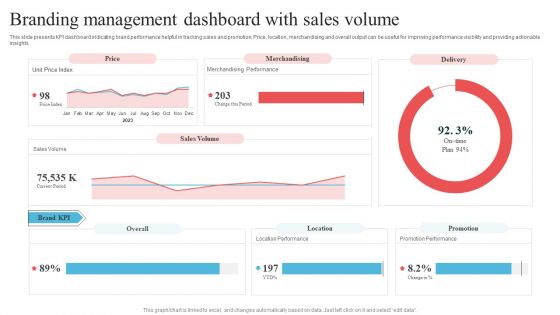
Branding Management Dashboard With Sales Volume Mockup PDF
This slide presents KPI dashboard indicating brand performance helpful in tracking sales and promotion. Price, location, merchandising and overall output can be useful for improving performance visibility and providing actionable insights. Showcasing this set of slides titled Branding Management Dashboard With Sales Volume Mockup PDF. The topics addressed in these templates are Branding Management Dashboard, Sales Volume. All the content presented in this PPT design is completely editable. Download it and make adjustments in color, background, font etc. as per your unique business setting.
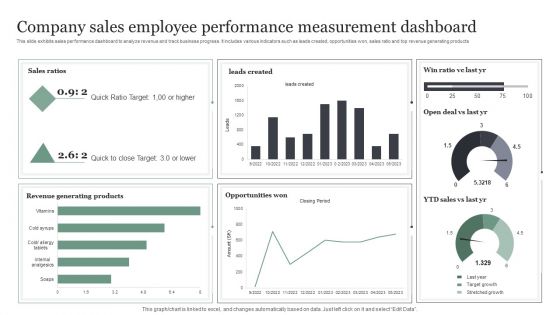
Company Sales Employee Performance Measurement Dashboard Information PDF
This slide exhibits sales performance dashboard to analyze revenue and track business progress. It includes various indicators such as leads created, opportunities won, sales ratio and top revenue generating products. Showcasing this set of slides titled Company Sales Employee Performance Measurement Dashboard Information PDF. The topics addressed in these templates are Quick Ratio Target, Opportunities Won, Revenue Generating Products. All the content presented in this PPT design is completely editable. Download it and make adjustments in color, background, font etc. as per your unique business setting.
B2B Sales Representatives Performance Tracking Dashboard Background PDF
This slide provides information regarding B2B sales representatives performance tracking dashboard to measure leads by region, revenue breakdown, top performers by leads, revenues, etc. Deliver and pitch your topic in the best possible manner with this B2B Sales Representatives Performance Tracking Dashboard Background PDF. Use them to share invaluable insights on Individual Performance, Achieved Highest, Revenue Relative and impress your audience. This template can be altered and modified as per your expectations. So, grab it now.
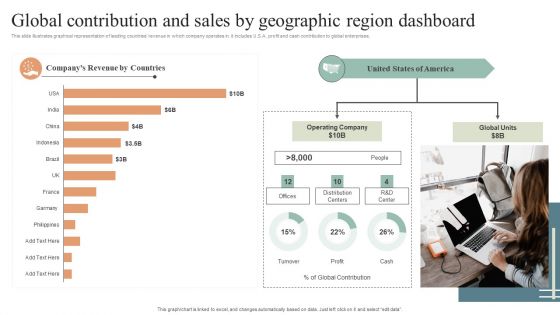
Global Contribution And Sales By Geographic Region Dashboard Diagrams PDF
This slide illustrates graphical representation of leading countries revenue in which company operates in. it includes U.S.A. profit and cash contribution to global enterprises. Pitch your topic with ease and precision using this Global Contribution And Sales By Geographic Region Dashboard Diagrams PDF. This layout presents information on Global Contribution, Sales By Geographic, Region Dashboard. It is also available for immediate download and adjustment. So, changes can be made in the color, design, graphics or any other component to create a unique layout.
Five Years Sales Projection And Analysis Dashboard Icons PDF
This slide defines the dashboard for five years sales forecast and analysis . It includes information related to the estimated and actual sales. Pitch your topic with ease and precision using this Five Years Sales Projection And Analysis Dashboard Icons PDF. This layout presents information on Forecast Value, Forecast Accuracy, Won Opportunities. It is also available for immediate download and adjustment. So, changes can be made in the color, design, graphics or any other component to create a unique layout.
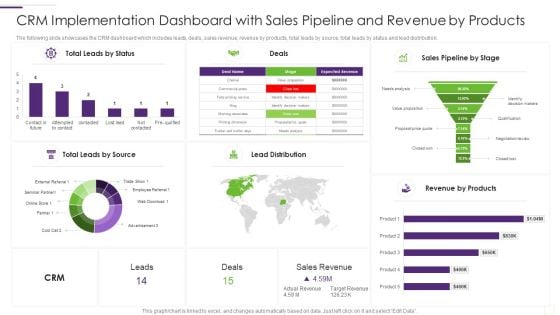
CRM Implementation Strategy CRM Implementation Dashboard With Sales Pictures PDF
The following slide showcases the CRM dashboard which includes leads, deals, sales revenue, revenue by products, total leads by source, total leads by status and lead distribution.Deliver and pitch your topic in the best possible manner with this CRM Implementation Strategy CRM Implementation Dashboard With Sales Pictures PDF Use them to share invaluable insights on Leads By Status, Leads By Source, Lead Distribution and impress your audience. This template can be altered and modified as per your expectations. So, grab it now.
Salesman Principles Playbook Sales Management Activities Tracking Dashboard Ideas PDF
This slide provides information regarding various metrics catered to track sales team performance in terms of average revenue per account, win rate, NPS, along with sales representative performance tracking through number of opportunities created, lead response time, etc. Deliver and pitch your topic in the best possible manner with this salesman principles playbook sales management activities tracking dashboard ideas pdf Use them to share invaluable insights on sales management activities tracking dashboard and impress your audience. This template can be altered and modified as per your expectations. So, grab it now.
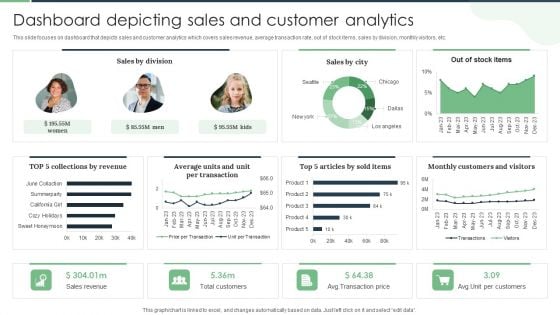
Dashboard Depicting Sales And Customer Analytics Professional PDF
This slide focuses on dashboard that depicts sales and customer analytics which covers sales revenue, average transaction rate, out of stock items, sales by division, monthly visitors, etc. Make sure to capture your audiences attention in your business displays with our gratis customizable Dashboard Depicting Sales And Customer Analytics Professional PDF. These are great for business strategies, office conferences, capital raising or task suggestions. If you desire to acquire more customers for your tech business and ensure they stay satisfied, create your own sales presentation with these plain slides.
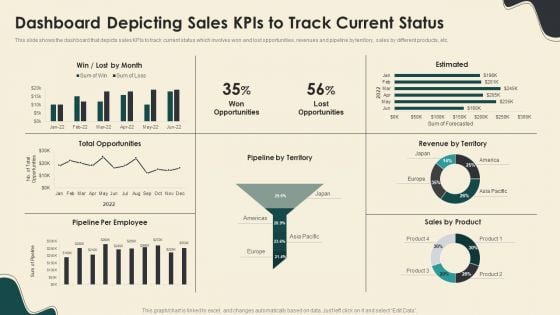
Dashboard Depicting Sales Kpis To Track Current Status Structure PDF
This slide shows the dashboard that depicts sales KPIs to track current status which involves won and lost opportunities, revenues and pipeline by territory, sales by different products, etc. Deliver and pitch your topic in the best possible manner with this Dashboard Depicting Sales Kpis To Track Current Status Structure PDF. Use them to share invaluable insights on Total Opportunities, Revenue By Territory, Sales By Product and impress your audience. This template can be altered and modified as per your expectations. So, grab it now.
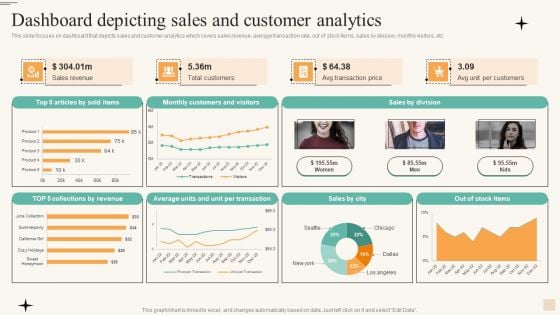
Dashboard Depicting Sales And Customer Analytics Infographics PDF
This slide focuses on dashboard that depicts sales and customer analytics which covers sales revenue, average transaction rate, out of stock items, sales by division, monthly visitors, etc. If you are looking for a format to display your unique thoughts, then the professionally designed Dashboard Depicting Sales And Customer Analytics Infographics PDF is the one for you. You can use it as a Google Slides template or a PowerPoint template. Incorporate impressive visuals, symbols, images, and other charts. Modify or reorganize the text boxes as you desire. Experiment with shade schemes and font pairings. Alter, share or cooperate with other people on your work. Download Dashboard Depicting Sales And Customer Analytics Infographics PDF and find out how to give a successful presentation. Present a perfect display to your team and make your presentation unforgettable.
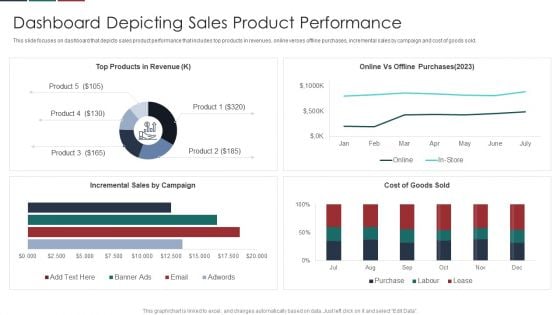
Deliver Efficiency Innovation Dashboard Depicting Sales Product Performance Themes PDF
This slide focuses on dashboard that depicts sales product performance that includes top products in revenues, online verses offline purchases, incremental sales by campaign and cost of goods sold. Deliver an awe inspiring pitch with this creative Deliver Efficiency Innovation Dashboard Depicting Sales Product Performance Themes PDF bundle. Topics like Top Products Revenue, Online Vs Offline Purchases, Incremental Sales Campaign, Cost Goods Sold can be discussed with this completely editable template. It is available for immediate download depending on the needs and requirements of the user.
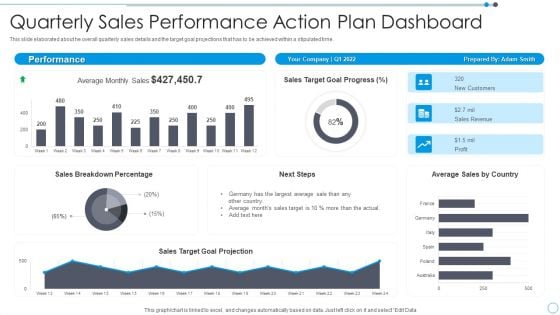
Quarterly Sales Performance Action Plan Dashboard Mockup PDF
This slide elaborated about he overall quarterly sales details and the target goal projections that has to be achieved within a stipulated time. Pitch your topic with ease and precision using this Quarterly Sales Performance Action Plan Dashboard Mockup PDF. This layout presents information on Sales, Target, Goal. It is also available for immediate download and adjustment. So, changes can be made in the color, design, graphics or any other component to create a unique layout.
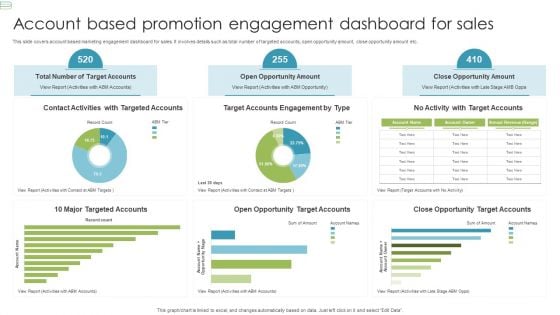
Account Based Promotion Engagement Dashboard For Sales Background PDF
This slide covers account based marketing engagement dashboard for sales. It involves details such as total number of targeted accounts, open opportunity amount, close opportunity amount etc. Pitch your topic with ease and precision using this Account Based Promotion Engagement Dashboard For Sales Background PDF. This layout presents information on Target Accounts, Open Opportunity Amount, Close Opportunity Amount. It is also available for immediate download and adjustment. So, changes can be made in the color, design, graphics or any other component to create a unique layout.
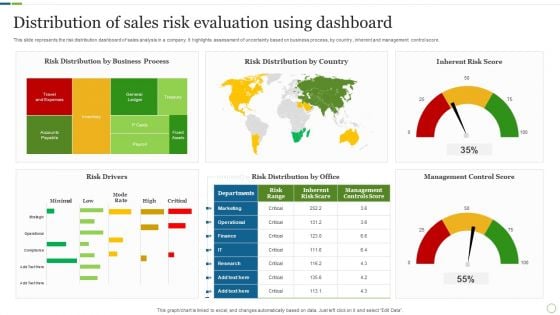
Distribution Of Sales Risk Evaluation Using Dashboard Brochure PDF
This slide represents the risk distribution dashboard of sales analysis in a company. It highlights assessment of uncertainty based on business process, by country , inherent and management control score. Showcasing this set of slides titled Distribution Of Sales Risk Evaluation Using Dashboard Brochure PDF. The topics addressed in these templates are Risk Drivers, Management Control Score, Inherent Risk Score. All the content presented in this PPT design is completely editable. Download it and make adjustments in color, background, font etc. as per your unique business setting.
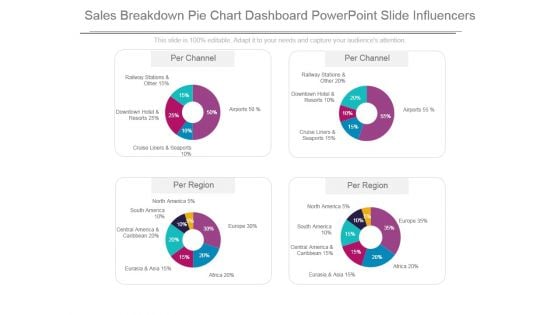
Sales Breakdown Pie Chart Dashboard Powerpoint Slide Influencers
This is a sales breakdown pie chart dashboard powerpoint slide influencers. This is a four stage process. The stages in this process are railway stations and other, downtown hotel and resorts, cruise liners and seaports, airports, north america, south america, central america and caribbean, eurasia and asia, africa, europe.
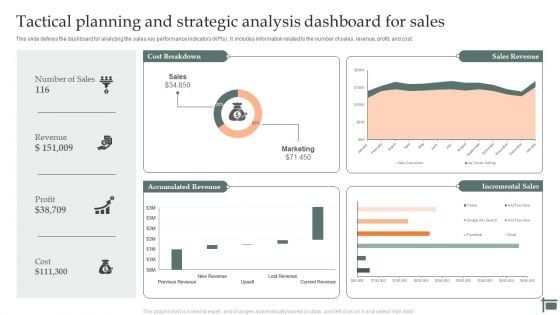
Tactical Planning And Strategic Analysis Dashboard For Sales Infographics PDF
Persuade your audience using this Tactical Planning And Strategic Analysis Dashboard For Sales Infographics PDF. This PPT design covers three stages, thus making it a great tool to use. It also caters to a variety of topics including Tactical, Planning And Analyzing, Organizational Goals, Icon. Download this PPT design now to present a convincing pitch that not only emphasizes the topic but also showcases your presentation skills.
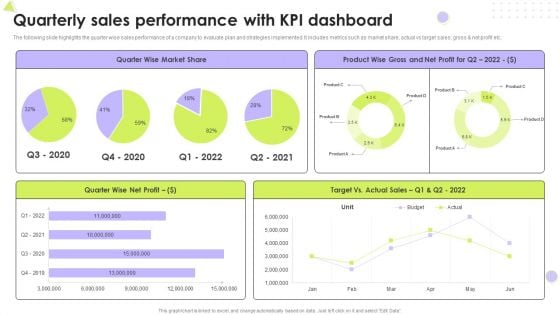
Quarterly Sales Performance With Kpi Dashboard Introduction PDF
The following slide highlights the quarter wise sales performance of a company to evaluate plan and strategies implemented. It includes metrics such as market share, actual vs target sales, gross and net profit etc. Pitch your topic with ease and precision using this Quarterly Sales Performance With Kpi Dashboard Introduction PDF. This layout presents information on Market Share, Net Profit, Target. It is also available for immediate download and adjustment. So, changes can be made in the color, design, graphics or any other component to create a unique layout.
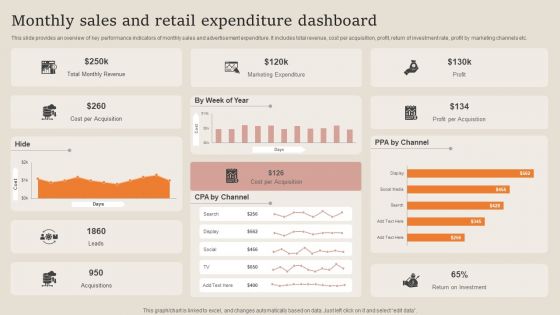
Monthly Sales And Retail Expenditure Dashboard Summary PDF
This slide provides an overview of key performance indicators of monthly sales and advertisement expenditure. It includes total revenue, cost per acquisition, profit, return of investment rate, profit by marketing channels etc. Pitch your topic with ease and precision using this Monthly Sales And Retail Expenditure Dashboard Summary PDF. This layout presents information on Marketing Expenditure, Revenue, Cost Per Acquisition. It is also available for immediate download and adjustment. So, changes can be made in the color, design, graphics or any other component to create a unique layout.
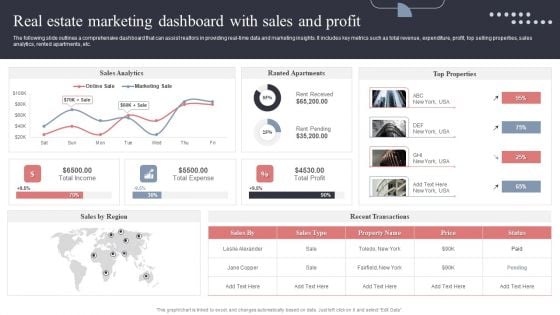
Real Estate Marketing Dashboard With Sales And Profit Formats PDF
The following slide outlines a comprehensive dashboard that can assist realtors in providing real-time data and marketing insights. It includes key metrics such as total revenue, expenditure, profit, top selling properties, sales analytics, rented apartments, etc. This modern and well-arranged Real Estate Marketing Dashboard With Sales And Profit Formats PDF provides lots of creative possibilities. It is very simple to customize and edit with the Powerpoint Software. Just drag and drop your pictures into the shapes. All facets of this template can be edited with Powerpoint, no extra software is necessary. Add your own material, put your images in the places assigned for them, adjust the colors, and then you can show your slides to the world, with an animated slide included.
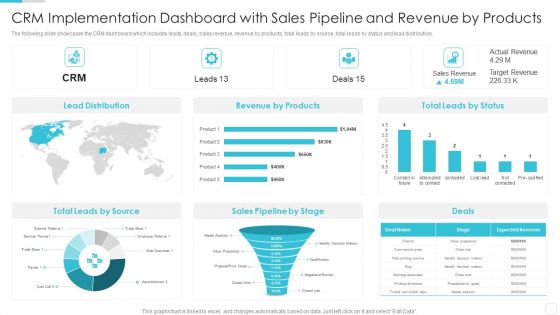
Sales CRM Cloud Solutions Deployment CRM Implementation Dashboard With Sales Template PDF
The following slide showcases the CRM dashboard which includes leads, deals, sales revenue, revenue by products, total leads by source, total leads by status and lead distribution.Deliver and pitch your topic in the best possible manner with this Sales CRM Cloud Solutions Deployment CRM Implementation Dashboard With Sales Template PDF. Use them to share invaluable insights on Lead Distribution, Revenue By Products, Leads By Source and impress your audience. This template can be altered and modified as per your expectations. So, grab it now.
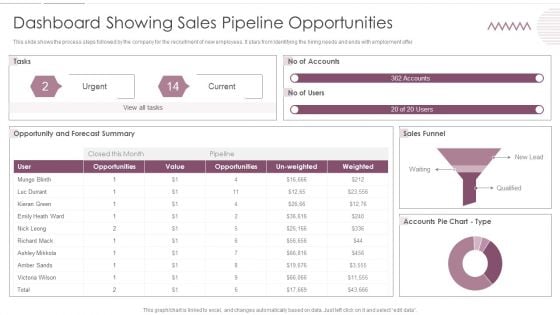
Sales Management Pipeline For Effective Lead Generation Dashboard Showing Sales Pipeline Opportunities Mockup PDF
This slide shows the process steps followed by the company for the recruitment of new employees. It stars from Identifying the hiring needs and ends with employment offer. Deliver an awe inspiring pitch with this creative Sales Management Pipeline For Effective Lead Generation Dashboard Showing Sales Pipeline Opportunities Mockup PDF bundle. Topics like Opportunities, Sales Funnel can be discussed with this completely editable template. It is available for immediate download depending on the needs and requirements of the user.

Multiple Point Of Sale System Dashboard Depicting Restaurants Daily Performance Mockup PDF
This Slide represents point of sale system dashboard depicting restaurants daily performance which can be beneficial for eateries to manage their regular sales. It includes information about sales, expenditure, menu, customer data, bookings and reports. Persuade your audience using this Multiple Point Of Sale System Dashboard Depicting Restaurants Daily Performance Mockup PDF. This PPT design covers four stages, thus making it a great tool to use. It also caters to a variety of topics including Expenditure, Sales, Customer Data. Download this PPT design now to present a convincing pitch that not only emphasizes the topic but also showcases your presentation skills.
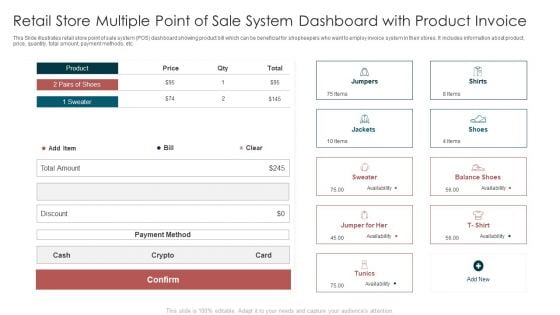
Retail Store Multiple Point Of Sale System Dashboard With Product Invoice Inspiration PDF
This Slide illustrates retail store point of sale system POS dashboard showing product bill which can be beneficial for shopkeepers who want to employ invoice system in their stores. It includes information about product, price, quantity, total amount, payment methods, etc. Pitch your topic with ease and precision using this Retail Store Multiple Point Of Sale System Dashboard With Product Invoice Inspiration PDF. This layout presents information on Payment Method, Product, Availability. It is also available for immediate download and adjustment. So, changes can be made in the color, design, graphics or any other component to create a unique layout.
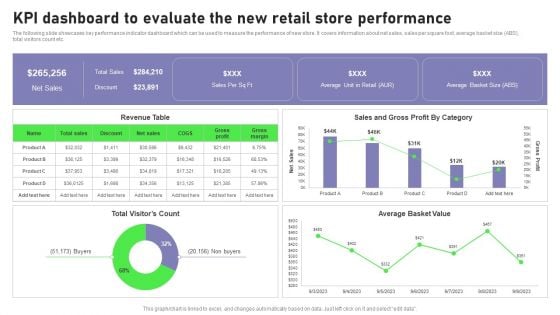
Retail Outlet Opening To Enhance Product Sale Kpi Dashboard To Evaluate The New Retail Guidelines PDF
The following slide showcases key performance indicator dashboard which can be used to measure the performance of new store. It covers information about net sales, sales per square foot, average basket size ABS, total visitors count etc. There are so many reasons you need a Retail Outlet Opening To Enhance Product Sale Kpi Dashboard To Evaluate The New Retail Guidelines PDF. The first reason is you can not spend time making everything from scratch, Thus, Slidegeeks has made presentation templates for you too. You can easily download these templates from our website easily.

Dashboard Employee Attrition Rate Sale Microsoft PDF
This slide shows the dashboard related to the growth in attrition rate of the employees in the company. Deliver an awe inspiring pitch with this creative dashboard employee attrition rate sale microsoft pdf bundle. Topics like dashboard employee attrition rate can be discussed with this completely editable template. It is available for immediate download depending on the needs and requirements of the user.
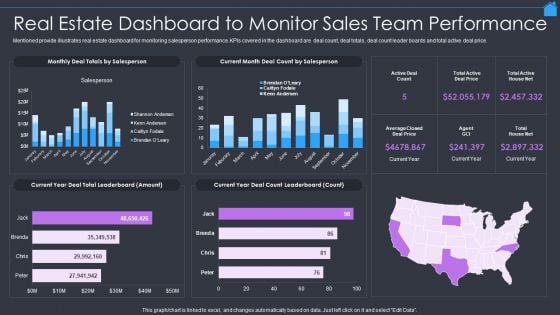
Marketing Strategy To Enhance Real Estate Sales Real Estate Dashboard To Monitor Sales Team Performance Infographics PDF
Mentioned provide illustrates real estate dashboard for monitoring salesperson performance. KPIs covered in the dashboard are deal count, deal totals, deal count leader boards and total active deal price. Deliver an awe inspiring pitch with this creative Marketing Strategy To Enhance Real Estate Sales Real Estate Dashboard To Monitor Sales Team Performance Infographics PDF bundle. Topics like Real Estate Dashboard, Monitor Sales Team Performance can be discussed with this completely editable template. It is available for immediate download depending on the needs and requirements of the user.
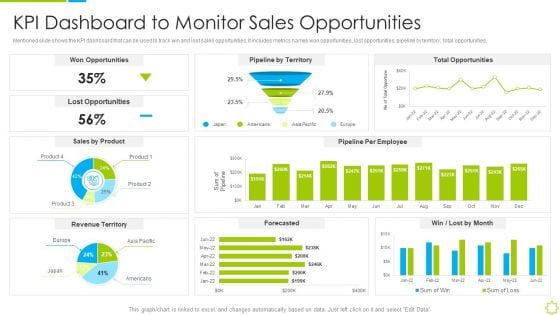
Launch New Sales Enablement Program Lead Generation KPI Dashboard To Monitor Sales Topics PDF
Mentioned slide shows the KPI dashboard that can be used to track win and lost sales opportunities. It includes metrics namely won opportunities, lost opportunities, pipeline by territory, total opportunities. Deliver and pitch your topic in the best possible manner with this launch new sales enablement program lead generation kpi dashboard to monitor sales topics pdf. Use them to share invaluable insights on kpi dashboard to monitor sales opportunities and impress your audience. This template can be altered and modified as per your expectations. So, grab it now.
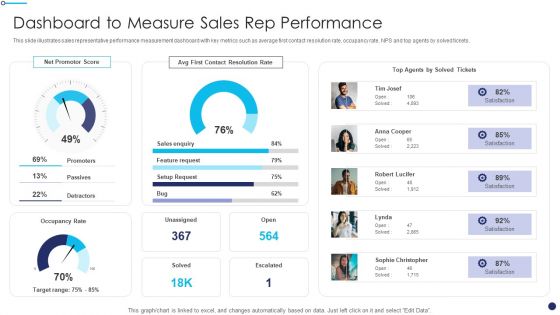
Effective Sales Technique For New Product Launch Dashboard To Measure Sales Rep Performance Themes PDF
This slide illustrates sales representative performance measurement dashboard with key metrics such as average first contact resolution rate, occupancy rate, NPS and top agents by solved tickets.Deliver and pitch your topic in the best possible manner with this Effective Sales Technique For New Product Launch Dashboard To Measure Sales Rep Performance Themes PDF Use them to share invaluable insights on Contact Resolution, Feature Request, Promoters and impress your audience. This template can be altered and modified as per your expectations. So, grab it now.
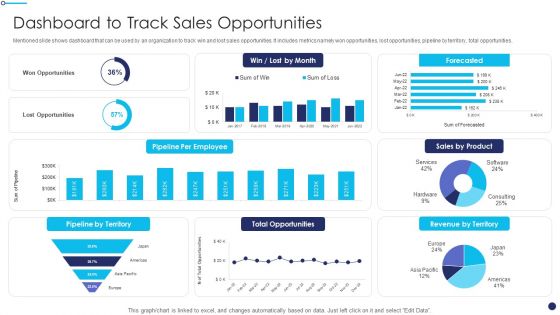
Effective Sales Technique For New Product Launch Dashboard To Track Sales Opportunities Introduction PDF
Mentioned slide shows dashboard that can be used by an organization to track win and lost sales opportunities. It includes metrics namely won opportunities, lost opportunities, pipeline by territory, total opportunities.Deliver an awe inspiring pitch with this creative Effective Sales Technique For New Product Launch Dashboard To Track Sales Opportunities Introduction PDF bundle. Topics like Lost Opportunities, Total Opportunities, Revenue Territory can be discussed with this completely editable template. It is available for immediate download depending on the needs and requirements of the user.
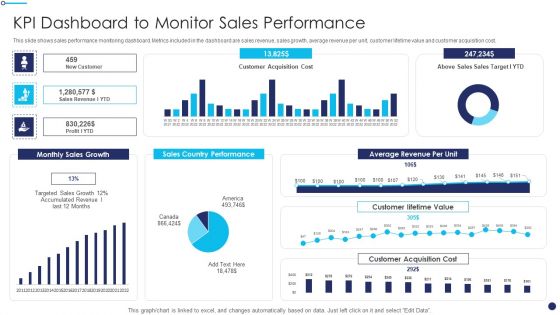
Effective Sales Technique For New Product Launch KPI Dashboard To Monitor Sales Performance Graphics PDF
This slide shows sales performance monitoring dashboard. Metrics included in the dashboard are sales revenue, sales growth, average revenue per unit, customer lifetime value and customer acquisition cost.Deliver an awe inspiring pitch with this creative Effective Sales Technique For New Product Launch KPI Dashboard To Monitor Sales Performance Graphics PDF bundle. Topics like Country Performance, Average Revenue, Customer Acquisition can be discussed with this completely editable template. It is available for immediate download depending on the needs and requirements of the user.
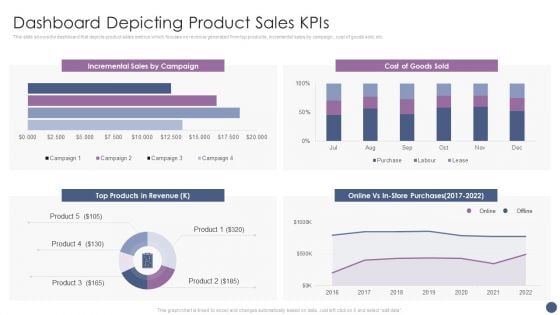
Competitive Sales Strategy Development Plan For Revenue Growth Dashboard Depicting Product Sales Kpis Elements PDF
This slide shows the dashboard that depicts product sales metrics which focuses on revenue generated from top products, incremental sales by campaign, cost of goods sold, etc. Deliver an awe inspiring pitch with this creative Competitive Sales Strategy Development Plan For Revenue Growth Dashboard Depicting Product Sales Kpis Elements PDF bundle. Topics like Incremental Sales, Cost, Store Purchases can be discussed with this completely editable template. It is available for immediate download depending on the needs and requirements of the user.
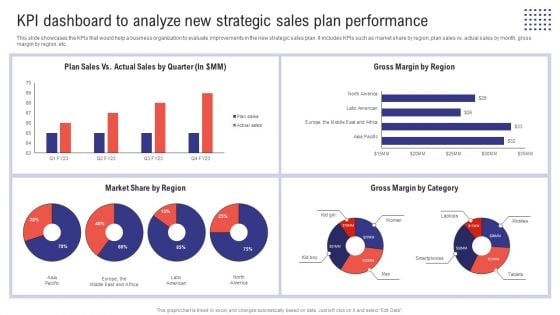
Planning Sales Campaign To Improve KPI Dashboard To Analyze New Strategic Sales Plan Information PDF
This slide showcases the KPIs that would help a business organization to evaluate improvements in the new strategic sales plan. It includes KPIs such as market share by region, plan sales vs. actual sales by month, gross margin by region, etc. Welcome to our selection of the Planning Sales Campaign To Improve KPI Dashboard To Analyze New Strategic Sales Plan Information PDF. These are designed to help you showcase your creativity and bring your sphere to life. Planning and Innovation are essential for any business that is just starting out. This collection contains the designs that you need for your everyday presentations. All of our PowerPoints are 100 percent editable, so you can customize them to suit your needs. This multi-purpose template can be used in various situations. Grab these presentation templates today.

 Home
Home