Sales Graph
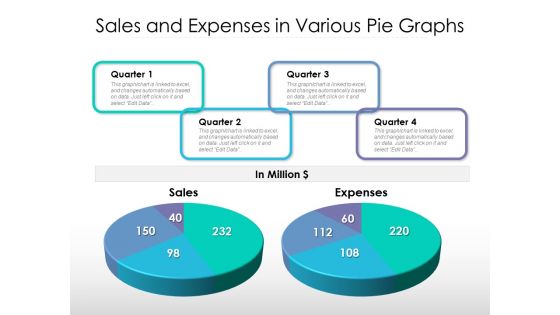
Sales And Expenses In Various Pie Graphs Ppt PowerPoint Presentation Ideas Backgrounds PDF
Pitch your topic with ease and precision using this sales and expenses in various pie graphs ppt powerpoint presentation ideas backgrounds pdf. This layout presents information on sales, expenses, quarter. It is also available for immediate download and adjustment. So, changes can be made in the color, design, graphics or any other component to create a unique layout.
Key Drivers Of Sales And Marketing Growth With Bar Graph Vector Icon Ppt PowerPoint Presentation File Inspiration PDF
Presenting key drivers of sales and marketing growth with bar graph vector icon ppt powerpoint presentation file inspiration pdf to dispense important information. This template comprises one stages. It also presents valuable insights into the topics including key drivers of sales and marketing growth with bar graph vector icon. This is a completely customizable PowerPoint theme that can be put to use immediately. So, download it and address the topic impactfully.
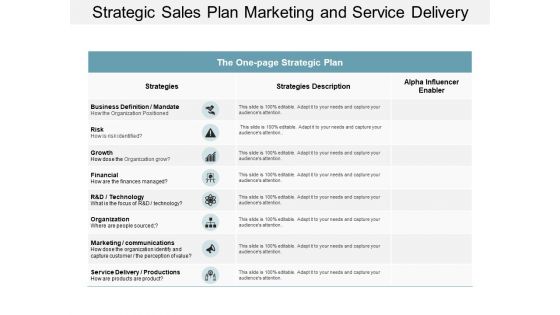
Strategic Sales Plan Marketing And Service Delivery Ppt Powerpoint Presentation Diagram Graph Charts
This is a strategic sales plan marketing and service delivery ppt powerpoint presentation diagram graph charts. This is a three stage process. The stages in this process are one page strategy, one page plan, one page approach.
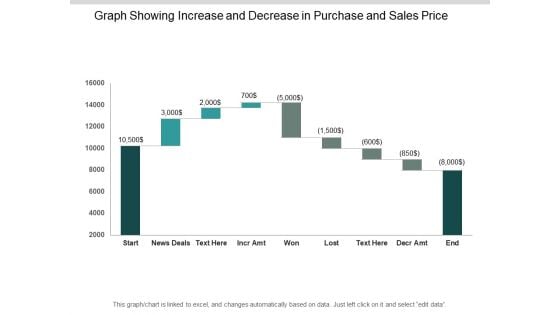
Graph Showing Increase And Decrease In Purchase And Sales Price Ppt PowerPoint Presentation Outline Gallery
This is a graph showing increase and decrease in purchase and sales price ppt powerpoint presentation outline gallery. This is a nine stage process. The stages in this process are sales waterfall, waterfall chart, business.
Graph Business PowerPoint Template 0810
An illustration of 3d colorful graph design element Entertain the audience in your adorable way. Our Graph Business PowerPoint Template 0810 will make them your fans.
Bar Graph PowerPoint Icon C
3D style of a vector bar graph . Be explicit with our Bar Graph PowerPoint Icon C. Express your views clearly and fully.
Bar Graph PowerPoint Icon Cc
3D style of a vector bar graph . Buyers like to associate with brands. Create one of your own with our Bar Graph PowerPoint Icon Cc.
Bar Graph PowerPoint Icon S
3D style of a vector bar graph . Display visionary leadership with our Bar Graph PowerPoint Icon S. They will make you look good.
Graph Business PowerPoint Template 0910
Business 3d graph multi colored with spiral arrows around bars. Get the break you have been waiting for. Earn it with the help of our Graph Business PowerPoint Template 0910.

Graph Success PowerPoint Template 0810
business success concept computer generated illustration for special design Arouse their curiosity with our Graph Success PowerPoint Template 0810. Your thoughts will provide the answers.
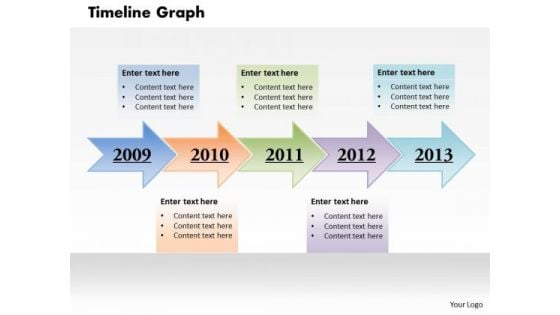
Timeline Graph PowerPoint Presentation Template
Our Timeline Graph PowerPoint Presentation Template Powerpoint Templates Enjoy Drama. They Provide Entertaining Backdrops. Our Business Plan Powerpoint Templates Help To Make A Draft. They Give You A Good Place To Start.
Bar Graph Slashed PowerPoint Icon C
budget cuts layoffs and dropped sales business model Attract customers with our Bar Graph Slashed PowerPoint Icon C. Just download, type and present.
Bar Graph Slashed PowerPoint Icon Cc
budget cuts layoffs and dropped sales business model Establish benchmarks with our Bar Graph Slashed PowerPoint Icon Cc. Your thoughts will be an example to live upto.

Market Graph Business PowerPoint Template 0810
Closeup of pen showing on sales report Let your thoughts evolve. Our Market Graph Business PowerPoint Template 0810 will nurture their growth.
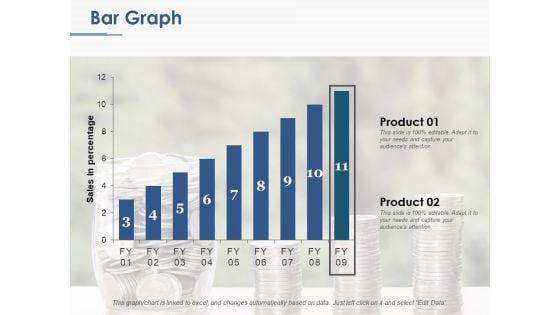
Bar Graph Ppt PowerPoint Presentation Ideas Display
This is a bar graph ppt powerpoint presentation ideas display. This is a two stage process. The stages in this process are product, sales in percentage, bar graph.
Bar Graph Slashed PowerPoint Icon S
budget cuts layoffs and dropped sales business model Impress the rank and file with our Bar Graph Slashed PowerPoint Icon S. Everyone will be awed by their ability.
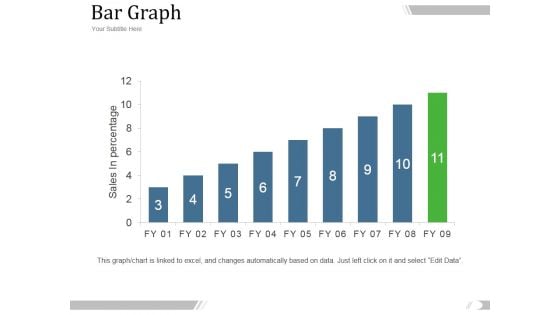
Bar Graph Ppt PowerPoint Presentation Introduction
This is a bar graph ppt powerpoint presentation introduction. This is a eleven stage process. The stages in this process are management, marketing, business, fy, graph, sales in percentage.
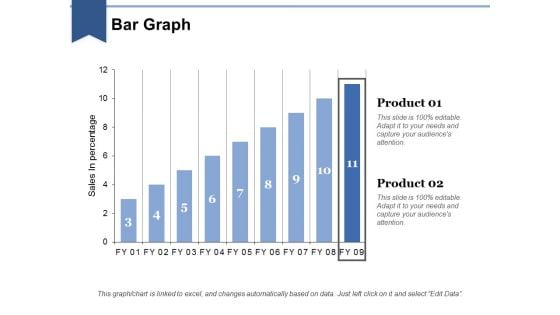
Bar Graph Ppt PowerPoint Presentation Layouts Influencers
This is a bar graph ppt powerpoint presentation layouts influencers. This is a two stage process. The stages in this process are business, marketing, in bar graph, sales in percentage, finance.
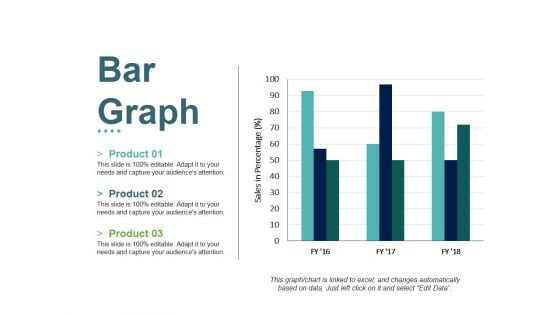
Bar Graph Ppt PowerPoint Presentation File Slides
This is a bar graph ppt powerpoint presentation file slides. This is a three stage process. The stages in this process are product, sales in percentage, bar graph, growth, success.
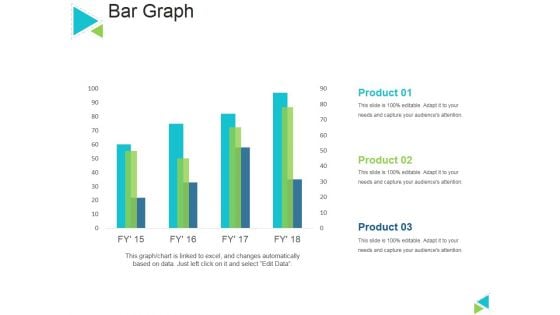
Bar Graph Ppt PowerPoint Presentation Outline Layout
This is a bar graph ppt powerpoint presentation outline layout. This is a four stage process. The stages in this process are sales in percentage, product, bar graph, business, marketing.
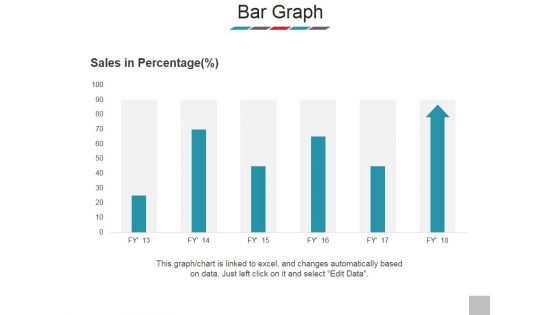
Bar Graph Ppt PowerPoint Presentation Model Clipart
This is a bar graph ppt powerpoint presentation model clipart. This is a six stage process. The stages in this process are sales in percentage, product, bar graph, business, marketing.
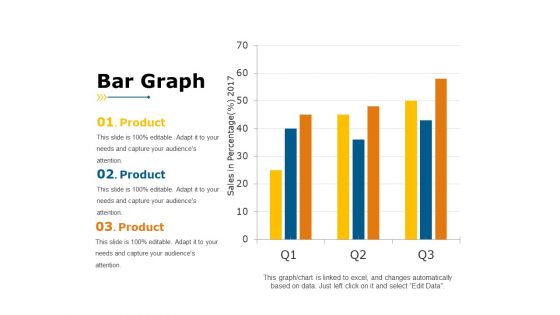
Bar Graph Ppt PowerPoint Presentation Portfolio Example
This is a bar graph ppt powerpoint presentation portfolio example. This is a three stage process. The stages in this process are sales in percentage, year, business, product, business, graph.
Dices On Financial Graph PowerPoint Icon F
Microsoft PowerPoint Template and Background with dices on financial graph Stitch together the fabric of your thoughts. Thread through with our Dices On Financial Graph PowerPoint Icon F.
Dices On Financial Graph PowerPoint Icon C
Microsoft PowerPoint Template and Background with dices on financial graph Prescribe changes with our Dices On Financial Graph PowerPoint Icon C. Download without worries with our money back guaranteee.
Dices On Financial Graph PowerPoint Icon Cc
Microsoft PowerPoint Template and Background with dices on financial graph Give your presentations a great look with our Dices On Financial Graph PowerPoint Icon Cc. You will be at the top of your game.
Dices On Financial Graph PowerPoint Icon R
Microsoft PowerPoint Template and Background with dices on financial graph Demonstrate your work ethic with our Dices On Financial Graph PowerPoint Icon R. Give credence to your impeccable reputation.
Dices On Financial Graph PowerPoint Icon S
Microsoft PowerPoint Template and Background with dices on financial graph Our Dices On Financial Graph PowerPoint Icon S project your erudite nature. They bring your depth of knowledge to the surface.
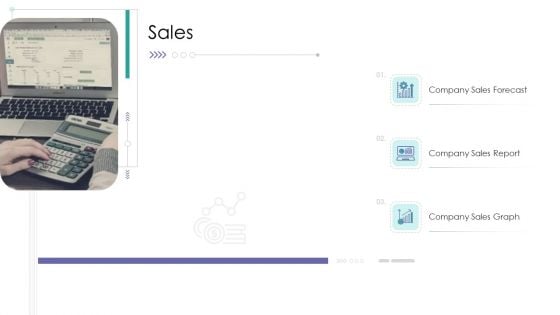
Corporate Governance Sales Template PDF
Presenting corporate governance sales template pdf to provide visual cues and insights. Share and navigate important information on three stages that need your due attention. This template can be used to pitch topics like company sales forecast, company sales report, company sales graph. In addtion, this PPT design contains high resolution images, graphics, etc, that are easily editable and available for immediate download.
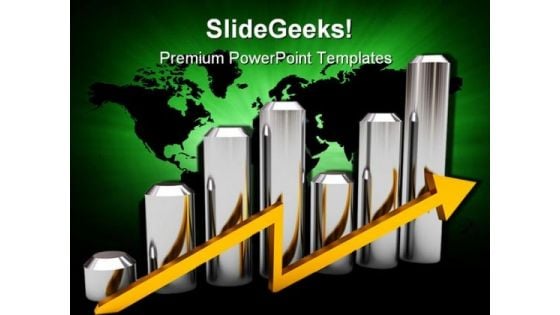
Bar Graph Business PowerPoint Template 0810
3d illustration of growing graph and arrow Close deals with our Bar Graph Business PowerPoint Template 0810. Download without worries with our money back guaranteee.
Business Data Graph PowerPoint Icon Cc
Increasing Bar Chart - Business Data Graph With World Map Lead your army with our Business Data Graph PowerPoint Icon Cc. You will come out on top.
Business Data Graph PowerPoint Icon S
Increasing Bar Chart - Business Data Graph With World Map Our Business Data Graph PowerPoint Icon S do not compromise. Excellence is always the aim.
Business Data Graph PowerPoint Icon C
Increasing Bar Chart - Business Data Graph With World Map Our Business Data Graph PowerPoint Icon C will be your best buy. The value of your thoughts will definitely appreciate.
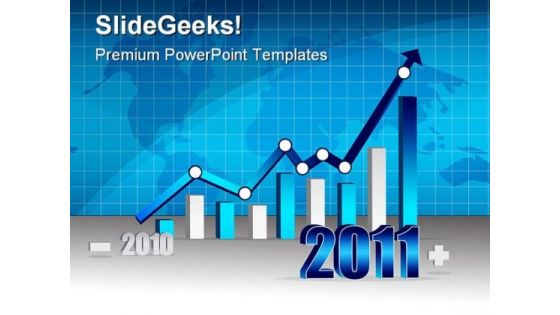
Graph 2011 Business PowerPoint Template 0810
2010 2011 Business graph with world background. Vector File also available Decorate your thoughts with our Graph 2011 Business PowerPoint Template 0810. Take full advantage of their colourful appearance.

Graph Chart Business PowerPoint Template 0810
illustration composed by charts word map and globe Win trust with our Graph Chart Business PowerPoint Template 0810. You will come out on top.
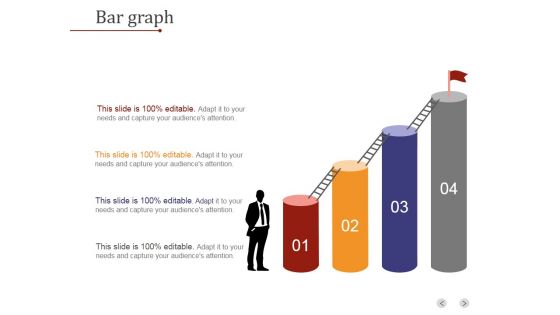
Bar Graph Ppt PowerPoint Presentation Tips
This is a bar graph ppt powerpoint presentation tips. This is a four stage process. The stages in this process are business, strategy, analysis, success, growth strategy, stair.
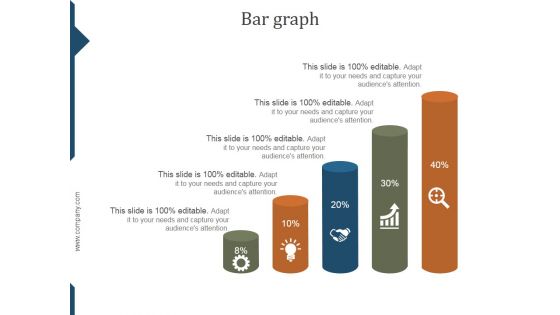
Bar Graph Ppt PowerPoint Presentation Deck
This is a bar graph ppt powerpoint presentation deck. This is a five stage process. The stages in this process are percentage, process, strategy, success, marketing.
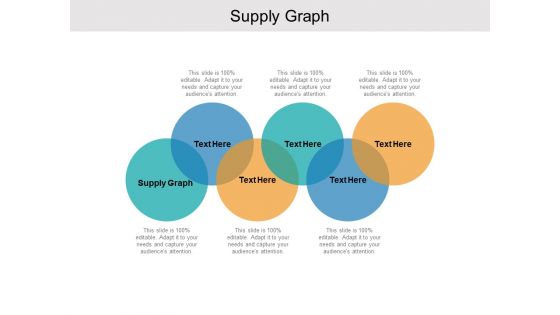
Supply Graph Ppt PowerPoint Presentation Show Cpb
Presenting this set of slides with name supply graph ppt powerpoint presentation show cpb. This is an editable Powerpoint six stages graphic that deals with topics like supply graph to help convey your message better graphically. This product is a premium product available for immediate download and is 100 percent editable in Powerpoint. Download this now and use it in your presentations to impress your audience.
Colorful Graph Money Business PowerPoint Templates And PowerPoint Themes 0512
Microsoft Powerpoint Templates and Background with color graph-These templates can be used for presentations relating to-Color graph, business, shapes, success, finance, sales-Colorful Graph Money Business PowerPoint Templates And PowerPoint Themes 0512 Regain control with our Colorful Graph Money Business PowerPoint Templates And PowerPoint Themes 0512. Download without worries with our money back guaranteee.
Colorful Graph Profit Money PowerPoint Templates And PowerPoint Themes 0512
Microsoft Powerpoint Templates and Background with color graph-These templates can be used for presentations relating to-Color graph, business, shapes, success, finance, sales-Colorful Graph Profit Money PowerPoint Templates And PowerPoint Themes 0512 Facilitate change with our Colorful Graph Profit Money PowerPoint Templates And PowerPoint Themes 0512. Gain audience acceptance faster.
Colorful Graph Success PowerPoint Templates And PowerPoint Themes 0512
Microsoft Powerpoint Templates and Background with color graph-These templates can be used for presentations relating to-Color graph, business, shapes, success, finance, sales-Colorful Graph Success PowerPoint Templates And PowerPoint Themes 0512 Get endorsed by your boss with our Colorful Graph Success PowerPoint Templates And PowerPoint Themes 0512. Dont pass up this opportunity to shine.
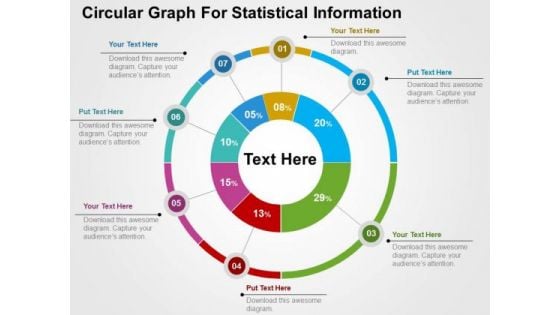
Circular Graph For Statistical Information PowerPoint Template
Visually support your presentation with our above template showing circular graph. This slide has been professionally designed to present statistical information. This template offers an excellent background to build impressive presentation.
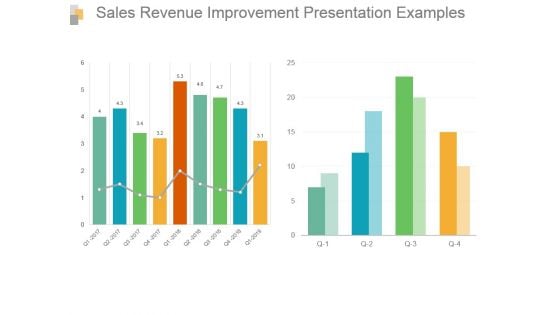
Sales Revenue Improvement Presentation Examples
This is a sales revenue improvement presentation examples. This is a two stage process. The stages in this process are bar graph, growth, sales, data, analysis.
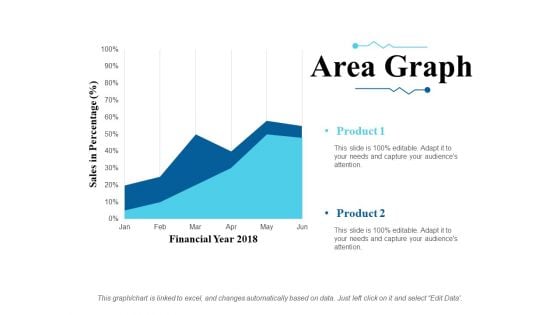
Area Graph Ppt PowerPoint Presentation Slides Ideas
This is a area graph ppt powerpoint presentation slides ideas. This is a two stage process. The stages in this process are sales in percentage, financial year, product.
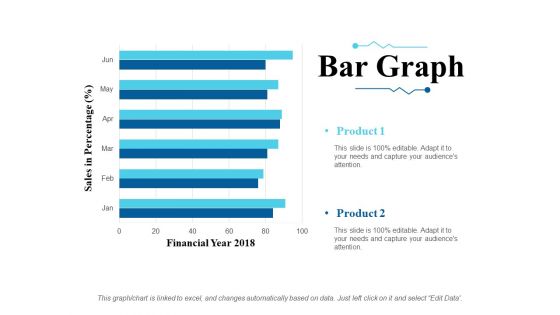
Bar Graph Ppt PowerPoint Presentation Inspiration Slides
This is a bar graph ppt powerpoint presentation inspiration slides. This is a six stage process. The stages in this process are sales in percentage, financial year, product.
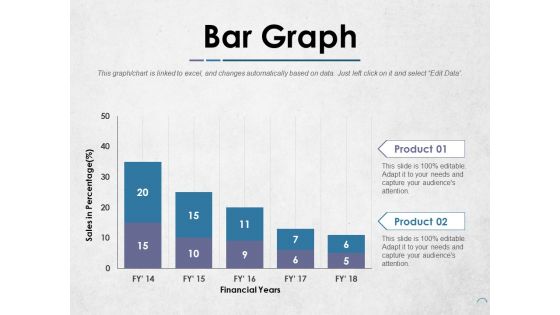
Bar Graph Ppt PowerPoint Presentation Infographics Templates
This is a bar graph ppt powerpoint presentation infographics templates. This is a two stage process. The stages in this process are product, financial years, sales in percentage.
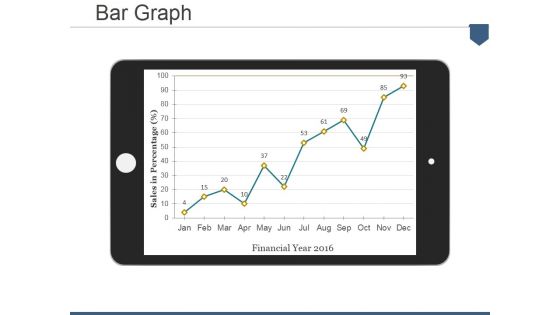
Bar Graph Ppt PowerPoint Presentation Pictures Display
This is a bar graph ppt powerpoint presentation pictures display. This is a one stage process. The stages in this process are sales in percentage, financial year.
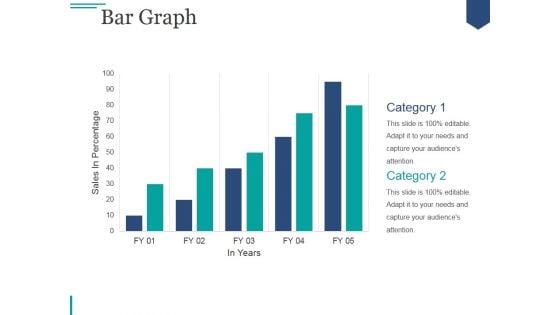
Bar Graph Ppt PowerPoint Presentation Slides Format
This is a bar graph ppt powerpoint presentation slides format. This is a two stage process. The stages in this process are business, marketing, growth, planning, sales plan.

Bar Graph Ppt PowerPoint Presentation Gallery Inspiration
This is a bar graph ppt powerpoint presentation gallery inspiration. This is a three stage process. The stages in this process are product, sales in percentage, finance, success.
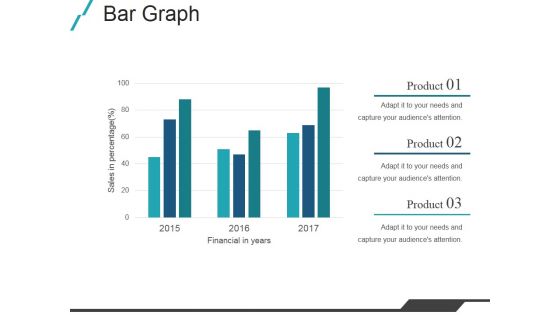
Bar Graph Ppt PowerPoint Presentation Slides Deck
This is a bar graph ppt powerpoint presentation slides deck. This is a three stage process. The stages in this process are financial in years, product, sales in percentage.
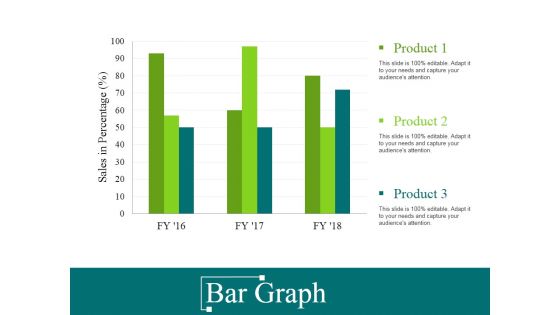
Bar Graph Ppt PowerPoint Presentation Gallery Grid
This is a bar graph ppt powerpoint presentation gallery grid. This is a three stage process. The stages in this process are sales in percentage, product, finance, business, marketing.
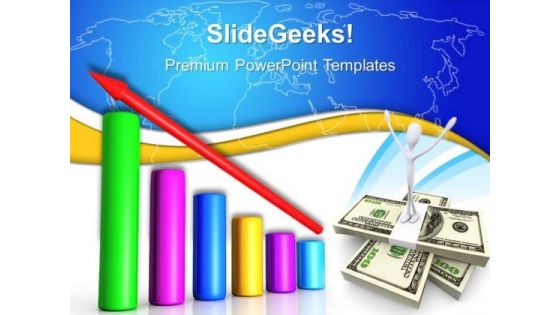
Graph Profit Finance PowerPoint Templates And PowerPoint Themes 0512
Microsoft Powerpoint Templates and Background with business growth-Graph Profit Finance PowerPoint Templates And PowerPoint Themes 0512-These PowerPoint designs and slide layouts can be used for themes relating to -Graph profit finance, business, finance, sales, shape, success Catch the fancy of your audience. Our Graph Profit Finance PowerPoint Templates And PowerPoint Themes 0512 make a delightful display.
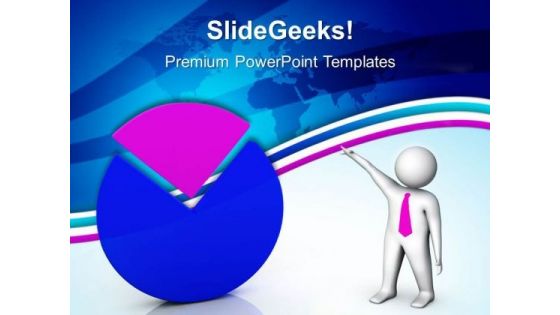
Pie Graph Business PowerPoint Templates And PowerPoint Themes 0512
Microsoft Powerpoint Templates and Background with pie graph-Pie Graph Business PowerPoint Templates And PowerPoint Themes 0512-These PowerPoint designs and slide layouts can be used for themes relating to -Pie graph, background, business, marketing, sales, success Attain success with our Pie Graph Business PowerPoint Templates And PowerPoint Themes 0512. You will come out on top.
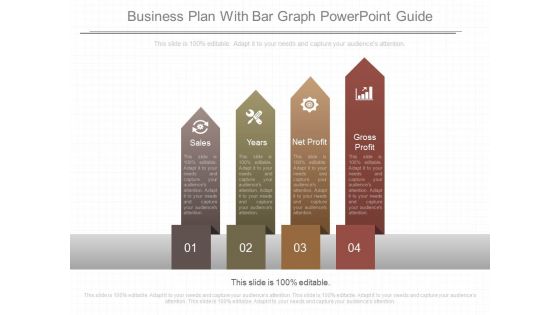
Business Plan With Bar Graph Powerpoint Guide
This is a business plan with bar graph powerpoint guide. This is a four stage process. The stages in this process are sales, years, net profit, gross profit.
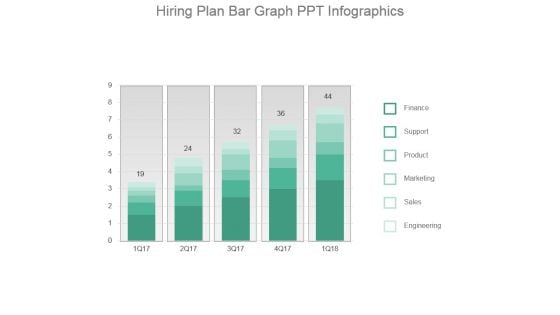
Hiring Plan Bar Graph Ppt Infographics
This is a hiring plan bar graph ppt infographics. This is a five stage process. The stages in this process are finance, support, product, marketing, sales, engineering.
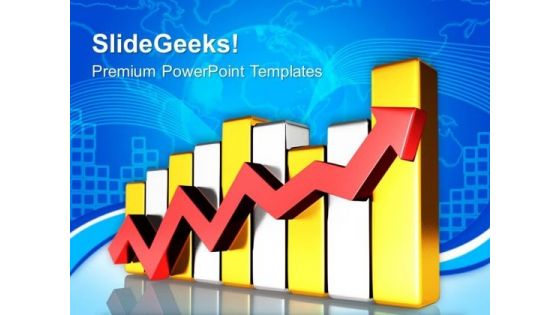
Arrow Bar Graph Business PowerPoint Templates And PowerPoint Themes 0612
Arrow Bar Graph Business PowerPoint Templates And PowerPoint Themes Business PPT Templates-Business success, finance, sales, success, business, arrows Get fashionable with our Arrow Bar Graph Business PowerPoint Templates And PowerPoint Themes 0612. Whatever you display will be in.
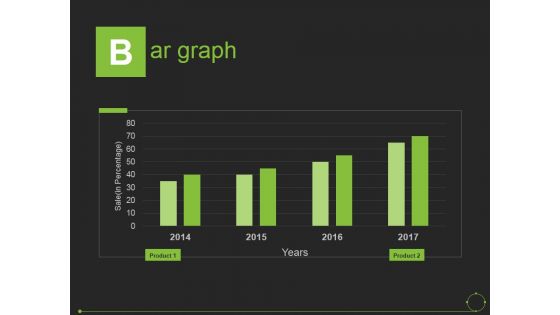
Bar Graph Ppt PowerPoint Presentation Portfolio Background
This is a bar graph ppt powerpoint presentation portfolio background. This is a four stage process. The stages in this process are sale, years, product.
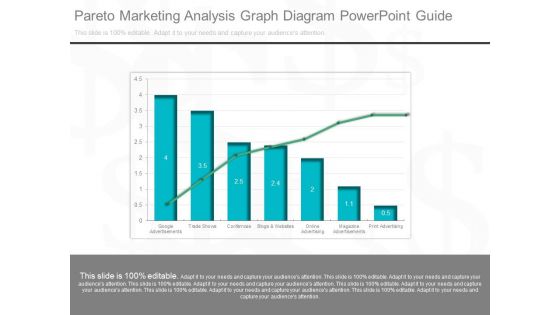
Pareto Marketing Analysis Graph Diagram Powerpoint Guide
This is a pareto marketing analysis graph diagram powerpoint guide. This is a seven stage process. The stages in this process are google advertisements, trade shows, conferences, blog and websites, online advertising, magazine advertisements, print advertising.
Bar Graph With Five Icons Powerpoint Slides
This PowerPoint slide contains diagram bar graph with icons. This PPT slide helps to exhibit concepts of financial deal and planning. Use this business slide to make impressive presentations.
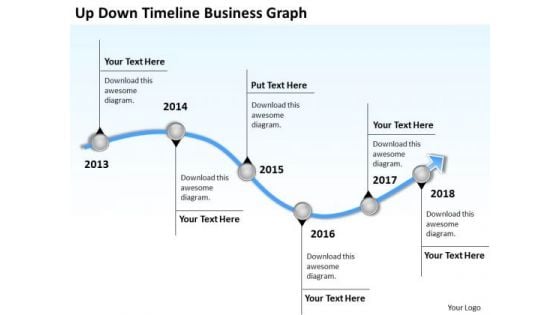
Business Analysis Diagrams PowerPoint Presentations Graph Templates
We present our business analysis diagrams powerpoint presentations graph templates.Download and present our Curves and Lines PowerPoint Templates because Your audience will believe you are the cats whiskers. Present our Business PowerPoint Templates because Our PowerPoint Templates and Slides will effectively help you save your valuable time. They are readymade to fit into any presentation structure. Present our Business PowerPoint Templates because Our PowerPoint Templates and Slides will give good value for money. They also have respect for the value of your time. Use our Arrows PowerPoint Templates because It will get your audience in sync. Present our Process and Flows PowerPoint Templates because It can Conjure up grand ideas with our magical PowerPoint Templates and Slides. Leave everyone awestruck by the end of your presentation.Use these PowerPoint slides for presentations relating to 3d, account, accounting, annual, balance, business, chart, commerce, crisis, data,earnings, economics, economy, exchange, figures, finance, financial, graph,graphic, growth, illustration, index, information, investment, list, line,management,market, marketing, money, monitoring, numbers, office, paperwork, plan, price,printout, report, research, sale, statistical, statistics, stock, success, tax, trade,work. The prominent colors used in the PowerPoint template are Blue light, Gray, White. Examine the causes with our Business Analysis Diagrams PowerPoint Presentations Graph Templates. Let everyone know what's behind it all.
Business Deal Graph Icons Illustration Powerpoint Template
This PowerPoint template has been designed with infographic layout. Download this diagram slide to display concepts of business deal, strategy and success. You can edit text, color, shade and style of this diagram as per you need.

 Home
Home