Sales Graph
Financial Projection Graph Template 1 Ppt PowerPoint Presentation Icon Summary
This is a financial projection graph template 1 ppt powerpoint presentation icon summary. This is a three stage process. The stages in this process are annual sales forecast, years, business, marketing, management.
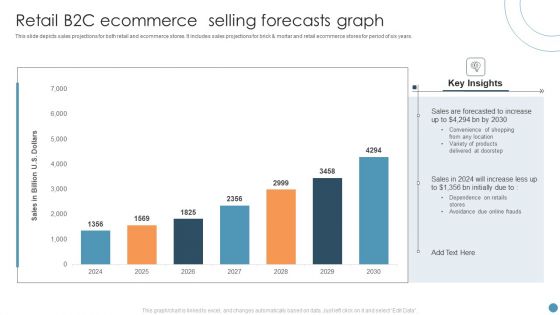
Retail B2C Ecommerce Selling Forecasts Graph Portrait PDF
This slide depicts sales projections for both retail and ecommerce stores. It includes sales projections for brick and mortar and retail ecommerce stores for period of six years. Pitch your topic with ease and precision using this Retail B2C Ecommerce Selling Forecasts Graph Portrait PDF. This layout presents information on Retail B2C Ecommerce, Selling Forecasts Graph. It is also available for immediate download and adjustment. So, changes can be made in the color, design, graphics or any other component to create a unique layout.
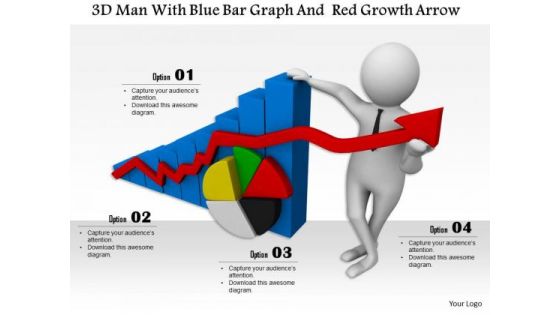
3d Man With Blue Bar Graph And Red Growth Arrow
This Power Point diagram has been designed with graphic of 3d man and business graphs. This conceptual image can be used to displays business progress and growth. Use this editable slide for business and sales growth related presentations.

Pie Graph Layer Of Marketing Expenditure Themes PDF
Pitch your topic with ease and precision using this pie graph layer of marketing expenditure themes pdf. This layout presents information on online advertising, trade shows, sales training, catalogs and brochures. It is also available for immediate download and adjustment. So, changes can be made in the color, design, graphics or any other component to create a unique layout.
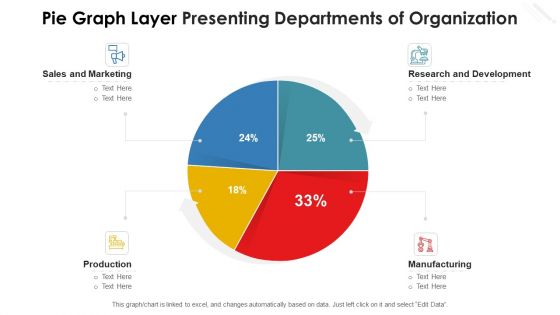
Pie Graph Layer Presenting Departments Of Organization Infographics PDF
Showcasing this set of slides titled pie graph layer presenting departments of organization infographics pdf. The topics addressed in these templates are sales and marketing, production, manufacturing, research and development. All the content presented in this PPT design is completely editable. Download it and make adjustments in color, background, font etc. as per your unique business setting.
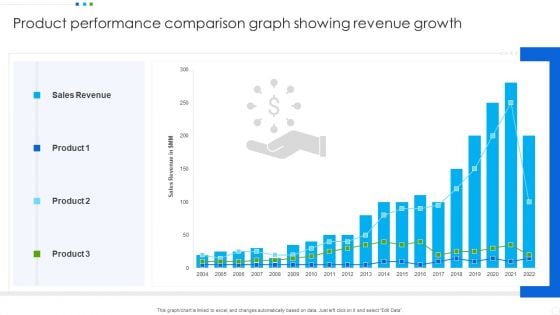
Product Performance Comparison Graph Showing Revenue Growth Portrait PDF
Showcasing this set of slides titled Product Performance Comparison Graph Showing Revenue Growth Portrait PDF. The topics addressed in these templates are Sales Revenue, Product. All the content presented in this PPT design is completely editable. Download it and make adjustments in color, background, font etc. as per your unique business setting.
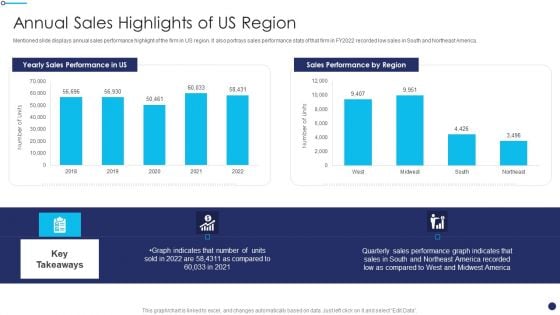
Effective Sales Technique For New Product Launch Annual Sales Highlights Of US Region Inspiration PDF
Mentioned slide displays annual sales performance highlight of the firm in US region. It also portrays sales performance stats of that firm in FY2022 recorded low sales in South and Northeast America. Deliver an awe inspiring pitch with this creative Effective Sales Technique For New Product Launch Annual Sales Highlights Of US Region Inspiration PDF bundle. Topics like Sales Performance, Graph Indicates, Performance Graph can be discussed with this completely editable template. It is available for immediate download depending on the needs and requirements of the user.

Brand Revenue Comparative Analysis Graph With Key Insights Inspiration PDF
This slide illustrates graphical representation of sales revenue of three brands. It includes insights and facts and figures of these brands.Showcasing this set of slides titled Brand Revenue Comparative Analysis Graph With Key Insights Inspiration PDF. The topics addressed in these templates are Brand Revenue Comparative Analysis Graph With Key Insights. All the content presented in this PPT design is completely editable. Download it and make adjustments in color, background, font etc. as per your unique business setting.
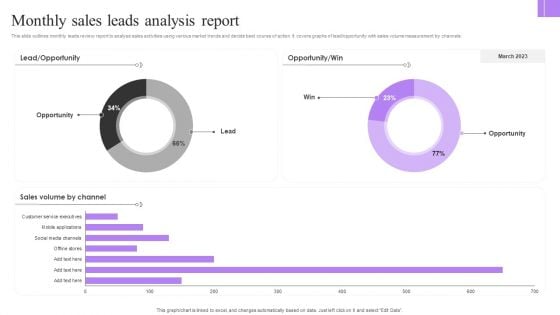
Monthly Sales Leads Analysis Report Clipart PDF
This slide outlines monthly leads review report to analyse sales activities using various market trends and decide best course of action. It covers graphs of lead opportunity with sales volume measurement by channels. Showcasing this set of slides titled Monthly Sales Leads Analysis Report Clipart PDF. The topics addressed in these templates are Lead, Opportunity, Win. All the content presented in this PPT design is completely editable. Download it and make adjustments in color, background, font etc. as per your unique business setting.
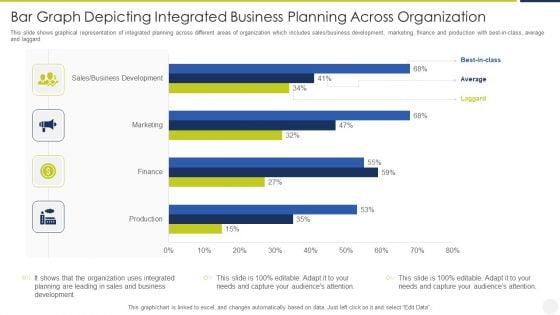
Bar Graph Depicting Integrated Business Planning Across Organization Designs PDF
This slide shows graphical representation of integrated planning across different areas of organization which includes sales or business development, marketing, finance and production with best in class, average and laggard Showcasing this set of slides titled bar graph depicting integrated business planning across organization designs pdf. The topics addressed in these templates are bar graph depicting integrated business planning across organization. All the content presented in this PPT design is completely editable. Download it and make adjustments in color, background, font etc. as per your unique business setting.
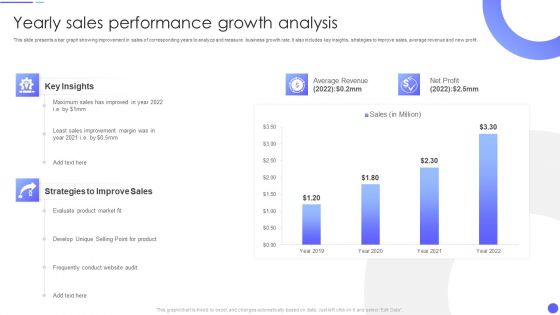
Yearly Sales Performance Growth Analysis Rules PDF
This slide presents a bar graph showing improvement in sales of corresponding years to analyze and measure business growth rate. It also includes key insights, strategies to improve sales, average revenue and new profit.Pitch your topic with ease and precision using this Yearly Sales Performance Growth Analysis Rules PDF This layout presents information on Average Revenue, Strategies To Improve, Sales Improvement It is also available for immediate download and adjustment. So, changes can be made in the color, design, graphics or any other component to create a unique layout.

Effective Sales Plan For New Product Introduction In Market Annual Sales Highlights Template PDF
Mentioned slide displays annual sales performance highlight of the firm in US region. It also portrays sales performance stats of that firm in FY2020 recorded low sales in South and Northeast America. Deliver an awe inspiring pitch with this creative Effective Sales Plan For New Product Introduction In Market Annual Sales Highlights Template PDF bundle. Topics like Sales Performance, Graph Indicates, Key Takeaways can be discussed with this completely editable template. It is available for immediate download depending on the needs and requirements of the user.

Website Graph Concept Communication PowerPoint Templates And PowerPoint Themes 1112
We present our Website Graph Concept Communication PowerPoint Templates And PowerPoint Themes 1112.Use our Success PowerPoint Templates because, You have it all down to a nicety, slice by slice, layer by layer. Use our Marketing PowerPoint Templates because, Illustrate these thoughts with this slide. Use our Design PowerPoint Templates because, Business 3D Circular Puzzle:- Your business and plans for its growth consist of processes that are highly co-related. Use our Business PowerPoint Templates because,Marketing Strategy Business Template:- Maximising sales of your product is the intended destination. Use our Symbol PowerPoint Templates because, Emphasise the benefits of healthy food habits and lifestyles in respect of vital organs of the human anatomy.Use these PowerPoint slides for presentations relating to Website graph concept business design success marketing symbol . The prominent colors used in the PowerPoint template are Blue, Red, Green Our Website Graph Concept Communication PowerPoint Templates And PowerPoint Themes 1112 will boost even a faint hope. They build up the belief in positive action.
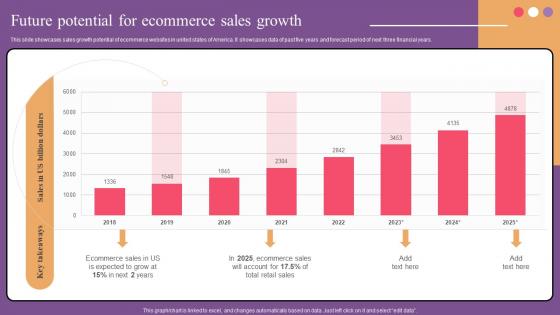
Future Potential For Ecommerce Sales Website Optimization To Improve Product Sale Clipart Pdf
This slide showcases sales growth potential of ecommerce websites in united states of America. It showcases data of past five years and forecast period of next three financial years. Crafting an eye catching presentation has never been more straightforward. Let your presentation shine with this tasteful yet straightforward Future Potential For Ecommerce Sales Website Optimization To Improve Product Sale Clipart Pdf template. It offers a minimalistic and classy look that is great for making a statement. The colors have been employed intelligently to add a bit of playfulness while still remaining professional. Construct the ideal Future Potential For Ecommerce Sales Website Optimization To Improve Product Sale Clipart Pdf that effortlessly grabs the attention of your audience Begin now and be certain to wow your customers This slide showcases sales growth potential of ecommerce websites in united states of America. It showcases data of past five years and forecast period of next three financial years.
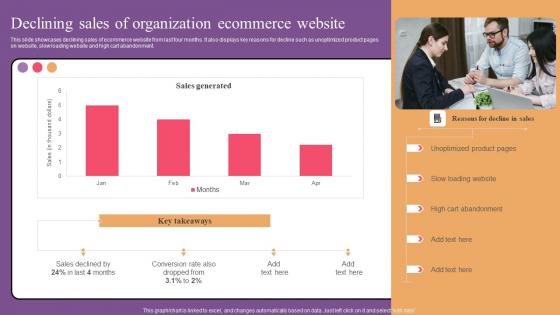
Declining Sales Of Organization Website Optimization To Improve Product Sale Introduction Pdf
This slide showcases declining sales of ecommerce website from last four months. It also displays key reasons for decline such as unoptimized product pages on website, slow loading website and high cart abandonment. If your project calls for a presentation, then Slidegeeks is your go to partner because we have professionally designed, easy to edit templates that are perfect for any presentation. After downloading, you can easily edit Declining Sales Of Organization Website Optimization To Improve Product Sale Introduction Pdf and make the changes accordingly. You can rearrange slides or fill them with different images. Check out all the handy templates This slide showcases declining sales of ecommerce website from last four months. It also displays key reasons for decline such as unoptimized product pages on website, slow loading website and high cart abandonment.
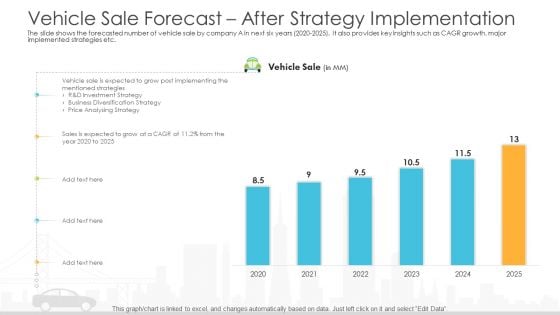
Vehicle Sales Plunge In An Automobile Firm Vehicle Sale Forecast After Strategy Implementation Themes PDF
The slide shows the forecasted number of vehicle sale by company A in next six years 2020 2025. It also provides key insights such as CAGR growth, major implemented strategies etc. Deliver an awe inspiring pitch with this creative vehicle sales plunge in an automobile firm vehicle sale forecast after strategy implementation themes pdf bundle. Topics like vehicle sale forecast after strategy implementation can be discussed with this completely editable template. It is available for immediate download depending on the needs and requirements of the user.

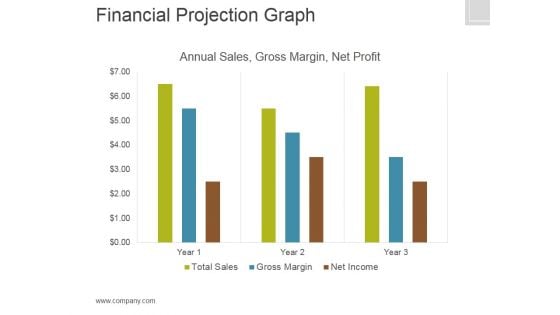
Financial Projection Graph Template 1 Ppt PowerPoint Presentation Guide
This is a financial projection graph template 1 ppt powerpoint presentation guide. This is a three stage process. The stages in this process are annual sales, gross margin, net profit.
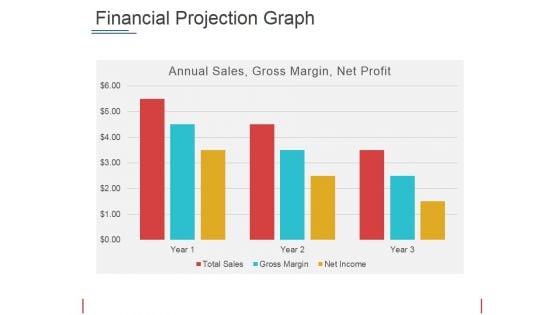
Financial Projection Graph Template 2 Ppt PowerPoint Presentation Show Picture
This is a financial projection graph template 2 ppt powerpoint presentation show picture. This is a three stage process. The stages in this process are annual sales, gross margin, net profit, years.
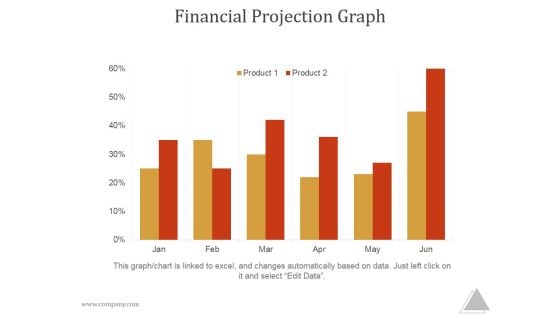
Financial Projection Graph Template 2 Ppt PowerPoint Presentation Graphics
This is a financial projection graph template 2 ppt powerpoint presentation graphics. This is a three stage process. The stages in this process are annual sales, gross margin, net profit, finance.
Financial Projection Graph Slide2 Ppt PowerPoint Presentation Themes
This is a financial projection graph slide2 ppt powerpoint presentation themes. This is a five stage process. The stages in this process are year, total sales, gross, margin, net income
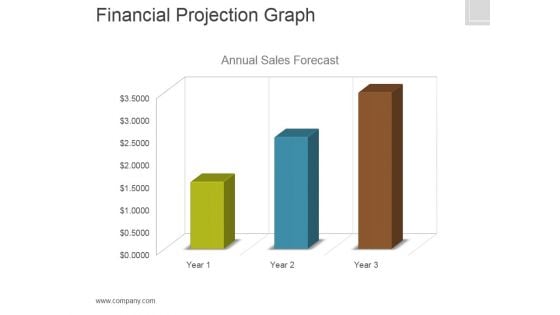
Financial Projection Graph Template 1 Ppt PowerPoint Presentation Clipart
This is a financial projection graph template 1 ppt powerpoint presentation clipart. This is a three stage process. The stages in this process are annual, sales, forecast, finance, marketing.
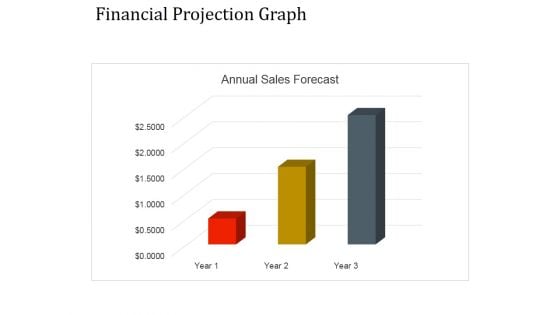
Financial Projection Graph Template 1 Ppt PowerPoint Presentation Graphics
This is a financial projection graph template 1 ppt powerpoint presentation graphics. This is a three stage process. The stages in this process are annual sales, business, management, marketing, strategy.
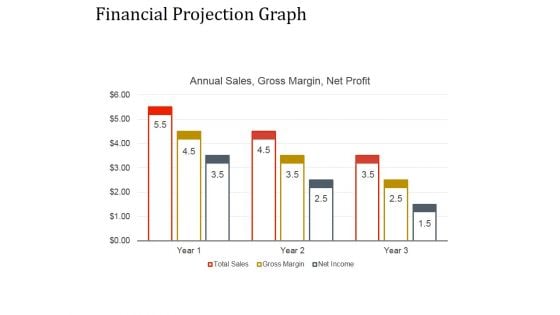
Financial Projection Graph Template 2 Ppt PowerPoint Presentation Ideas
This is a financial projection graph template 2 ppt powerpoint presentation ideas. This is a nine stage process. The stages in this process are annual sales, business, management, marketing, strategy.
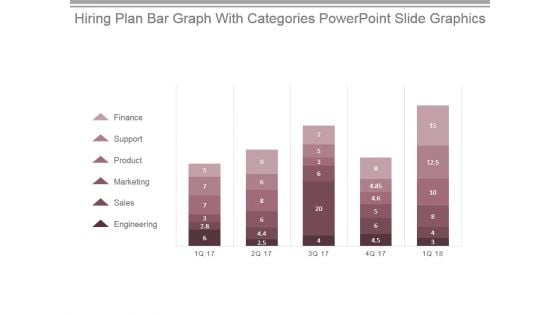
Hiring Plan Bar Graph With Categories Powerpoint Slide Graphics
This is a hiring plan bar graph with categories powerpoint slide graphics. This is a five stage process. The stages in this process are finance, support, product, marketing, sales, engineering.
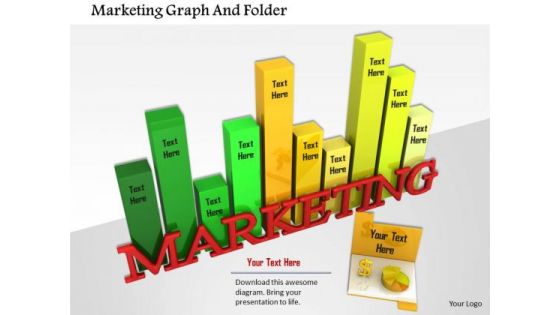
Stock Photo Marketing Graph And Folder PowerPoint Slide
Define your ideas in a unique and inspiring manner using this image which contains a graphic of colorful bar graph. This pre-designed and appealing bar graph offers an optimized possibility to illustrate your marketing strategy. Use this Image in presentations relating to business and sales.

Income Graph Business PowerPoint Templates And PowerPoint Themes 0712
Income Graph Business PowerPoint Templates And PowerPoint Themes 0712-Microsoft Powerpoint Templates and Background with bar graph Drum up a fervour with our Income Graph Business PowerPoint Templates And PowerPoint Themes 0712. You will come out on top.

Business Graph Metaphor PowerPoint Templates And PowerPoint Themes 1012
Business Graph Metaphor PowerPoint Templates And PowerPoint Themes 1012-Microsoft Powerpoint Templates and Background with business graph-Business Graph Metaphor PowerPoint Templates And PowerPoint Themes 1012-This PowerPoint template can be used for presentations relating to-Business graph, money, finance, signs, arrows, success Play your cards well with our Business Graph Metaphor PowerPoint Templates And PowerPoint Themes 1012. Give your thoughts a good deal.
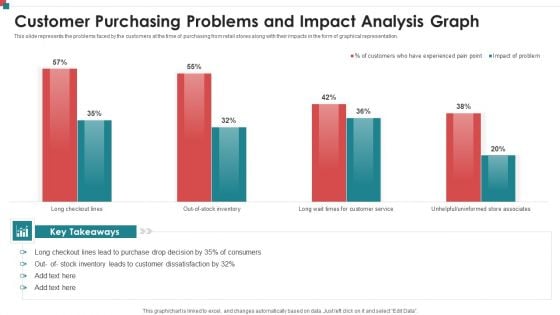
Customer Purchasing Problems And Impact Analysis Graph Inspiration PDF
This slide represents the problems faced by the customers at the time of purchasing from retail stores along with their impacts in the form of graphical representation. Showcasing this set of slides titled Customer Purchasing Problems And Impact Analysis Graph Inspiration PDF. The topics addressed in these templates are Customer Purchasing Problems And Impact Analysis Graph. All the content presented in this PPT design is completely editable. Download it and make adjustments in color, background, font etc. as per your unique business setting.
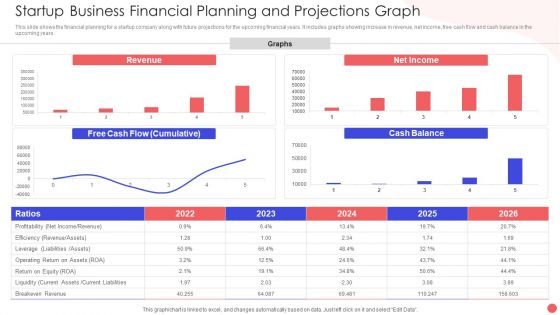
Startup Business Financial Planning And Projections Graph Slides PDF
This slide shows the financial planning for a startup company along with future projections for the upcoming financial years. It includes graphs showing increase in revenue, net income, free cash flow and cash balance in the upcoming years. Pitch your topic with ease and precision using this Startup Business Financial Planning And Projections Graph Slides PDF. This layout presents information on Revenue Graphs Operating, Free Cash Flow, Net Income Ration. It is also available for immediate download and adjustment. So, changes can be made in the color, design, graphics or any other component to create a unique layout.
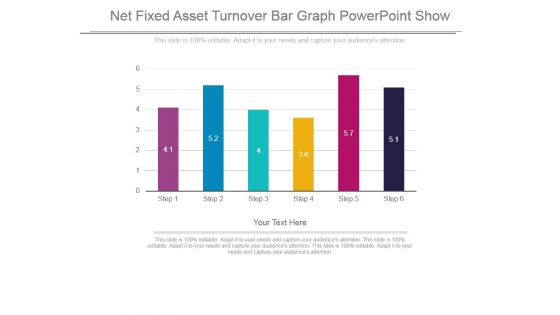
Net Fixed Asset Turnover Bar Graph Powerpoint Show
This is a net fixed asset turnover bar graph powerpoint show. This is a six stage process. The stages in this process are bar graph, presentation, strategy, business, management.
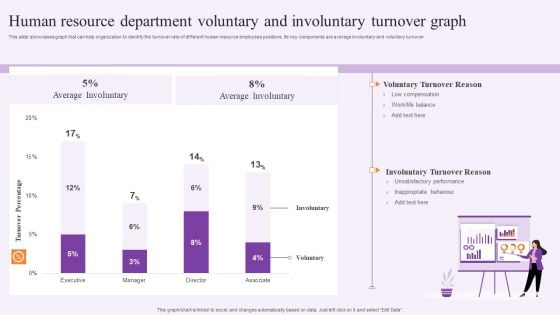
Human Resource Department Voluntary And Involuntary Turnover Graph Summary PDF
This slide showcases graph that can help organization to identify the turnover rate of different human resource employees positions. Its key components are average involuntary and voluntary turnover. Pitch your topic with ease and precision using this Human Resource Department Voluntary And Involuntary Turnover Graph Summary PDF. This layout presents information on Executive, Voluntary Turnover Reason, Average Involuntary. It is also available for immediate download and adjustment. So, changes can be made in the color, design, graphics or any other component to create a unique layout.
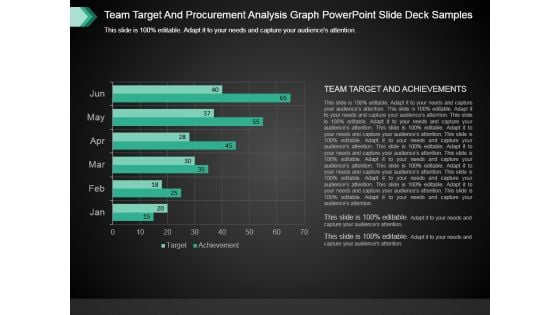
Team Target And Procurement Analysis Graph Powerpoint Slide Deck Samples
This is a team target and procurement analysis graph powerpoint slide deck samples. This is a six stage process. The stages in this process are graph chart, business, success, strategy, management.
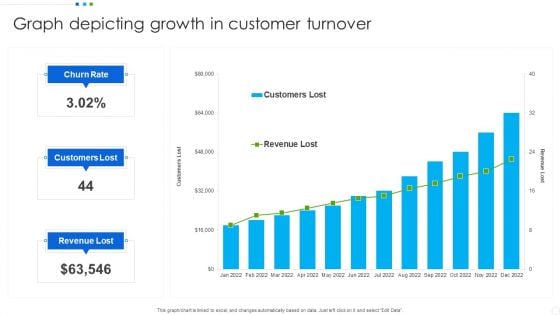
Graph Depicting Growth In Customer Turnover Infographics PDF
Showcasing this set of slides titled Graph Depicting Growth In Customer Turnover Infographics PDF. The topics addressed in these templates are Revenue Lost, Customers Lost, Churn Rate. All the content presented in this PPT design is completely editable. Download it and make adjustments in color, background, font etc. as per your unique business setting.
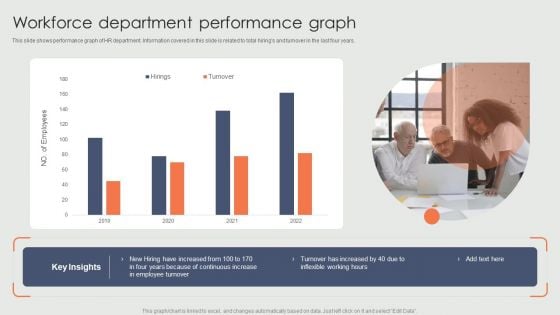
Workforce Department Performance Graph Ppt Model Graphics Pictures PDF
This slide shows performance graph of HR department. Information covered in this slide is related to total hirings and turnover in the last four years. Pitch your topic with ease and precision using this Workforce Department Performance Graph Ppt Model Graphics Pictures PDF. This layout presents information on New Hiring, Continuous Increase, Employee Turnover, 2019 To 2022. It is also available for immediate download and adjustment. So, changes can be made in the color, design, graphics or any other component to create a unique layout.
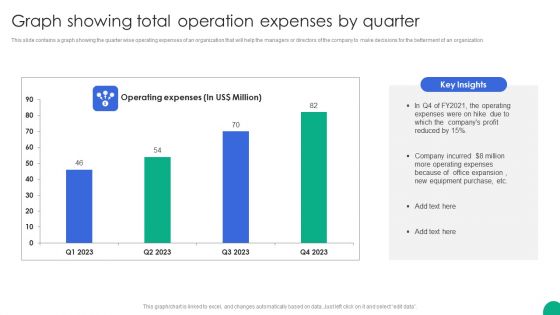
Graph Showing Total Operation Expenses By Quarter Themes PDF
This slide contains a graph showing the quarter wise operating expenses of an organization that will help the managers or directors of the company to make decisions for the betterment of an organization.Pitch your topic with ease and precision using this Graph Showing Total Operation Expenses By Quarter Themes PDF. This layout presents information on Operating Expenses, Equipment Purchase, Office Expansion. It is also available for immediate download and adjustment. So, changes can be made in the color, design, graphics or any other component to create a unique layout.
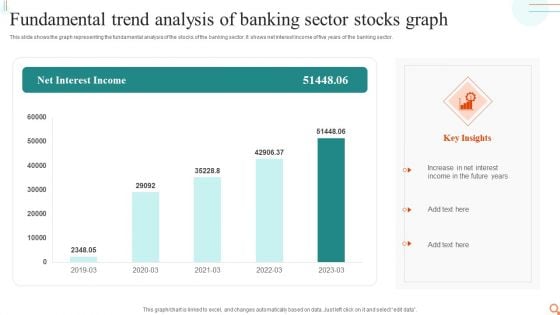
Fundamental Trend Analysis Of Banking Sector Stocks Graph Mockup PDF
This slide shows the graph representing the fundamental analysis of the stocks of the banking sector. It shows net interest income of five years of the banking sector.Pitch your topic with ease and precision using this Fundamental Trend Analysis Of Banking Sector Stocks Graph Mockup PDF. This layout presents information on Increase Interest, Income Future, Interest Income. It is also available for immediate download and adjustment. So, changes can be made in the color, design, graphics or any other component to create a unique layout.
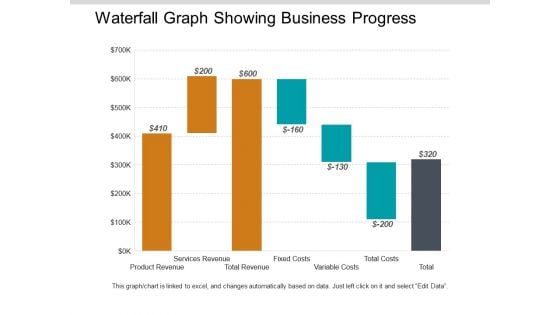
Waterfall Graph Showing Business Progress Ppt PowerPoint Presentation Styles Model
This is a waterfall graph showing business progress ppt powerpoint presentation styles model. This is a three stage process. The stages in this process are profit and loss, balance sheet, income statement, benefit and loss.
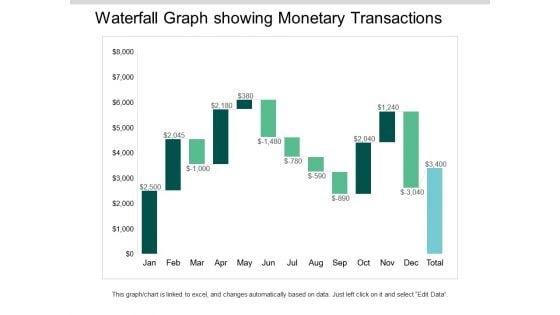
Waterfall Graph Showing Monetary Transactions Ppt PowerPoint Presentation Ideas Visuals
This is a waterfall graph showing monetary transactions ppt powerpoint presentation ideas visuals. This is a three stage process. The stages in this process are profit and loss, balance sheet, income statement, benefit and loss.
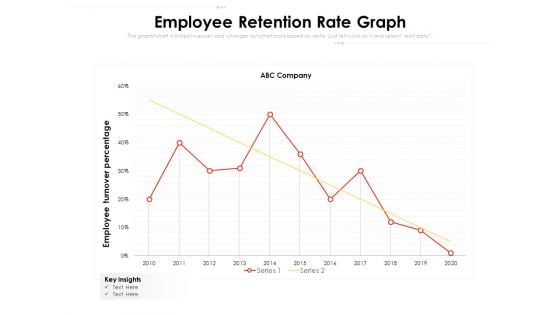
Employee Retention Rate Graph Ppt PowerPoint Presentation Pictures Portrait PDF
Presenting this set of slides with name employee retention rate graph ppt powerpoint presentation pictures portrait pdf. The topics discussed in these slides are key insights, 2010 to 2020, employee turnover percentage. This is a completely editable PowerPoint presentation and is available for immediate download. Download now and impress your audience.
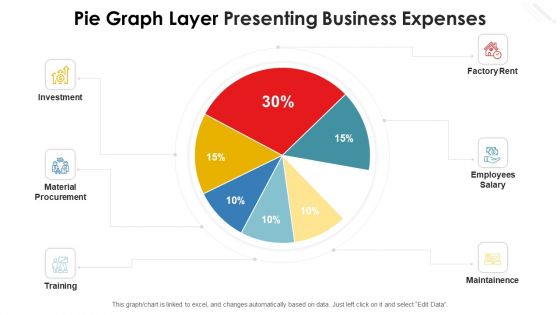
Pie Graph Layer Presenting Business Expenses Topics PDF
Pitch your topic with ease and precision using this pie graph layer presenting business expenses topics pdf. This layout presents information on investment, material procurement, training, employees salary, factory rent. It is also available for immediate download and adjustment. So, changes can be made in the color, design, graphics or any other component to create a unique layout.
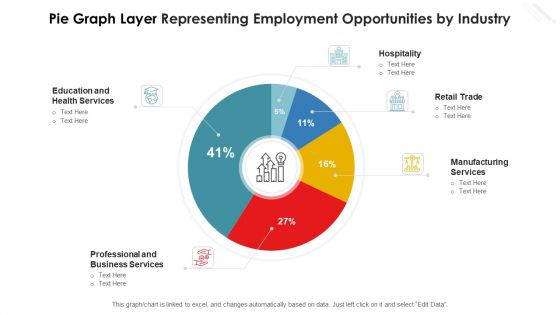
Pie Graph Layer Representing Employment Opportunities By Industry Ideas PDF
Showcasing this set of slides titled pie graph layer representing employment opportunities by industry ideas pdf. The topics addressed in these templates are hospitality, retail trade, manufacturing services, education and health services, professional and business services. All the content presented in this PPT design is completely editable. Download it and make adjustments in color, background, font etc. as per your unique business setting.
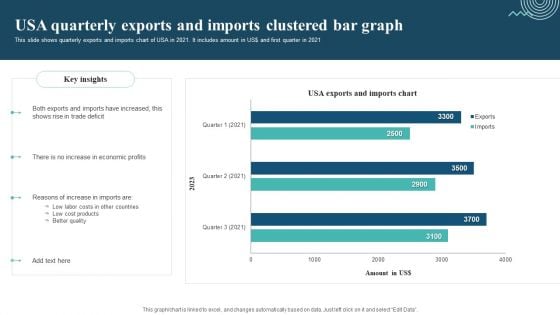
Usa Quarterly Exports And Imports Clustered Bar Graph Designs PDF
This slide shows quarterly exports and imports chart of USA in 2021. It includes amount in US dollar and first quarter in 2021. Pitch your topic with ease and precision using this Usa Quarterly Exports And Imports Clustered Bar Graph Designs PDF. This layout presents information on Exports And Imports, Trade Deficit, Economic Profits. It is also available for immediate download and adjustment. So, changes can be made in the color, design, graphics or any other component to create a unique layout.
Gross Revenue Margin Comparison Graph Icon Clipart PDF
Persuade your audience using this Gross Revenue Margin Comparison Graph Icon Clipart PDF. This PPT design covers three stages, thus making it a great tool to use. It also caters to a variety of topics including Gross Revenue Margin, Comparison Graph Icon. Download this PPT design now to present a convincing pitch that not only emphasizes the topic but also showcases your presentation skills.
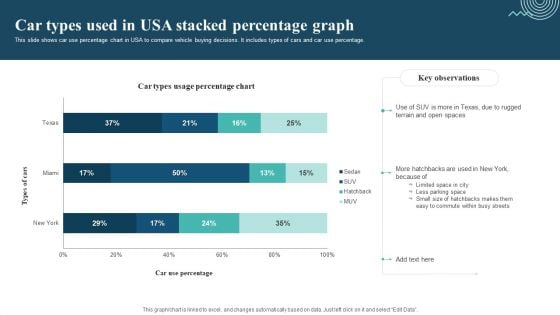
Car Types Used In Usa Stacked Percentage Graph Sample PDF
This slide shows car use percentage chart in USA to compare vehicle buying decisions. It includes types of cars and car use percentage. Pitch your topic with ease and precision using this Car Types Used In Usa Stacked Percentage Graph Sample PDF. This layout presents information on Limited Space In City, Less Parking Space, Easy To Commute. It is also available for immediate download and adjustment. So, changes can be made in the color, design, graphics or any other component to create a unique layout.
Bank Bar Graph Business Deal Result Analysis Ppt Slides Graphics
This power point icon slide has been designed with four different icons. Icons of bank, bar graph and business deal have been displayed in this slide. Use these icons in your presentations to add professional impact.
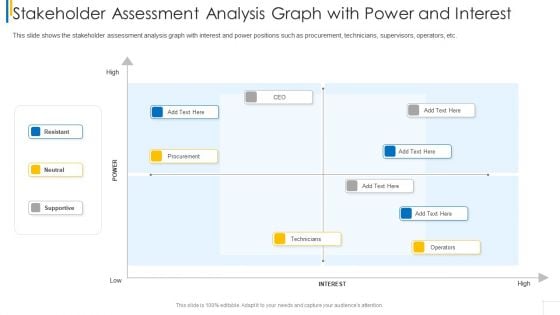
Stakeholder Assessment Analysis Graph With Power And Interest Ideas PDF
This slide shows the stakeholder assessment analysis graph with interest and power positions such as procurement, technicians, supervisors, operators, etc.Deliver an awe inspiring pitch with this creative stakeholder assessment analysis graph with power and interest ideas pdf bundle. Topics like resistant, neutral, supportive, procurement, technicians can be discussed with this completely editable template. It is available for immediate download depending on the needs and requirements of the user.
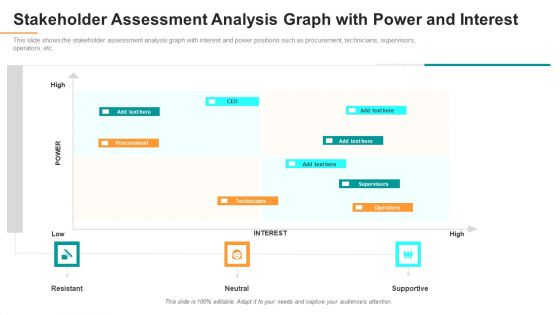
Stakeholder Assessment Analysis Graph With Power And Interest Introduction PDF
This slide shows the stakeholder assessment analysis graph with interest and power positions such as procurement, technicians, supervisors, operators, etc. Deliver and pitch your topic in the best possible manner with this stakeholder assessment analysis graph with power and interest introduction pdf. Use them to share invaluable insights on technicians, operators, interest and impress your audience. This template can be altered and modified as per your expectations. So, grab it now.
Keynesian Economics Graph Ppt PowerPoint Presentation Inspiration Example File Cpb
Presenting this set of slides with name keynesian economics graph ppt powerpoint presentation inspiration example file cpb. This is an editable Powerpoint four stages graphic that deals with topics like keynesian economics graph to help convey your message better graphically. This product is a premium product available for immediate download and is 100 percent editable in Powerpoint. Download this now and use it in your presentations to impress your audience.
Straight Line Graph Ppt PowerPoint Presentation Visual Aids Inspiration Cpb
Presenting this set of slides with name straight line graph ppt powerpoint presentation visual aids inspiration cpb. This is an editable Powerpoint three stages graphic that deals with topics like straight line graph to help convey your message better graphically. This product is a premium product available for immediate download and is 100 percent editable in Powerpoint. Download this now and use it in your presentations to impress your audience.
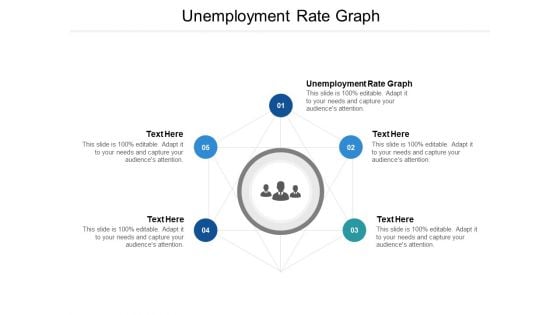
Unemployment Rate Graph Ppt PowerPoint Presentation Infographics Gallery Cpb
Presenting this set of slides with name unemployment rate graph ppt powerpoint presentation infographics gallery cpb. This is an editable Powerpoint five stages graphic that deals with topics like unemployment rate graph to help convey your message better graphically. This product is a premium product available for immediate download and is 100 percent editable in Powerpoint. Download this now and use it in your presentations to impress your audience.
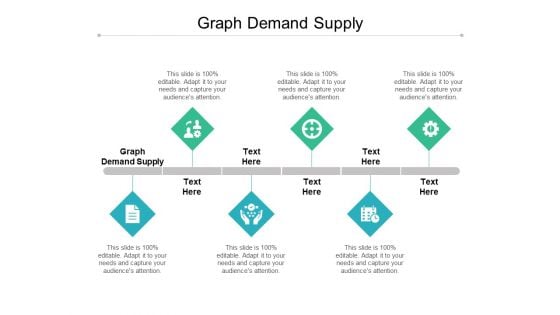
Graph Demand Supply Ppt PowerPoint Presentation Layouts Design Templates Cpb
Presenting this set of slides with name graph demand supply ppt powerpoint presentation layouts design templates cpb. This is an editable Powerpoint six stages graphic that deals with topics like graph demand supply to help convey your message better graphically. This product is a premium product available for immediate download and is 100 percent editable in Powerpoint. Download this now and use it in your presentations to impress your audience.
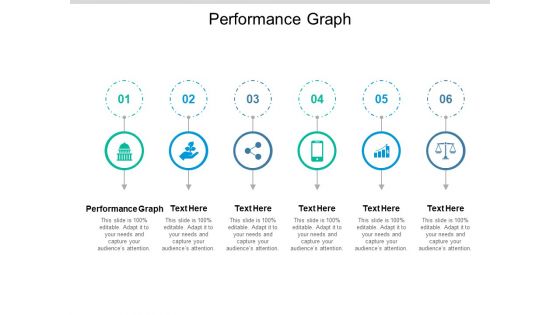
Performance Graph Ppt PowerPoint Presentation Summary Example Topics Cpb
Presenting this set of slides with name performance graph ppt powerpoint presentation summary example topics cpb. This is an editable Powerpoint six stages graphic that deals with topics like performance graph to help convey your message better graphically. This product is a premium product available for immediate download and is 100 percent editable in Powerpoint. Download this now and use it in your presentations to impress your audience.
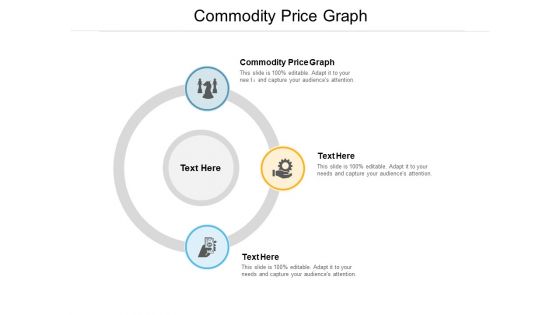
Commodity Price Graph Ppt PowerPoint Presentation Professional Information Cpb Pdf
Presenting this set of slides with name commodity price graph ppt powerpoint presentation professional information cpb pdf. This is an editable Powerpoint three stages graphic that deals with topics like commodity price graph to help convey your message better graphically. This product is a premium product available for immediate download and is 100 percent editable in Powerpoint. Download this now and use it in your presentations to impress your audience.

Credit Score Graph Ppt PowerPoint Presentation Model Visuals Cpb Pdf
Presenting this set of slides with name credit score graph ppt powerpoint presentation model visuals cpb pdf. This is an editable Powerpoint four stages graphic that deals with topics like credit score graph to help convey your message better graphically. This product is a premium product available for immediate download and is 100 percent editable in Powerpoint. Download this now and use it in your presentations to impress your audience.
Data Flow Graph Ppt PowerPoint Presentation Model Infographics Cpb Pdf
Presenting this set of slides with name data flow graph ppt powerpoint presentation model infographics cpb pdf. This is an editable Powerpoint six stages graphic that deals with topics like data flow graph to help convey your message better graphically. This product is a premium product available for immediate download and is 100 percent editable in Powerpoint. Download this now and use it in your presentations to impress your audience.
Deficit Spending Graph Ppt PowerPoint Presentation Summary Example Cpb Pdf
Presenting this set of slides with name deficit spending graph ppt powerpoint presentation summary example cpb pdf. This is an editable Powerpoint six stages graphic that deals with topics like deficit spending graph to help convey your message better graphically. This product is a premium product available for immediate download and is 100 percent editable in Powerpoint. Download this now and use it in your presentations to impress your audience.
Budget Constraint Graph Ppt PowerPoint Presentation Portfolio Mockup Cpb Pdf
Presenting this set of slides with name budget constraint graph ppt powerpoint presentation portfolio mockup cpb pdf. This is an editable Powerpoint six stages graphic that deals with topics like budget constraint graph to help convey your message better graphically. This product is a premium product available for immediate download and is 100 percent editable in Powerpoint. Download this now and use it in your presentations to impress your audience.
Period Sinusoidal Graph Ppt PowerPoint Presentation Summary Designs Cpb Pdf
Presenting this set of slides with name period sinusoidal graph ppt powerpoint presentation summary designs cpb pdf. This is an editable Powerpoint four stages graphic that deals with topics like period sinusoidal graph to help convey your message better graphically. This product is a premium product available for immediate download and is 100 percent editable in Powerpoint. Download this now and use it in your presentations to impress your audience.
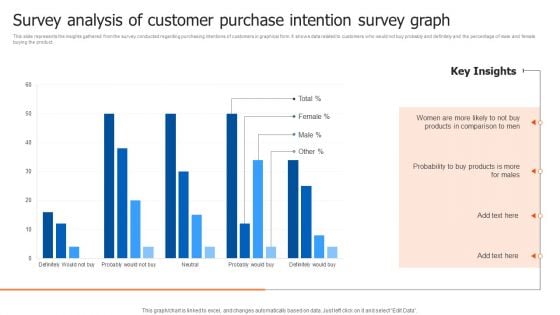
Survey Analysis Of Customer Purchase Intention Survey Graph Structure PDF
This slide represents the insights gathered from the survey conducted regarding purchasing intentions of customers in graphical form. It shows data related to customers who would not buy probably and definitely and the percentage of male and female buying the product. Pitch your topic with ease and precision using this Survey Analysis Of Customer Purchase Intention Survey Graph Structure PDF. This layout presents information on Probability, Products, Key Insights. It is also available for immediate download and adjustment. So, changes can be made in the color, design, graphics or any other component to create a unique layout.
Target Revenue With Graph Icon Ppt PowerPoint Presentation Portfolio Elements
Presenting this set of slides with name target revenue with graph icon ppt powerpoint presentation portfolio elements. This is a one stage process. The stages in this process are target revenue, target dollar revenue, businessmen shows. This is a completely editable PowerPoint presentation and is available for immediate download. Download now and impress your audience.

 Home
Home