Sales Graph
Small And Medium Business Weekly Sales Bar Graph Ppt PowerPoint Presentation Icon Diagrams PDF
Showcasing this set of slides titled small and medium business weekly sales bar graph ppt powerpoint presentation icon diagrams pdf. The topics addressed in these templates are small and medium business weekly sales bar graph. All the content presented in this PPT design is completely editable. Download it and make adjustments in color, background, font etc. as per your unique business setting.
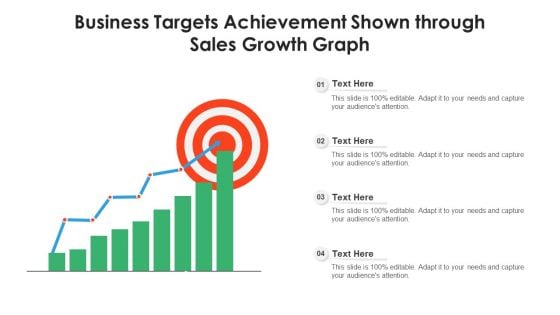
Business Targets Achievement Shown Through Sales Growth Graph Ppt PowerPoint Presentation Gallery Elements PDF
Pitch your topic with ease and precision using this business targets achievement shown through sales growth graph ppt powerpoint presentation gallery elements pdf. This layout presents information on business targets achievement shown through sales growth graph. It is also available for immediate download and adjustment. So, changes can be made in the color, design, graphics or any other component to create a unique layout.
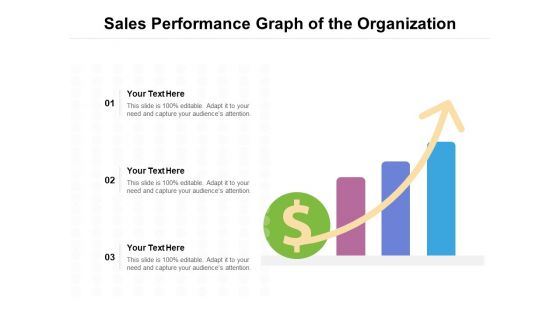
Sales Performance Graph Of The Organization Ppt PowerPoint Presentation Gallery Slide Portrait PDF
Presenting this set of slides with name sales performance graph of the organization ppt powerpoint presentation gallery slide portrait pdf. This is a three stage process. The stages in this process are sales performance graph of the organization. This is a completely editable PowerPoint presentation and is available for immediate download. Download now and impress your audience.
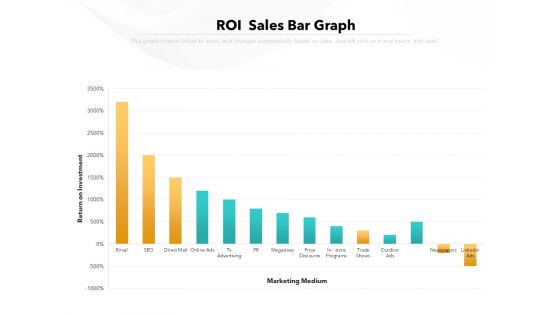
ROI Sales Bar Graph Ppt PowerPoint Presentation Gallery Designs Download PDF
Presenting this set of slides with name roi sales bar graph ppt powerpoint presentation gallery designs download pdf. The topics discussed in these slide is roi sales bar graph. This is a completely editable PowerPoint presentation and is available for immediate download. Download now and impress your audience.
Business Meeting Icon With Sales Growth Graph Ppt PowerPoint Presentation Slides Template PDF
Presenting this set of slides with name business meeting icon with sales growth graph ppt powerpoint presentation slides template pdf. This is a three stage process. The stages in this process are business meeting icon with sales growth graph. This is a completely editable PowerPoint presentation and is available for immediate download. Download now and impress your audience.
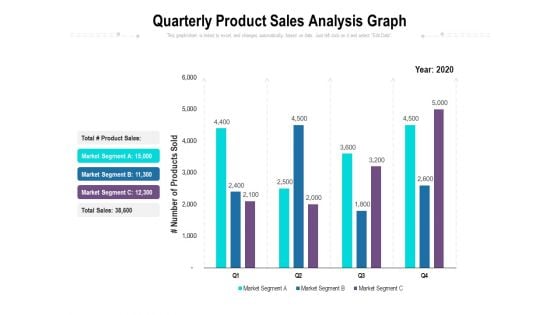
Quarterly Product Sales Analysis Graph Ppt PowerPoint Presentation Portfolio Slide Download PDF
Presenting this set of slides with name quarterly product sales analysis graph ppt powerpoint presentation portfolio slide download pdf. The topics discussed in these slides are product sales, market segment, total sales, number of products sold, year 2020. This is a completely editable PowerPoint presentation and is available for immediate download. Download now and impress your audience.
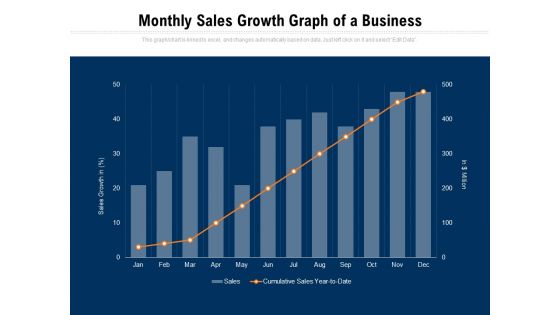
Monthly Sales Growth Graph Of A Business Ppt PowerPoint Presentation Ideas File Formats PDF
Presenting this set of slides with name monthly sales growth graph of a business ppt powerpoint presentation ideas file formats pdf. The topics discussed in these slides are sales growth, cumulative sales year. This is a completely editable PowerPoint presentation and is available for immediate download. Download now and impress your audience.
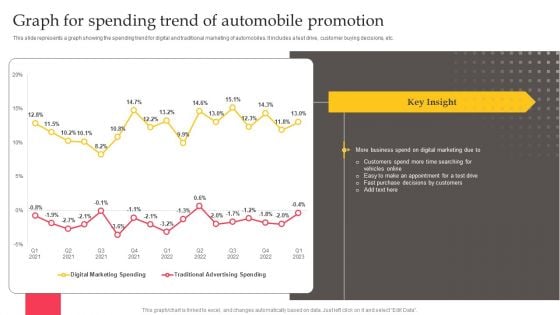
Executing Automotive Marketing Tactics For Sales Boost Graph For Spending Trend Information PDF
This slide represents a graph showing the spending trend for digital and traditional marketing of automobiles. It includes a test drive, customer buying decisions, etc. There are so many reasons you need a Executing Automotive Marketing Tactics For Sales Boost Graph For Spending Trend Information PDF. The first reason is you can not spend time making everything from scratch, Thus, Slidegeeks has made presentation templates for you too. You can easily download these templates from our website easily.
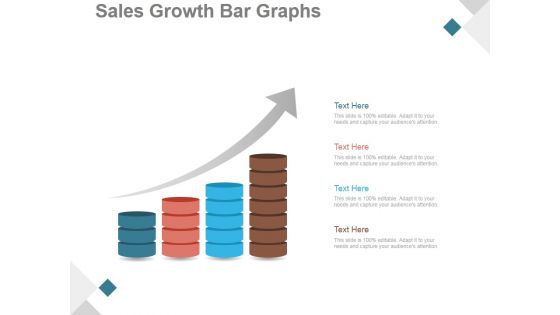
Sales Growth Bar Graphs Ppt PowerPoint Presentation Images
This is a sales growth bar graphs ppt powerpoint presentation images. This is a four stage process. The stages in this process are business, strategy, marketing, growth, bar graph, sales management.
Bar Graph Showing Sales PowerPoint Templates And PowerPoint Themes 0512
Microsoft Powerpoint Templates and Background with business graph with arrow -These templates can be used for presentations relating to-Business graph with arrow, finance, background, sales, success, business -Bar Graph Showing Sales PowerPoint Templates And PowerPoint Themes 0512 Club your thoughts with our Bar Graph Showing Sales PowerPoint Templates And PowerPoint Themes 0512. Together they will create an astounding effect.
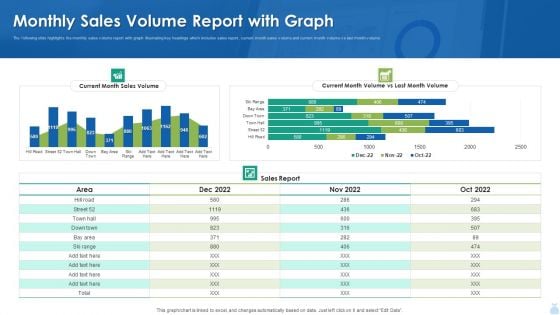
Monthly Sales Volume Report With Graph Demonstration PDF
The following slide highlights the monthly sales volume report with graph illustrating key headings which includes sales report, current month sales volume and current month volume vs last month volume. Showcasing this set of slides titled Monthly Sales Volume Report With Graph Demonstration PDF. The topics addressed in these templates are Monthly Sales, Volume Report, Graph. All the content presented in this PPT design is completely editable. Download it and make adjustments in color, background, font etc. as per your unique business setting.
Bar Graph Financial Sales Product Ppt PowerPoint Presentation Icon Vector
This is a bar graph financial sales product ppt powerpoint presentation icon vector. This is a five stage process. The stages in this process are business, management, financial, marketing, sales.
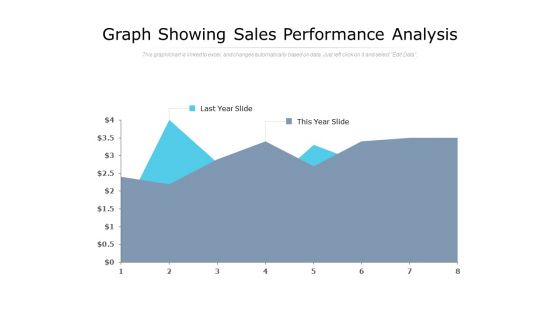
Graph Showing Sales Performance Analysis Ppt PowerPoint Presentation Professional Information
Presenting this set of slides with name graph showing sales performance analysis ppt powerpoint presentation professional information. The topics discussed in these slide is graph showing sales performance analysis. This is a completely editable PowerPoint presentation and is available for immediate download. Download now and impress your audience.
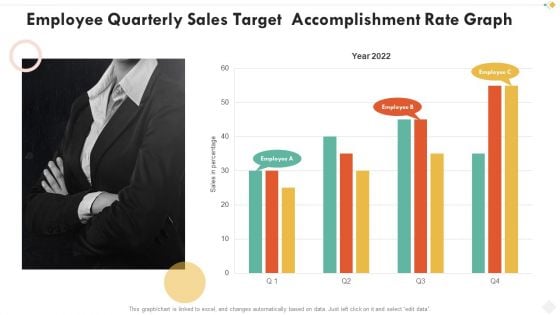
Employee Quarterly Sales Target Accomplishment Rate Graph Demonstration PDF
Pitch your topic with ease and precision using this employee quarterly sales target accomplishment rate graph demonstration pdf. This layout presents information on employee quarterly sales target accomplishment rate graph. It is also available for immediate download and adjustment. So, changes can be made in the color, design, graphics or any other component to create a unique layout.
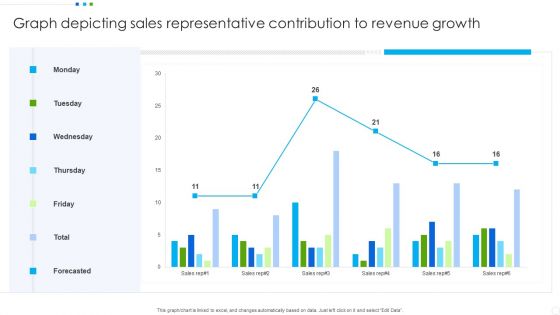
Graph Depicting Sales Representative Contribution To Revenue Growth Graphics PDF
Showcasing this set of slides titled Graph Depicting Sales Representative Contribution To Revenue Growth Graphics PDF. The topics addressed in these templates are Graph Depicting Sales, Revenue Growth. All the content presented in this PPT design is completely editable. Download it and make adjustments in color, background, font etc. as per your unique business setting.
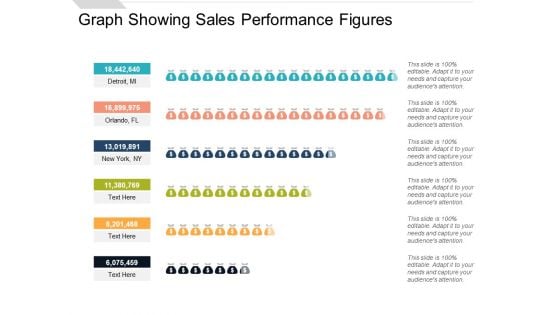
Graph Showing Sales Performance Figures Ppt PowerPoint Presentation Infographics Topics
Presenting this set of slides with name graph showing sales performance figures ppt powerpoint presentation infographics topics. This is a six stage process. The stages in this process are people graph, sales performance, population data demographics. This is a completely editable PowerPoint presentation and is available for immediate download. Download now and impress your audience.
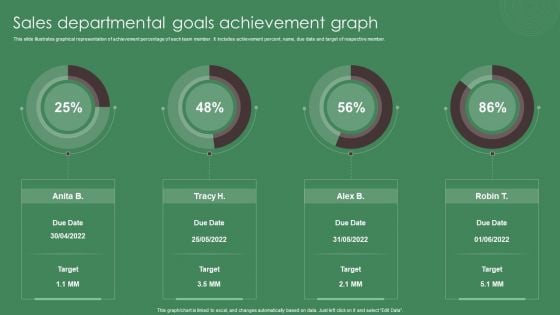
Sales Departmental Goals Achievement Graph Ppt Inspiration Slide Download PDF
This slide illustrates graphical representation of achievement percentage of each team member. It includes achievement percent, name, due date and target of respective member. Pitch your topic with ease and precision using this Sales Departmental Goals Achievement Graph Ppt Inspiration Slide Download PDF. This layout presents information on Sales Departmental, Goals, Achievement Graph. It is also available for immediate download and adjustment. So, changes can be made in the color, design, graphics or any other component to create a unique layout.
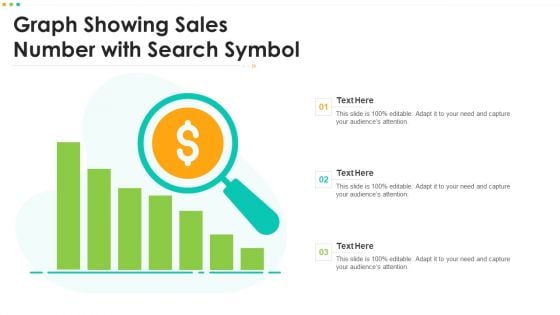
Graph Showing Sales Number With Search Symbol Professional PDF
Persuade your audience using this Graph Showing Sales Number With Search Symbol Professional PDF. This PPT design covers three stages, thus making it a great tool to use. It also caters to a variety of topics including Graph Showing Sales Number With Search Symbol. Download this PPT design now to present a convincing pitch that not only emphasizes the topic but also showcases your presentation skills.
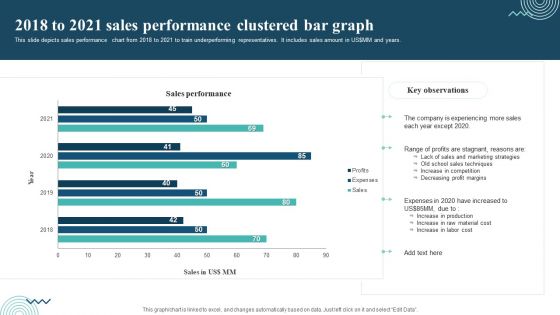
2018 To 2021 Sales Performance Clustered Bar Graph Graphics PDF
Showcasing this set of slides titled 2018 To 2021 Sales Performance Clustered Bar Graph Graphics PDF. The topics addressed in these templates are Range Of Profits, Increase In Production, Profits Are Stagnant. All the content presented in this PPT design is completely editable. Download it and make adjustments in color, background, font etc. as per your unique business setting.
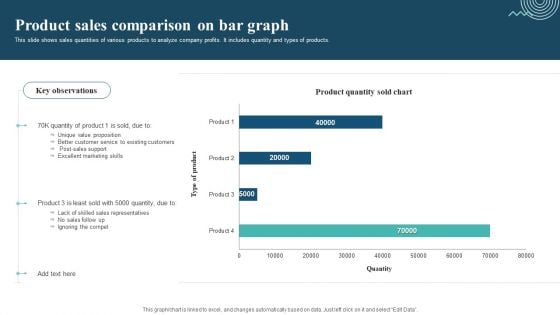
Product Sales Comparison On Bar Graph Sample PDF
This slide shows sales quantities of various products to analyze company profits. It includes quantity and types of products. Pitch your topic with ease and precision using this Product Sales Comparison On Bar Graph Sample PDF. This layout presents information on Unique Value Proposition, Excellent Marketing Skills, Ignoring The Compet. It is also available for immediate download and adjustment. So, changes can be made in the color, design, graphics or any other component to create a unique layout.
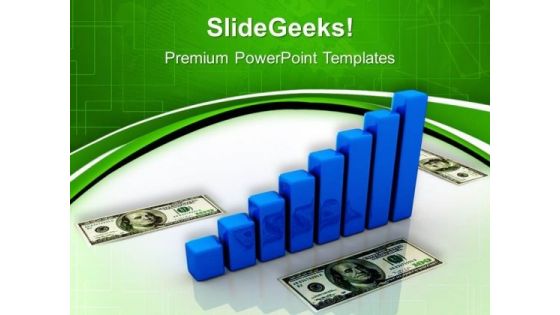
Business Graph Money Sales PowerPoint Templates And PowerPoint Themes 1112
We present our Business Graph Money Sales PowerPoint Templates And PowerPoint Themes 1112.Use our Marketing PowerPoint Templates because, Weak Links & Chains:- Chain reactions and the element of teamwork add value to your efforts. Use our Success PowerPoint Templates because, They pinpoint the core values of your organisation. Use our Business PowerPoint Templates because, Sales Template:- Generation of sales is the core of any business. Use our Finance PowerPoint Templates because,represent the proress in our lives. Use our Money PowerPoint Templates because, You have a great training programme in mind to upgrade the skills of your staff.Use these PowerPoint slides for presentations relating to Money growth, money, marketing, finance, business, success. The prominent colors used in the PowerPoint template are Blue, Black, Gray Our Business Graph Money Sales PowerPoint Templates And PowerPoint Themes 1112 are truly fair minded. They take all arguments into account.
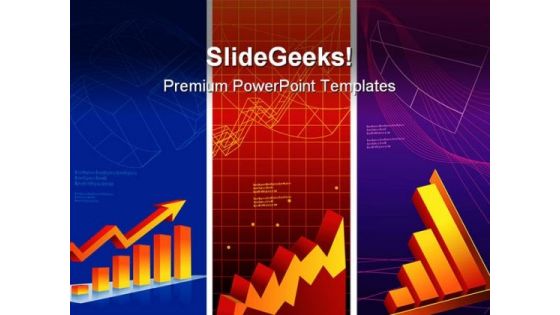
Graph Shows Profit Sales PowerPoint Templates And PowerPoint Backgrounds 0711
Microsoft PowerPoint Template and Background with finance concept Paint the canvas with our Graph Shows Profit Sales PowerPoint Templates And PowerPoint Backgrounds 0711. Just download, type and present.
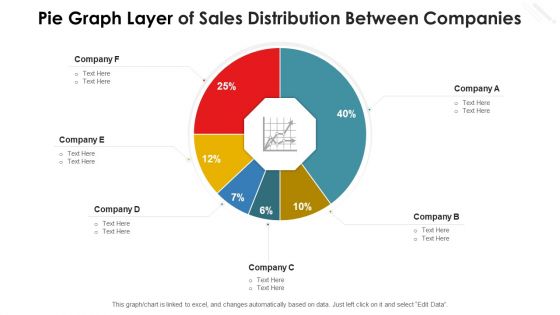
Pie Graph Layer Of Sales Distribution Between Companies Template PDF
Showcasing this set of slides titled pie graph layer of sales distribution between companies template pdf. The topics addressed in these templates are pie graph layer of sales distribution between companies. All the content presented in this PPT design is completely editable. Download it and make adjustments in color, background, font etc. as per your unique business setting.
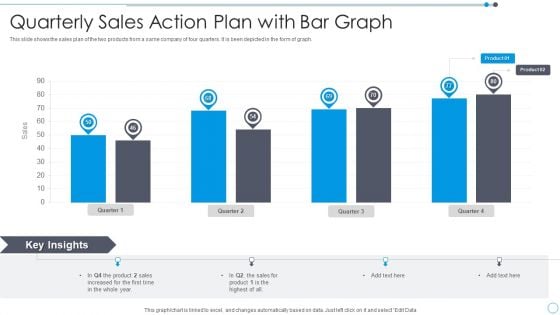
Quarterly Sales Action Plan With Bar Graph Graphics PDF
This slide shows the sales plan of the two products from a same company of four quarters. It is been depicted in the form of graph.Showcasing this set of slides titled Quarterly Sales Action Plan With Bar Graph Graphics PDF. The topics addressed in these templates are Quarterly Sales Action Plan With Bar Graph. All the content presented in this PPT design is completely editable. Download it and make adjustments in color, background, font etc. as per your unique business setting.
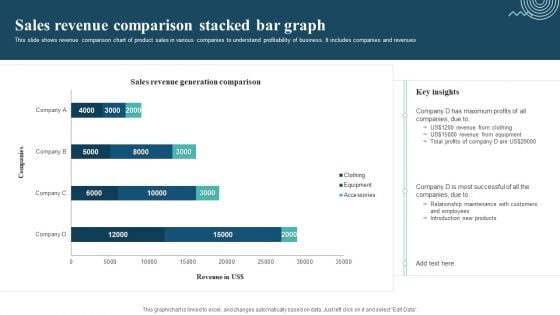
Sales Revenue Comparison Stacked Bar Graph Mockup PDF
This slide shows revenue comparison chart of product sales in various companies to understand profitability of business. It includes companies and revenues. Showcasing this set of slides titled Sales Revenue Comparison Stacked Bar Graph Mockup PDF. The topics addressed in these templates are Sales Revenue Comparison, Revenue From Clothing, Revenue From Equipment. All the content presented in this PPT design is completely editable. Download it and make adjustments in color, background, font etc. as per your unique business setting.
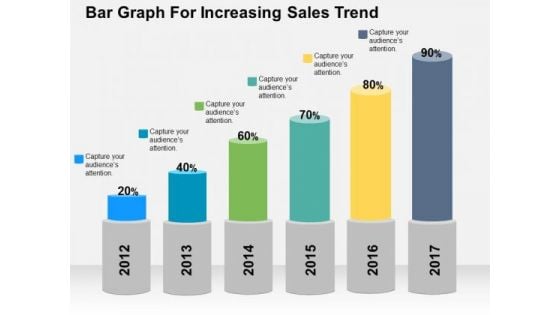
Bar Graph For Increasing Sales Trend PowerPoint Template
Deliver amazing presentations with our above template showing bar graph with percentage values. You may download this slide to depict increase in sales trends. Capture the attention of your audience using this diagram.
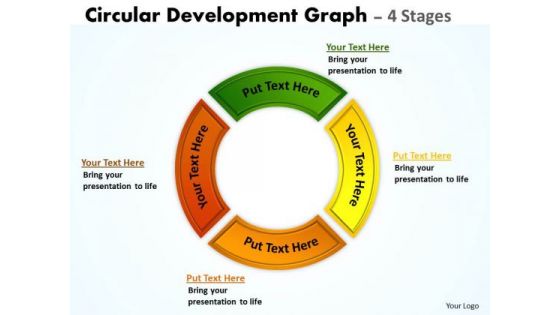
Strategic Management Circular Development Graph 4 Stages Sales Diagram
Our Strategic_Management_Circular_Development_Graph_4_Stages_Sales_Diagram Powerpoint Templates And Your Ideas Make A Great Doubles Pair. Play The Net With Assured Hands.
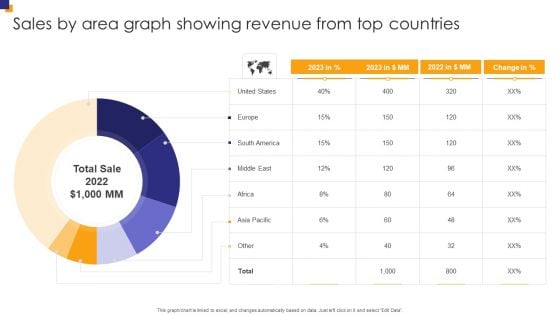
Sales By Area Graph Showing Revenue From Top Countries Inspiration PDF
Showcasing this set of slides titled Sales By Area Graph Showing Revenue From Top Countries Inspiration PDF. The topics addressed in these templates are Sales Area, Graph Showing, Revenue Countries. All the content presented in this PPT design is completely editable. Download it and make adjustments in color, background, font etc. as per your unique business setting.
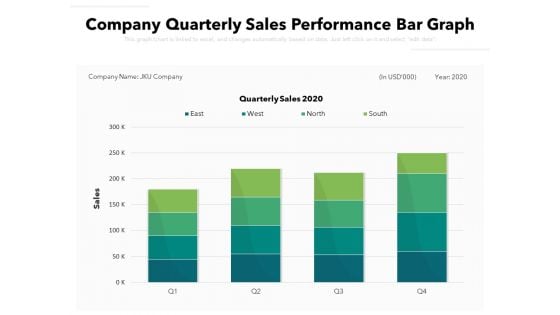
Company Quarterly Sales Performance Bar Graph Ppt PowerPoint Presentation File Templates PDF
Pitch your topic with ease and precision using this company quarterly sales performance bar graph ppt powerpoint presentation file templates pdf. This layout presents information on company quarterly sales performance bar graph. It is also available for immediate download and adjustment. So, changes can be made in the color, design, graphics or any other component to create a unique layout.
Vertical Integration Sales Strategy Incremental Graph Icon Ppt PowerPoint Presentation Gallery Example PDF
Presenting this set of slides with name vertical integration sales strategy incremental graph icon ppt powerpoint presentation gallery example pdf. This is a three stage process. The stages in this process are vertical integration sales strategy incremental graph icon. This is a completely editable PowerPoint presentation and is available for immediate download. Download now and impress your audience.
Online Sales With Bar Graph Vector Icon Ppt PowerPoint Presentation File Outline PDF
Presenting online sales with bar graph vector icon ppt powerpoint presentation file outline pdf to dispense important information. This template comprises three stages. It also presents valuable insights into the topics including online sales with bar graph vector icon. This is a completely customizable PowerPoint theme that can be put to use immediately. So, download it and address the topic impactfully.
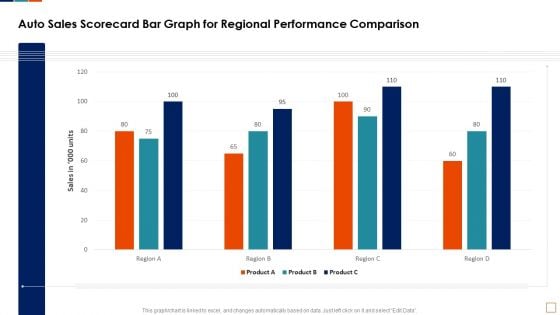
Auto Sales Scorecard Bar Graph For Regional Performance Comparison Infographics PDF
This graph or chart is linked to excel, and changes automatically based on data. Just left click on it and select Edit Data. Deliver an awe inspiring pitch with this creative Auto Sales Scorecard Bar Graph For Regional Performance Comparison Infographics PDF bundle. Topics like Auto Sales Scorecard, Bar Graph Regional, Performance Comparison Product can be discussed with this completely editable template. It is available for immediate download depending on the needs and requirements of the user.
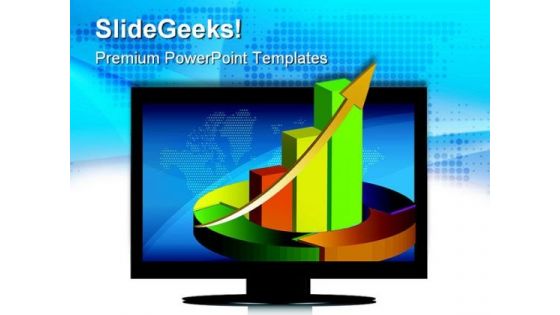
Screen Showing Business Graph Sales PowerPoint Templates And PowerPoint Backgrounds 0411
Microsoft PowerPoint Template and Background with graphics flat screen Be an eyeopener with our Screen Showing Business Graph Sales PowerPoint Templates And PowerPoint Backgrounds 0411. Educate your audience on the decisive details.
Screen Showing Business Graph Sales PowerPoint Themes And PowerPoint Slides 0411
Microsoft PowerPoint Theme and Slide with graphics flat screen Fancy yourself as a success. Our Screen Showing Business Graph Sales PowerPoint Themes And PowerPoint Slides 0411 will actually make it so.
Monthly Sales Result Bar Graph PowerPoint Templates Ppt Backgrounds For Slides 0613
Our Monthly Sales Result Bar Graph PowerPoint Templates PPT Backgrounds For Slides make good beasts of burden. Place all your demands on them. Deliver the right dose with our Finance PowerPoint Templates. Your ideas will get the correct illumination. Your abilities have been lying dormant. Awaken them with our Marketing PowerPoint Templates. Amaze yourself with our Monthly Sales Result Bar Graph PowerPoint Templates Ppt Backgrounds For Slides 0613. You will be astounded by what is on offer.

Sales Result Bar Graph Discussion With Team PowerPoint Templates Ppt Backgrounds For Slides 0713
Be your own editor with our Sales Result Bar Graph Discussion With Team PowerPoint Templates PPT Backgrounds For Slides. Align your thoughts as per your wishes. Land the idea with our People PowerPoint Templates. Help it grow with your thoughts. Cover the compass with our Teamwork PowerPoint Templates. Your ideas will be acceptable to all. Facing upto problems is part of it. Define the answers on our Sales Result Bar Graph Discussion With Team PowerPoint Templates Ppt Backgrounds For Slides 0713.
Present Your Sales And Growth Graph PowerPoint Templates Ppt Backgrounds For Slides 0713
Doll up your thoughts with our Present Your Sales And Growth Graph PowerPoint Templates PPT Backgrounds For Slides. They will make a pretty picture. They say a dog is man's best friend. Our Puzzles or Jigsaws PowerPoint Templates come a close second. Establish the dominance of your ideas. Our Pie Charts PowerPoint Templates will put them on top. Help develop a solution with our Present Your Sales And Growth Graph PowerPoint Templates Ppt Backgrounds For Slides 0713. Just download, type and present.
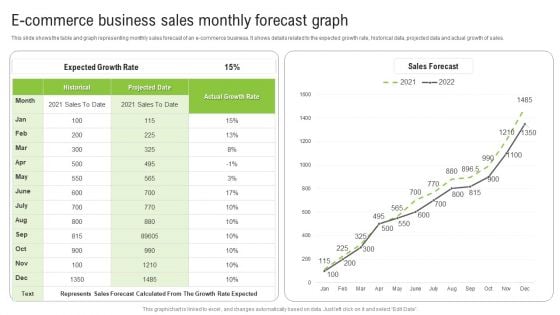
E Commerce Business Sales Monthly Forecast Graph Ppt Infographics Show PDF
This slide shows the table and graph representing monthly sales forecast of an e-commerce business. It shows details related to the expected growth rate, historical data, projected data and actual growth of sales. Pitch your topic with ease and precision using this E Commerce Business Sales Monthly Forecast Graph Ppt Infographics Show PDF. This layout presents information on Expected Growth Rate, Historical, Actual Growth Rate. It is also available for immediate download and adjustment. So, changes can be made in the color, design, graphics or any other component to create a unique layout.
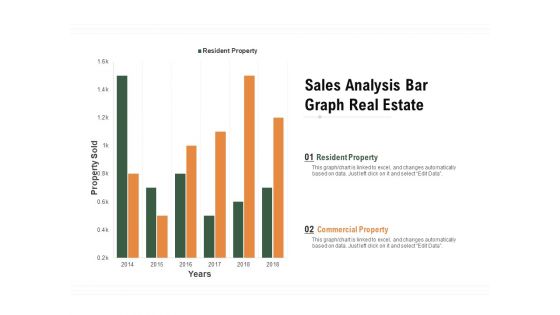
Sales Analysis Bar Graph Real Estate Ppt PowerPoint Presentation Infographic Template Show PDF
Pitch your topic with ease and precision using this sales analysis bar graph real estate ppt powerpoint presentation infographic template show pdf. This layout presents information on resident property, commercial property, property sold, 2014 to 2018. It is also available for immediate download and adjustment. So, changes can be made in the color, design, graphics or any other component to create a unique layout.
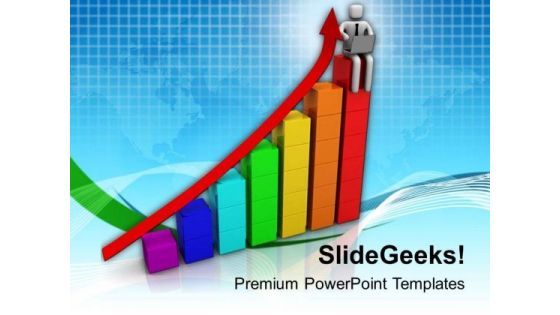
Check The Sales And Growth Graph PowerPoint Templates Ppt Backgrounds For Slides 0813
Touch base with our Check The Sales And Growth Graph PowerPoint Templates PPT Backgrounds For Slides. Review your growth with your audience. Take a deep dive with our Arrows PowerPoint Templates. Get into the nitty-gritty of it all. Plan your storyboard with our Computer PowerPoint Templates. Give an outline to the solutions you have.
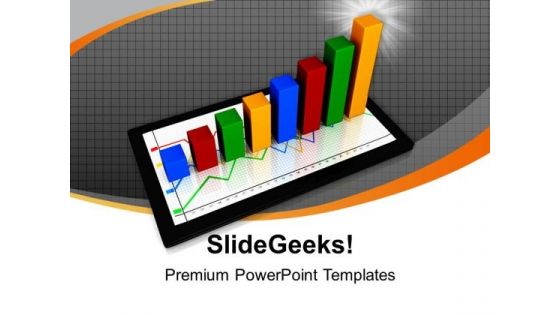
Computer Tablet With Business Graph Sales PowerPoint Templates Ppt Backgrounds For Slides 1212
We present our Computer Tablet With Business Graph Sales PowerPoint Templates PPT Backgrounds For Slides 1212.Download our Technology PowerPoint Templates because you have the ideas and plans on how to achieve success. Present our Money PowerPoint Templates because you can Show them the way, be Captain of the ship and lead them to new shores. Download our Marketing PowerPoint Templates because The marketplace is the merger of your dreams and your ability. Download and present our Computer PowerPoint Templates because this shows ideas to get the different elements of your Business to mesh and coalesce into a focused team driven by a common goal to achieve the common aim with Excellence. Download our Success PowerPoint Templates because iT outlines the entire thought process for the benefit of others. Tell it to the world with your characteristic aplomb.Use these PowerPoint slides for presentations relating to Modern financial analysis, technology, money, marketing, computer, success. The prominent colors used in the PowerPoint template are Blue, Red, Green. Professionals tell us our Computer Tablet With Business Graph Sales PowerPoint Templates PPT Backgrounds For Slides 1212 provide great value for your money. Be assured of finding the best projection to highlight your words. Use our computer PowerPoint templates and PPT Slides are designed by professionals We assure you our Computer Tablet With Business Graph Sales PowerPoint Templates PPT Backgrounds For Slides 1212 are Bold. We assure you our PowerPoint templates and PPT Slides will make the presenter look like a pro even if they are not computer savvy. Presenters tell us our Computer Tablet With Business Graph Sales PowerPoint Templates PPT Backgrounds For Slides 1212 are Zippy. PowerPoint presentation experts tell us our money PowerPoint templates and PPT Slides are Chic. You have been given an exacting task. Plan your approach with our Computer Tablet With Business Graph Sales PowerPoint Templates Ppt Backgrounds For Slides 1212.

Multicolored Bar Graph Sales Business PowerPoint Templates Ppt Background For Slides 1112
We present our Multicolored Bar Graph Sales Business PowerPoint Templates PPT Background for Slides 1112.Use our Business PowerPoint Templates because; Show them how you can save the day. Use our Success PowerPoint Templates because, However you are aware of some pitfalls ahead where you need to be cautious not to over and avoid a stall. Use our Marketing PowerPoint Templates because, you have the basic goal in mind. Use our Finance PowerPoint Templates because, Colors generate instant reactions in our brains. Use our Shapes PowerPoint Templates because, Gears interconnected: - The Gear Train is a basic element of living and daily business. Use these PowerPoint slides for presentations relating to Multicolor bar graph, business, success, marketing, finance, shapes. The prominent colors used in the PowerPoint template are Red, Green, and Orange Deliver fascinating presentations with our Multicolored Bar Graph Sales Business PowerPoint Templates Ppt Background For Slides 1112. Dont waste time struggling with PowerPoint. Let us do it for you.
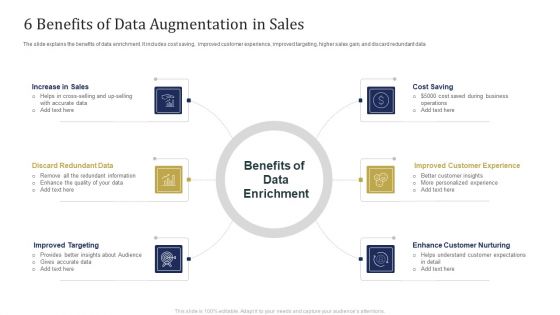
6 Benefits Of Data Augmentation In Sales Ppt Diagram Graph Charts PDF
The slide explains the benefits of data enrichment. It includes cost saving, improved customer experience, improved targeting, higher sales gain, and discard redundant data. Presenting 6 Benefits Of Data Augmentation In Sales Ppt Diagram Graph Charts PDF to dispense important information. This template comprises six stages. It also presents valuable insights into the topics including Discard Redundant Data, Improved Targeting, Enhance Customer Nurturing, Cost Saving. This is a completely customizable PowerPoint theme that can be put to use immediately. So, download it and address the topic impactfully.
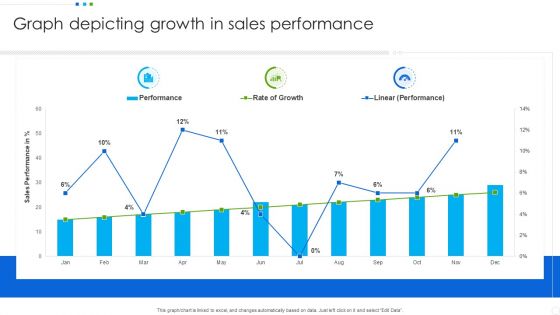
Graph Depicting Growth In Sales Performance Professional PDF
Pitch your topic with ease and precision using this Graph Depicting Growth In Sales Performance Professional PDF. This layout presents information on Graph Depicting, Sales Performance. It is also available for immediate download and adjustment. So, changes can be made in the color, design, graphics or any other component to create a unique layout.
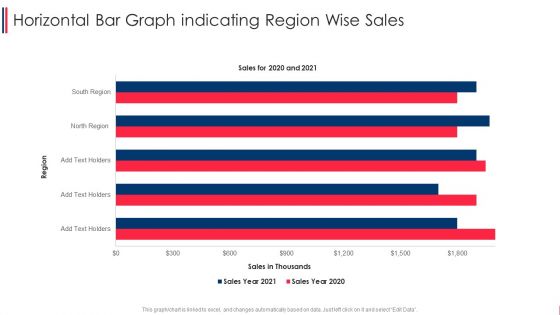
Horizontal Bar Graph Indicating Region Wise Sales Formats PDF
Pitch your topic with ease and precision using this horizontal bar graph indicating region wise sales formats pdf. This layout presents information on horizontal bar graph indicating region wise sales. It is also available for immediate download and adjustment. So, changes can be made in the color, design, graphics or any other component to create a unique layout.
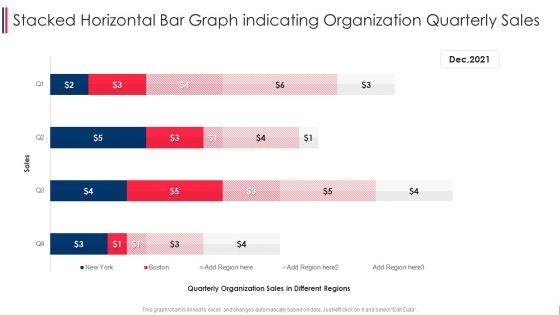
Stacked Horizontal Bar Graph Indicating Organization Quarterly Sales Graphics PDF
Pitch your topic with ease and precision using this stacked horizontal bar graph indicating organization quarterly sales graphics pdf. This layout presents information on stacked horizontal bar graph indicating organization quarterly sales. It is also available for immediate download and adjustment. So, changes can be made in the color, design, graphics or any other component to create a unique layout.
Direct Sales Lead Ppt Powerpoint Presentation Diagram Graph Charts Cpb
This is a direct sales lead ppt powerpoint presentation diagram graph charts cpb. This is a two stage process. The stages in this process are direct sales lead.
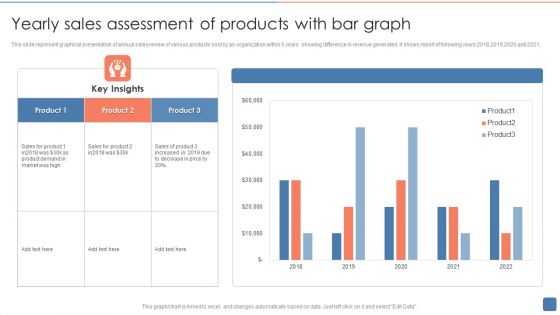
Yearly Sales Assessment Of Products With Bar Graph Structure PDF
This slide represent graphical presentation of annual sales review of various products sold by an organization within 5 years showing difference in revenue generated .It shows report of following years 2018,2019,2020,and 2021. Showcasing this set of slides titled Yearly Sales Assessment Of Products With Bar Graph Structure PDF. The topics addressed in these templates are Product, Sales Of Product, Product Demand. All the content presented in this PPT design is completely editable. Download it and make adjustments in color, background, font etc. as per your unique business setting.
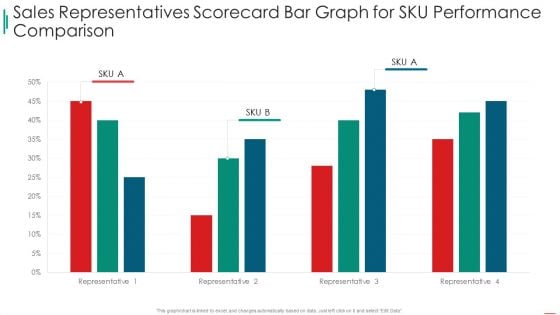
Sales Rep Scorecard Sales Representatives Scorecard Bar Graph For Sku Performance Comparison Clipart PDF
Deliver an awe inspiring pitch with this creative sales rep scorecard sales representatives scorecard bar graph for sku performance comparison clipart pdf bundle. Topics like sales representatives scorecard bar graph for sku performance comparison can be discussed with this completely editable template. It is available for immediate download depending on the needs and requirements of the user.
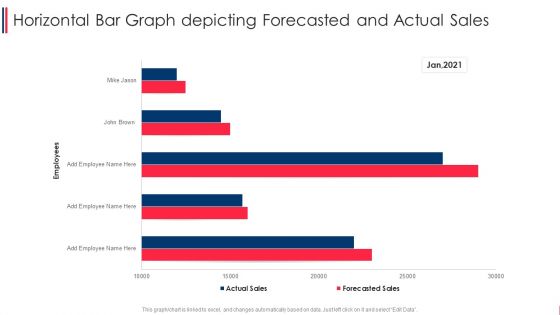
Horizontal Bar Graph Depicting Forecasted And Actual Sales Microsoft PDF
Showcasing this set of slides titled horizontal bar graph depicting forecasted and actual sales microsoft pdf. The topics addressed in these templates are horizontal bar graph depicting forecasted and actual sales. All the content presented in this PPT design is completely editable. Download it and make adjustments in color, background, font etc. as per your unique business setting.
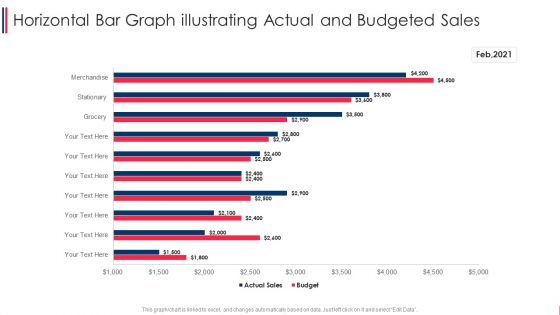
Horizontal Bar Graph Illustrating Actual And Budgeted Sales Background PDF
Showcasing this set of slides titled horizontal bar graph illustrating actual and budgeted sales background pdf. The topics addressed in these templates are horizontal bar graph illustrating actual and budgeted sales. All the content presented in this PPT design is completely editable. Download it and make adjustments in color, background, font etc. as per your unique business setting.
Horizontal Bar Graph Illustrating Yearly Products Sale Icons PDF
Showcasing this set of slides titled horizontal bar graph illustrating yearly products sale icons pdf. The topics addressed in these templates are horizontal bar graph illustrating yearly products sale icons. All the content presented in this PPT design is completely editable. Download it and make adjustments in color, background, font etc. as per your unique business setting.
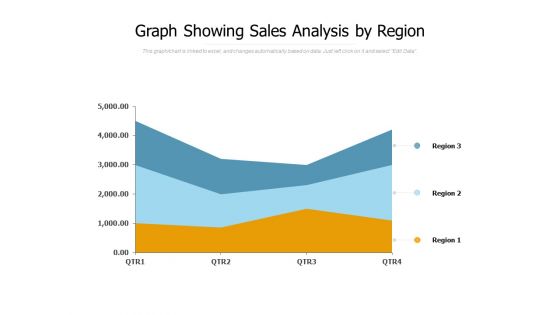
Graph Showing Sales Analysis By Region Ppt PowerPoint Presentation Inspiration Images
Presenting this set of slides with name graph showing sales analysis by region ppt powerpoint presentation inspiration images. The topics discussed in these slide is graph showing sales analysis by region. This is a completely editable PowerPoint presentation and is available for immediate download. Download now and impress your audience.
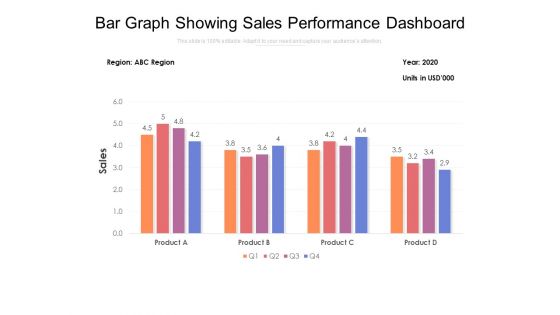
Bar Graph Showing Sales Performance Dashboard Ppt PowerPoint Presentation File Design Ideas PDF
Presenting this set of slides with name bar graph showing sales performance dashboard ppt powerpoint presentation file design ideas pdf. The topics discussed in these slide is bar graph showing sales performance dashboard. This is a completely editable PowerPoint presentation and is available for immediate download. Download now and impress your audience.
Pie Graph For Sales Strategy PowerPoint Templates Ppt Backgrounds For Slides 0413
We present our Pie Graph For Sales Strategy PowerPoint Templates PPT Backgrounds For Slides 0413.Download our Pie charts PowerPoint Templates because They will Put the wind in your sails. Skim smoothly over the choppy waters of the market. Download our Business PowerPoint Templates because You have the co-ordinates for your destination of success. Let our PowerPoint Templates and Slides map out your journey. Download our Sales PowerPoint Templates because It can Bubble and burst with your ideas. Present our Marketing PowerPoint Templates because Our PowerPoint Templates and Slides has conjured up a web of all you need with the help of our great team. Use them to string together your glistening ideas. Download and present our Shapes PowerPoint Templates because Our PowerPoint Templates and Slides will fulfill your every need. Use them and effectively satisfy the desires of your audience.Use these PowerPoint slides for presentations relating to Pie graph strategy for sales, pie charts, business, sales, marketing, shapes. The prominent colors used in the PowerPoint template are Pink, Black, Red. Your ideas will start a new epoch in your field. Take the first steps with our Pie Graph For Sales Strategy PowerPoint Templates Ppt Backgrounds For Slides 0413.
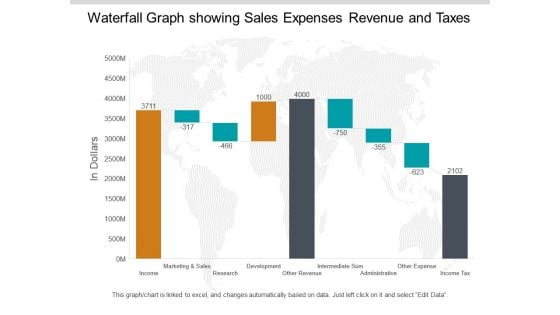
Waterfall Graph Showing Sales Expenses Revenue And Taxes Ppt PowerPoint Presentation Pictures Summary
This is a waterfall graph showing sales expenses revenue and taxes ppt powerpoint presentation pictures summary. This is a three stage process. The stages in this process are profit and loss, balance sheet, income statement, benefit and loss.
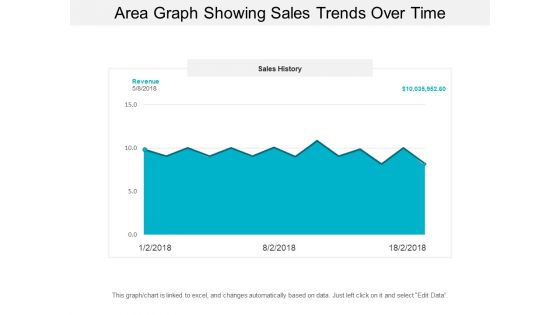
Area Graph Showing Sales Trends Over Time Ppt PowerPoint Presentation Model Background Designs
This is a area graph showing sales trends over time ppt powerpoint presentation model background designs. This is a three stage process. The stages in this process are financial analysis, quantitative, statistical modelling.
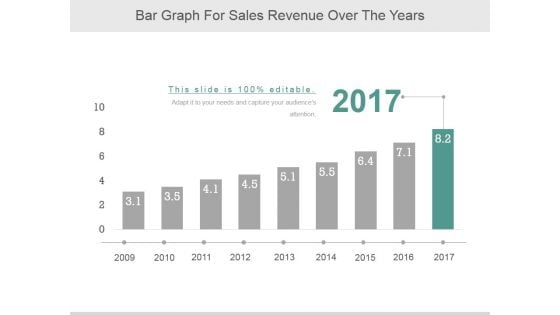
Bar Graph For Sales Revenue Over The Years Ppt PowerPoint Presentation Professional
This is a bar graph for sales revenue over the years ppt powerpoint presentation professional. This is a nine stage process. The stages in this process are business, marketing, growth, bar, years.
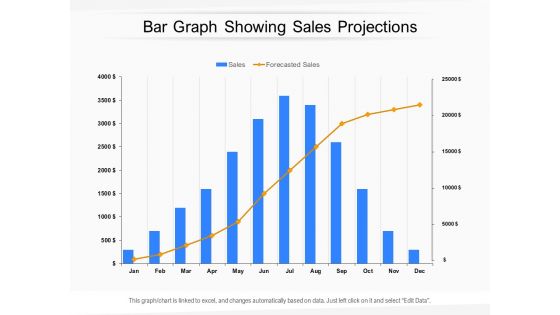
Bar Graph Showing Sales Projections Ppt PowerPoint Presentation Styles Graphics Download PDF
Presenting this set of slides with name bar graph showing sales projections ppt powerpoint presentation styles graphics download pdf. The topics discussed in these slides are Sales, Forecasted Sales. This is a completely editable PowerPoint presentation and is available for immediate download. Download now and impress your audience.
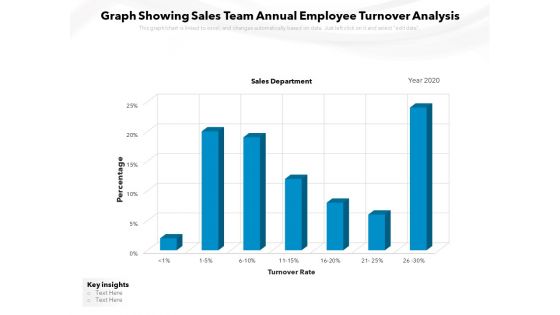
Graph Showing Sales Team Annual Employee Turnover Analysis Ppt PowerPoint Presentation Ideas PDF
Presenting this set of slides with name graph showing sales team annual employee turnover analysis ppt powerpoint presentation ideas pdf. The topics discussed in these slides are sales department, turnover rate, percentage, key insights, 2020. This is a completely editable PowerPoint presentation and is available for immediate download. Download now and impress your audience.

 Home
Home